
Power BI Blog: Power BI Connected Tables
7 September 2023
Welcome back to this week’s edition of the Power BI blog series. This week, we consider new capabilities that make it easier for users to add Power BI data to their Excel workbooks.
Microsoft has announced new capabilities that make it easier for users to add Power BI data to their Excel workbooks. Earlier this year, Microsoft introduced ‘Export with Live Connection’ for interactive reports. This made it easy for users to create Connected Tables in Excel sheets. Now, it has been updated, with the new capabilities rolling out as we write.
The new ‘Insert Table’ option is rolling out for the ‘Power BI Datasets’ pane in Excel. It enables users to create a connected table directly in Excel. This streamlines the workflow of adding data and is friendlier to more Excel users.
You may use the Data Ribbon -> From Power Platform-> From Power BI (Microsoft) option to launch the ‘Power BI Datasets’ side pane in Excel.
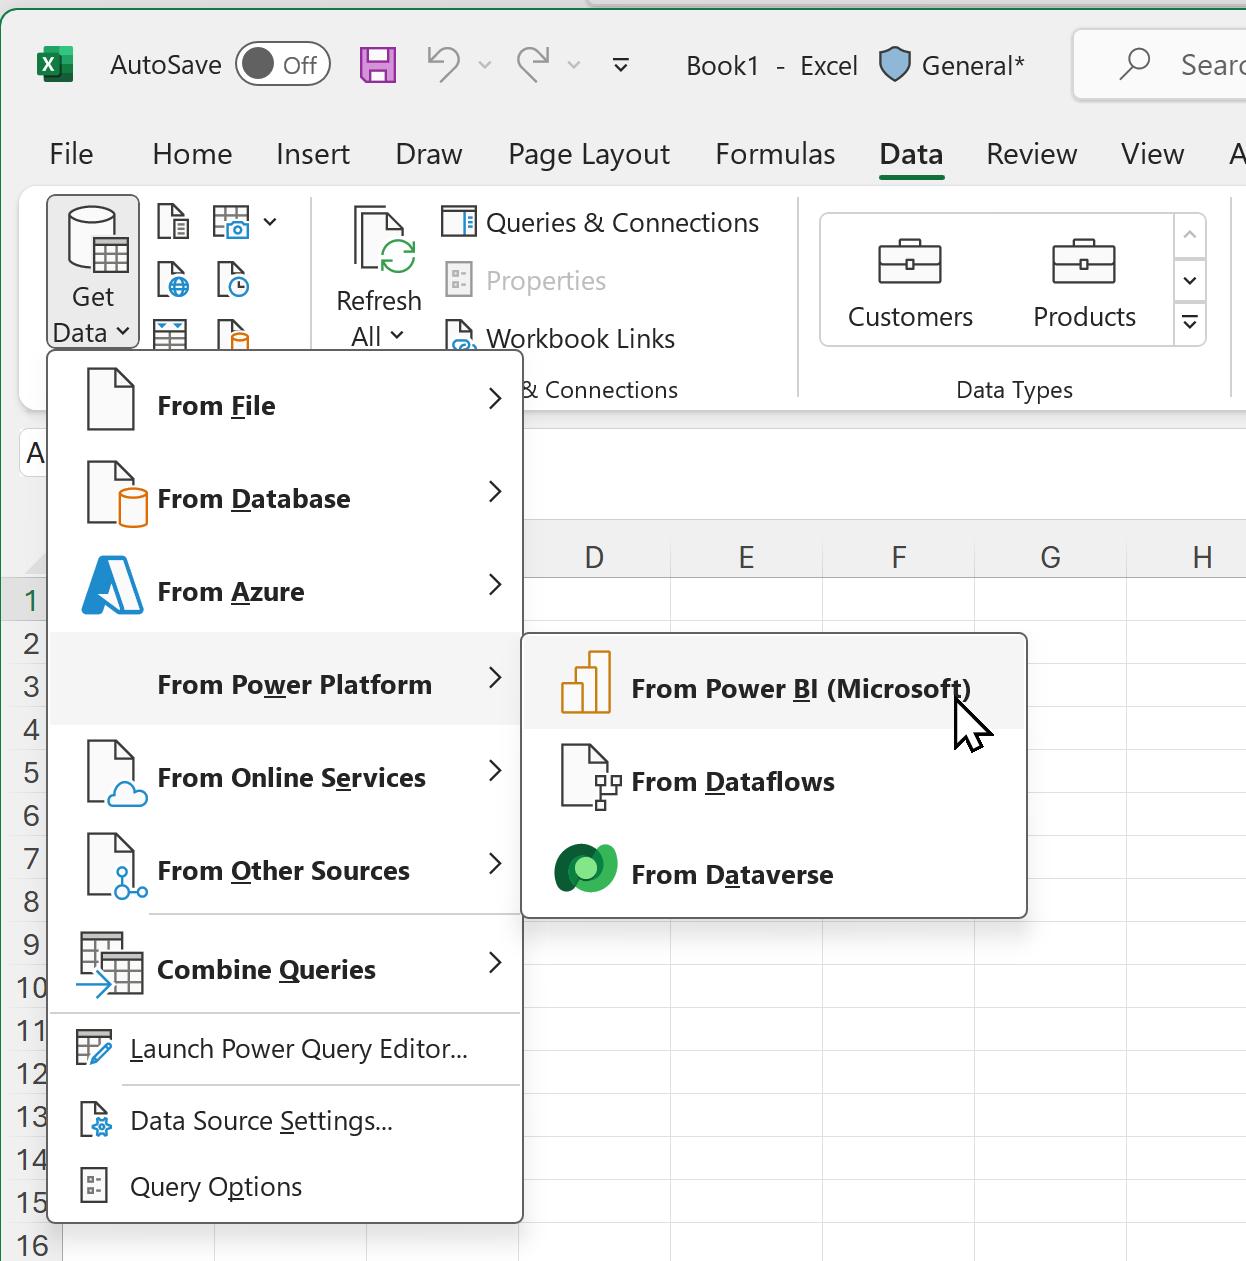
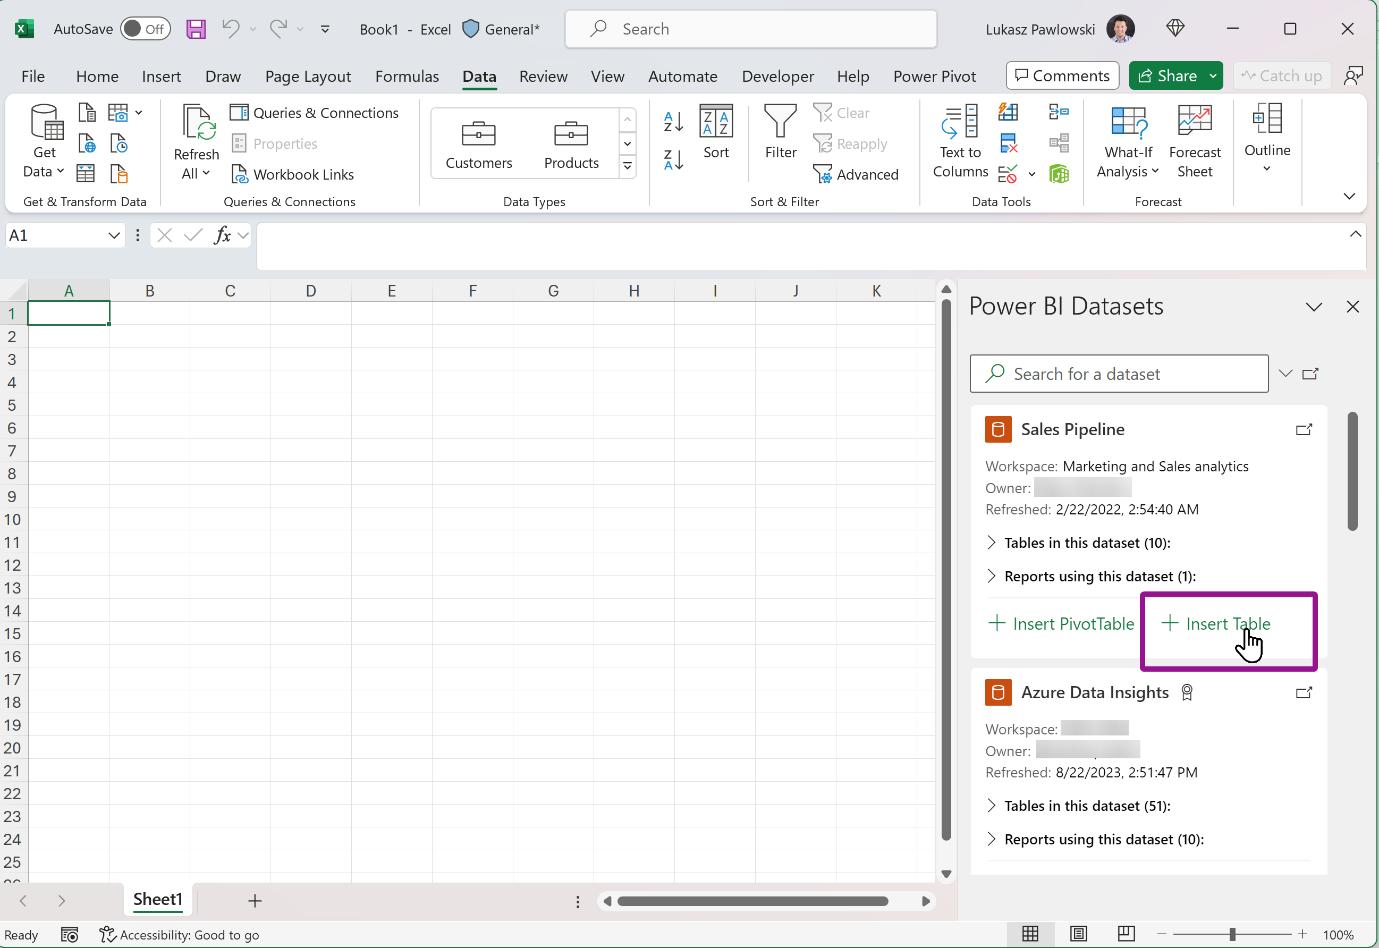
For each dataset, you’ll see the new ‘Insert Table’ option. This option is initially available in Excel for Windows.
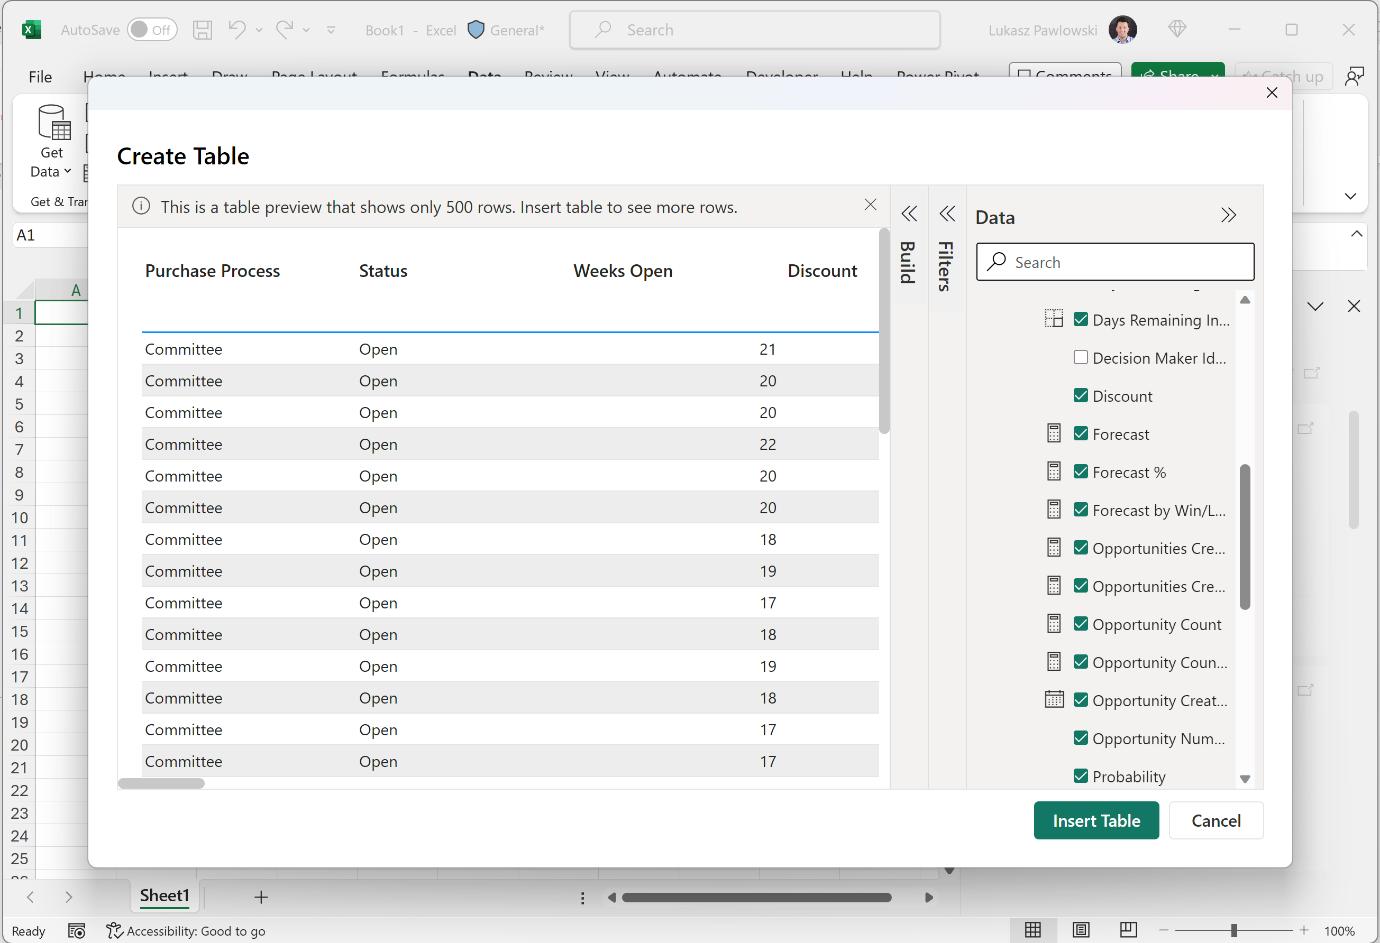
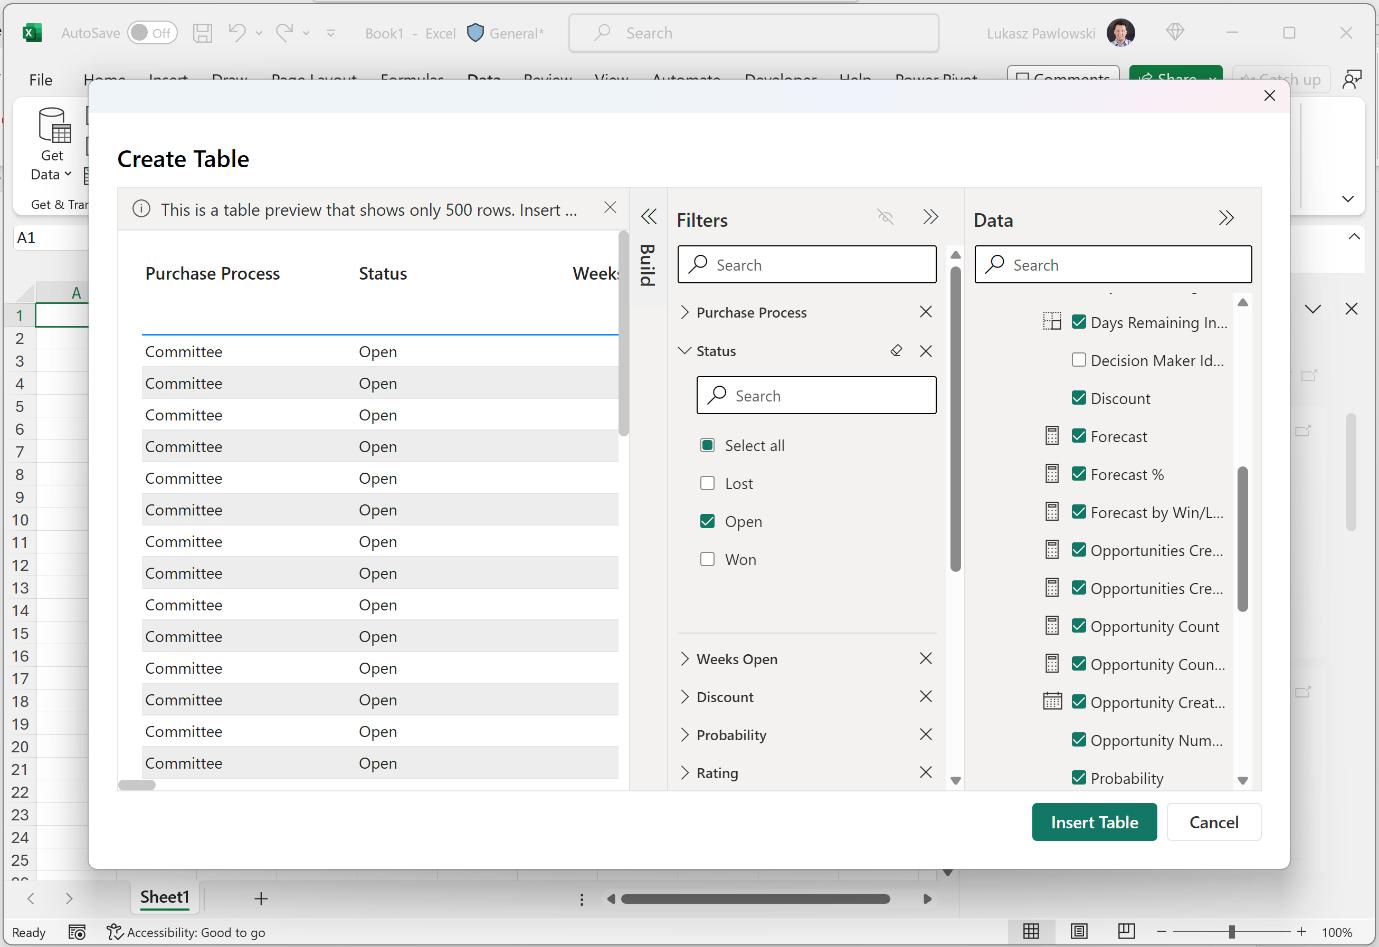
The new ‘Create Table’ dialog will open. You can use the Data pane to select the fields you want to add to your Excel workbook.
You may use the ‘Build’ pane to reorder, remove fields and change the aggregation for fields.
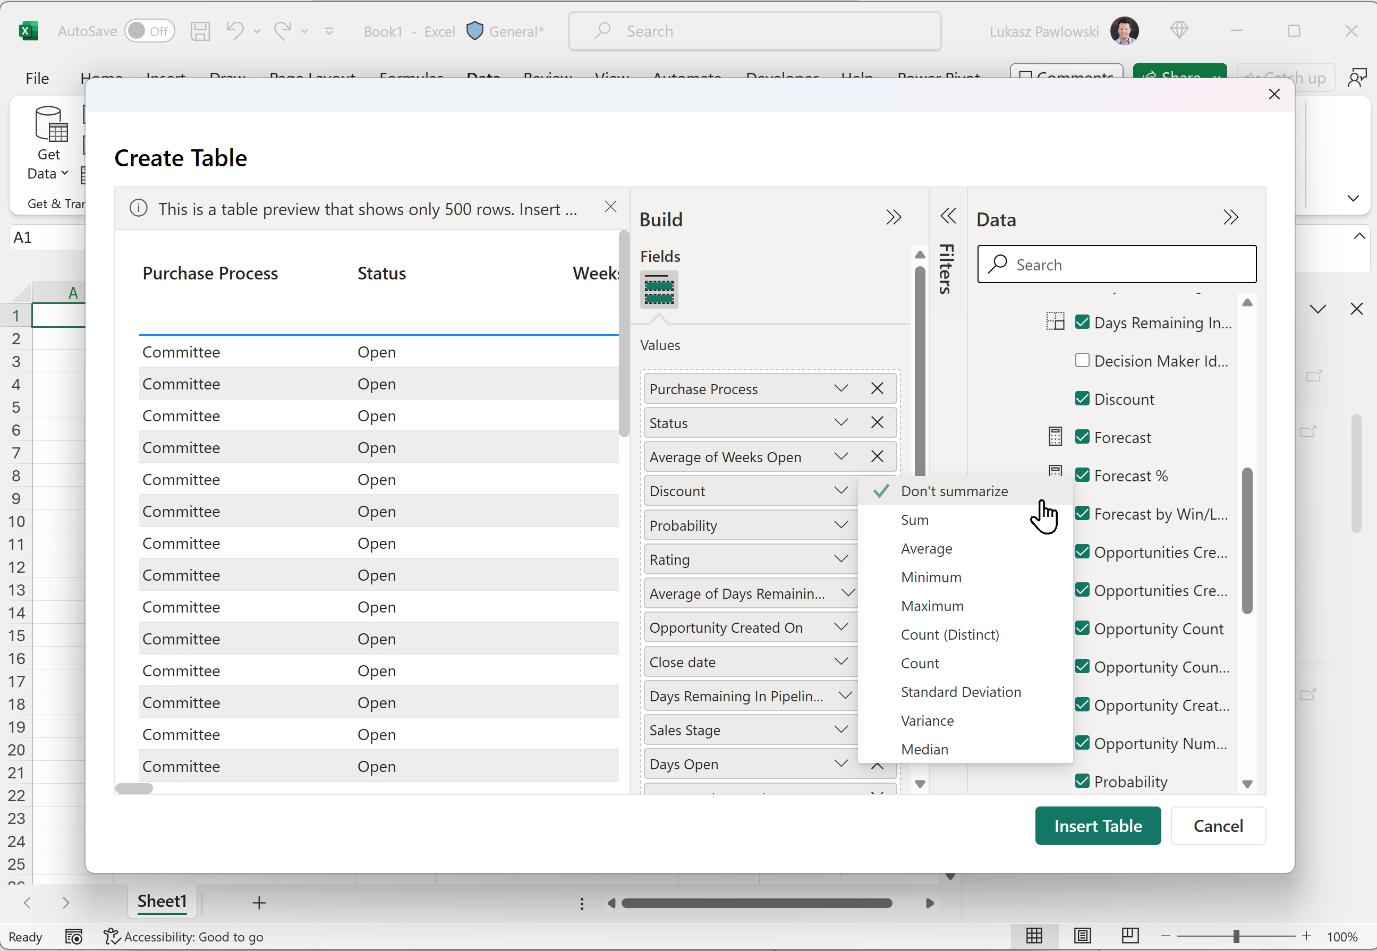
You may use the ‘Filters’ pane to do basic filtering for rows in your table.
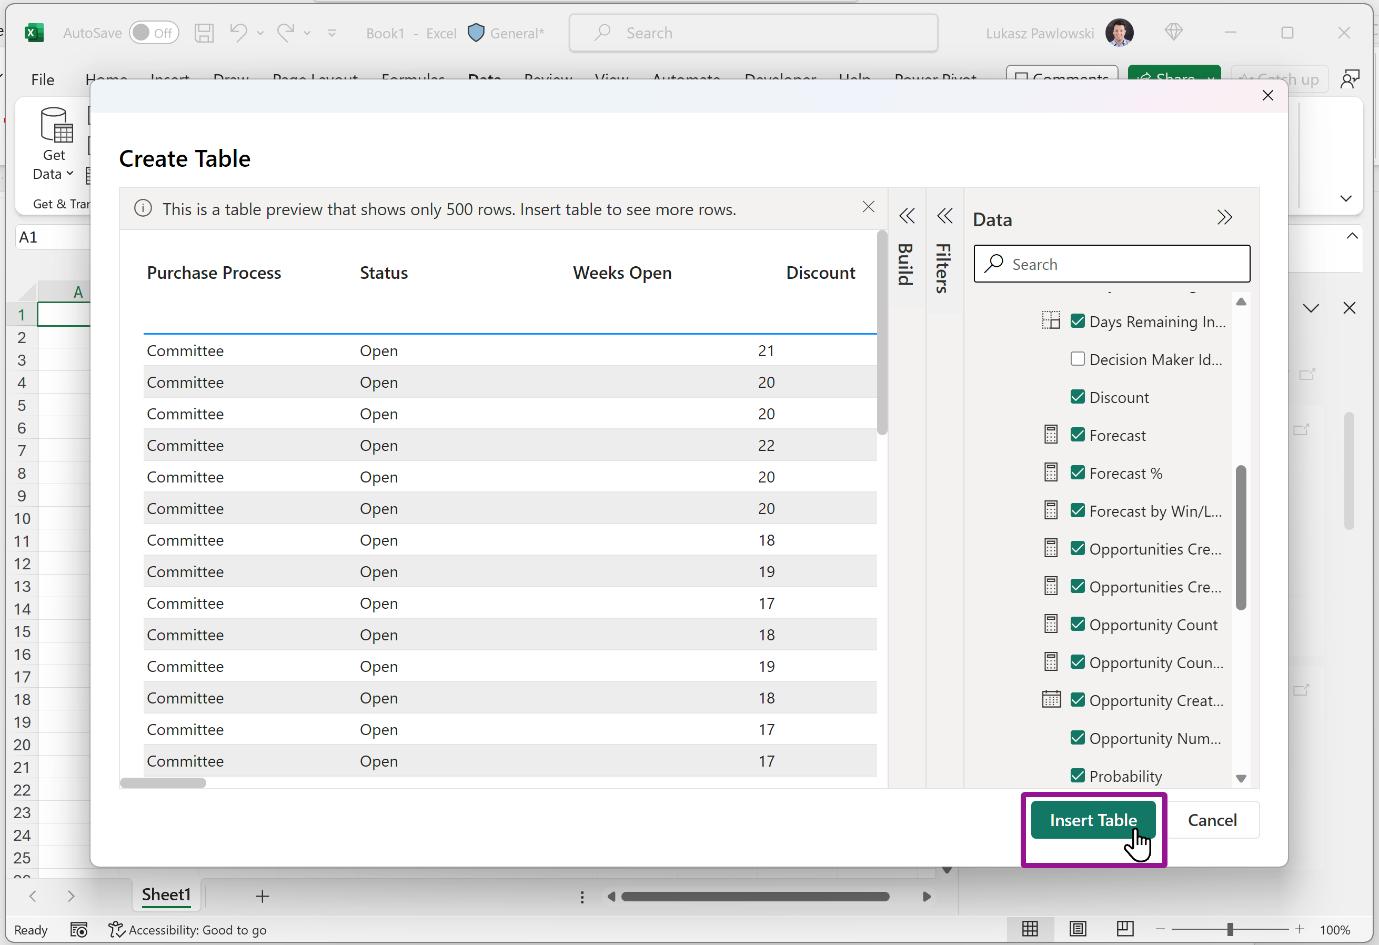
When you’re ready, press ‘Insert Table’ to add a Connected Table to your Excel sheet.
At this point, a Connected Table is inserted into your worksheet. You may refresh the data to get the latest data. Any data security like Row Level Security, Permissions and Sensitivity Labels will be enforced as well.
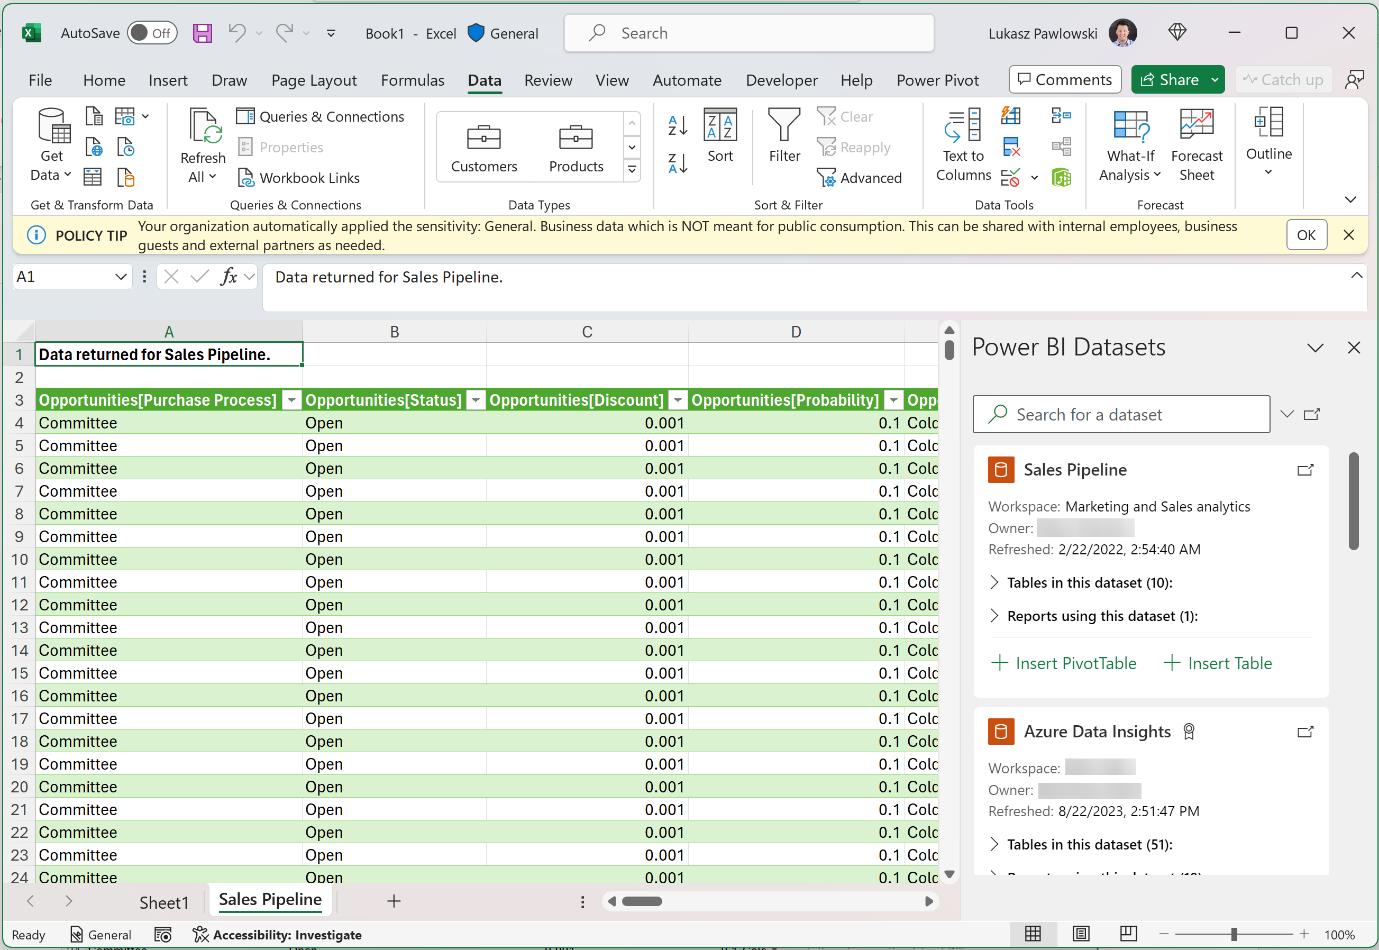
Just like with other Connected Table experiences, the workbook contains a Connection that you can review and modify through Data Ribbon -> Queries and Connections -> Queries and Connections pane -> Connections Tab -> right-click -> Properties. You may even change the query if you’d like using the ‘Command Text’ on the ‘Definition’ tab.
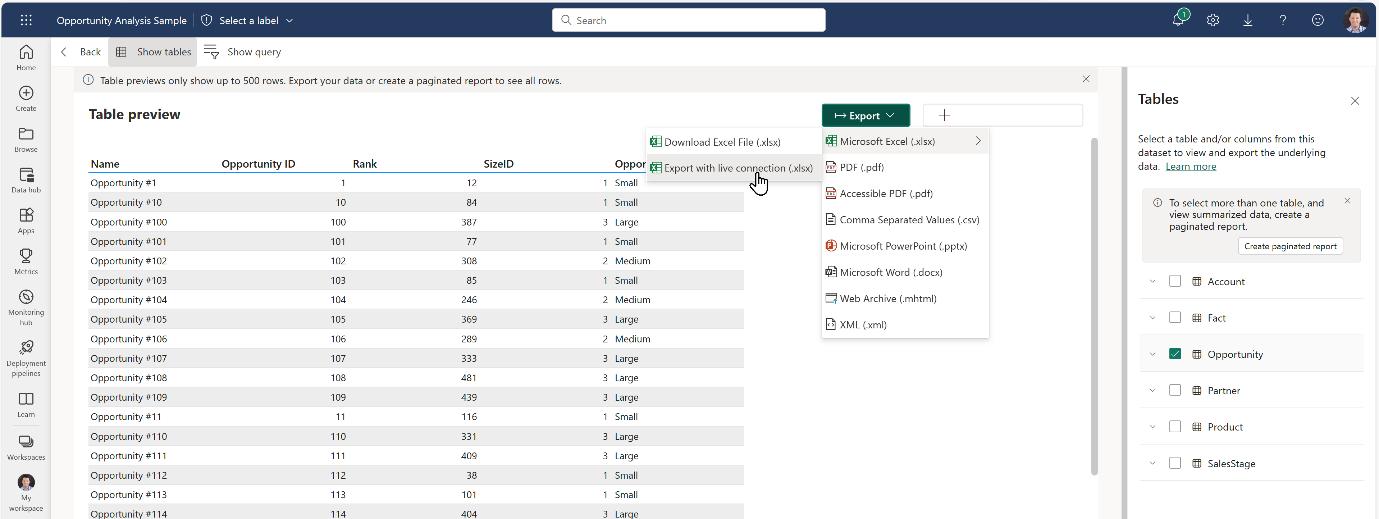
Microsoft is also starting to roll out a new ‘Export with live connection (.xlsx)’ option for the OneLake Data Hub experiences. When you navigate to a dataset in Power BI, you can use the Tables side pane to pick a table.
This will be added to the Export menu. This will create a connected Excel workbook that shows a Connected Table as above, or with the ‘Export to Excel’ capability when viewing an interactive report.
Whilst this is great for creating new queries, especially for those who don’t know how to write DAX, there are several limitations to be aware of:
- the ‘Insert Table’ option is rolling out to Excel for Windows users incrementally. It won’t be available immediately in Excel for the web
- the ‘Export with Live connection (.xlsx)’ option is rolling out for Power BI users in the Data Hub
- the column names in Excel can’t be changed. If you refresh, the query will reset the column names to the original ones
- you can’t edit the query in the user interface (UI). If you’d like to make changes, it’s best to just create a new query with the settings you want.
As stated above, if you don’t see these capabilities immediately, just give it some time since the roll-out will take several weeks to complete fully.
In the meantime, please remember we offer training in Power BI which you can find out more about here. If you wish to catch up on past articles, you can find all of our past Power BI blogs here.