
Power BI Blog: Introducing ISFILTERED
15 October 2020
Welcome back to this week’s edition of the Power BI blog series. This week, Jonathan Liau looks at the ISFILTERED function.
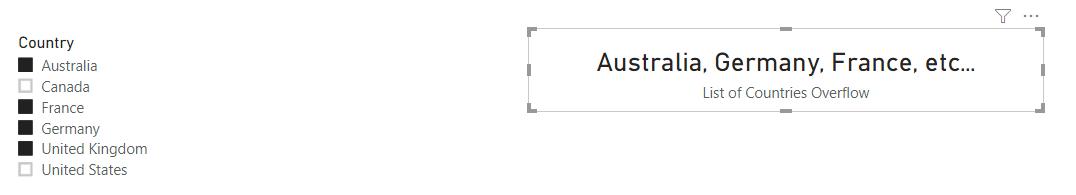
This week, we are going to pick up where we left off last week. As a recap, we created a measure that deals with overflow by limiting the total number of countries selected on a card and displays “etc…” at the end of the list.
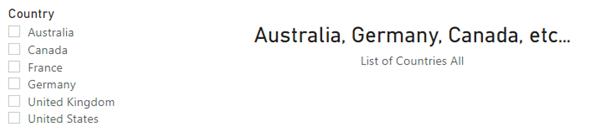
When there is no slicer selected, the card will still display a list of countries, which is a little odd:
Not exactly what we want, so cue the ISFILTERED function. The ISFILTERED function uses the following syntax to operate:
ISFILTERED(columnName)
It returns with a TRUE or FALSE value if the columnName parameter is currently filtered.
We are going to use ISFILTERED along with the IF function to modify the measure to return a different result when no selections have been made in the slicer.
For those who do not have photographic memory, as a recap, here is the original DAX code for the measure:
IF(
DISTINCTCOUNT(
Geography[Country]) <= 3,
CONCATENATEX(
Values(Geography[Country]),
Geography[Country],
", ",
[Total Sales],
DESC
),
CONCATENATE(
CONCATENATEX(
TOPN(
3,
Values(Geography[Country])
),
Geography[Country],
", ",
[Total Sales],
DESC
),
", etc..."
)
)
If you are unfamiliar with this measure, I suggest you go through it in detail in the previous blog.
We are going to add the following DAX code to the beginning of the measure:
IF(
ISFILTERED(Geography[Country]),
We will add the following code to the end of the measure:
,"All Selected"
)
After ‘wrapping’ the IF and ISFILTERED functions around the measure the measure will evaluate differently from before. If the code evaluates to TRUE, then it will display the countries selected, otherwise it will return with the “All Selected” string.
The complete measure will look like this:
List of Countries All =
IF(
ISFILTERED(Geography[Country]),
IF(
DISTINCTCOUNT(
Geography[Country]) <= 3,
CONCATENATEX(
Values(Geography[Country]),
Geography[Country],
", ",
[Total Sales],
DESC
),
CONCATENATE(
CONCATENATEX(
TOPN(
3,
Values(Geography[Country])
),
Geography[Country],
", ",
[Total Sales],
DESC
),
", etc..."
)
),
"All Selected"
)
Placing it in a card visualisation should give us a result that looks like this:
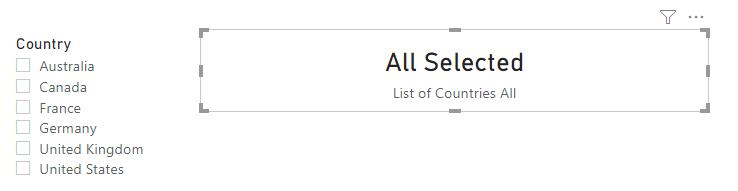
There we have it, a simple example on how to use the ISFILTERED function to improve our card visualisations.
That’s it for this week! Come back next week for more on Power BI!
In the meantime, please remember we offer training in Power BI which you can find out more about here. If you wish to catch up on past articles, you can find all of our past Power BI blogs here.