
Power BI Blog: Visual Calculations in Preview
28 March 2024
Welcome back to this week’s edition of the Power BI blog series. This week, we look at the new Preview feature in Power BI, visual calculations.
It may only be in Preview, but it is certainly worth mentioning. You can now add calculations directly onto your visual using visual calculations, which are DAX calculations that are defined and executed directly on a visual. A calculation can refer to any data in the visual, including columns, measures or other visual calculations. This approach removes the complexity of the semantic model and simplifies the process of writing DAX. You may use visual calculations to complete common business calculations such as running sums or moving averages. Visual calculations make it easy to create calculations that were previously very hard or even almost impossible to construct.
To use visual calculations while in Preview, you need to enable it in Options and Settings -> Options -> Preview features. Select visual calculations and click OK. Visual calculations will then be enabled after Power BI Desktop is restarted.
To add a visual calculation, you first need to select a visual. Then, select the ‘New calculation’ button in the Ribbon:
To add a visual calculation, type the expression in the Formula bar in the ‘Visual Calculations edit mode’ that opens. For example, in a visual that contains Sales Amount and Total Product Cost by Fiscal Year, you can add a visual calculation that calculates the profit for each year by simply typing:
Profit = [Sales Amount] – [Total Product Cost]
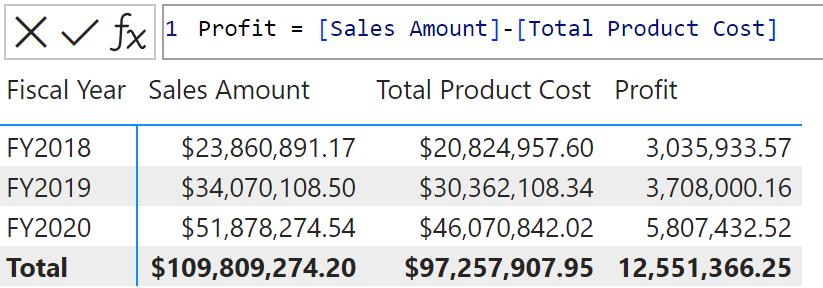
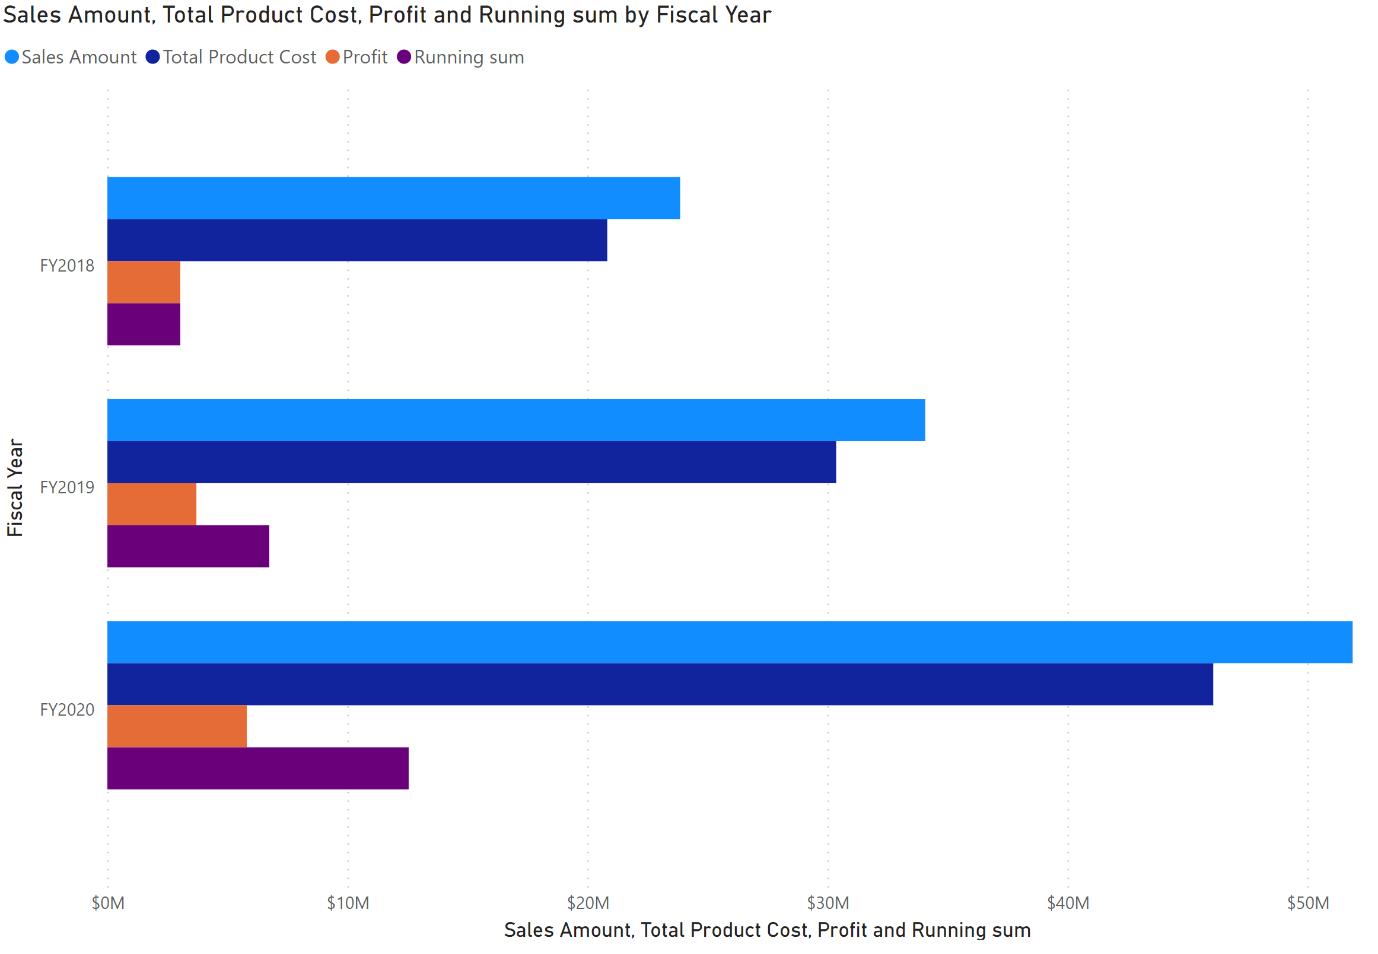
The visual matrix is updated as you add visual calculations in the Formula bar: new visual calculations are added as columns to the visual matrix. Additionally, you can easily add a running sum of profit by writing:
Running sum profit = RUNNINGSUM([Profit])
Here is a visual with the two visual calculations we have just created:
You can use many existing DAX functions in visual calculations. Functions specific to visual calculations are also available, such as RUNNINGSUM, PREVIOUS and MOVINGAVERAGE. Using these and other functions, visual calculations are much easier to read, write and maintain than the current DAX required. As author of the recent Financial Modelling in Power BI, I wholeheartedly agree!
Microsoft states that “[they] are only just getting started with this Preview”. We think the more you play with this, the more you will get. Watch this space.
In the meantime, please remember we offer training in Power BI which you can find out more about here. If you wish to catch up on past articles, you can find all of our past Power BI blogs here.