
Power Query: Project Population – Part 10
28 June 2023
Welcome to our Power Query blog. This week, I transform a new query from a public data source.
I have found some information on population growth provided by The World Bank, which I am using as an example of how to transform real-life data.
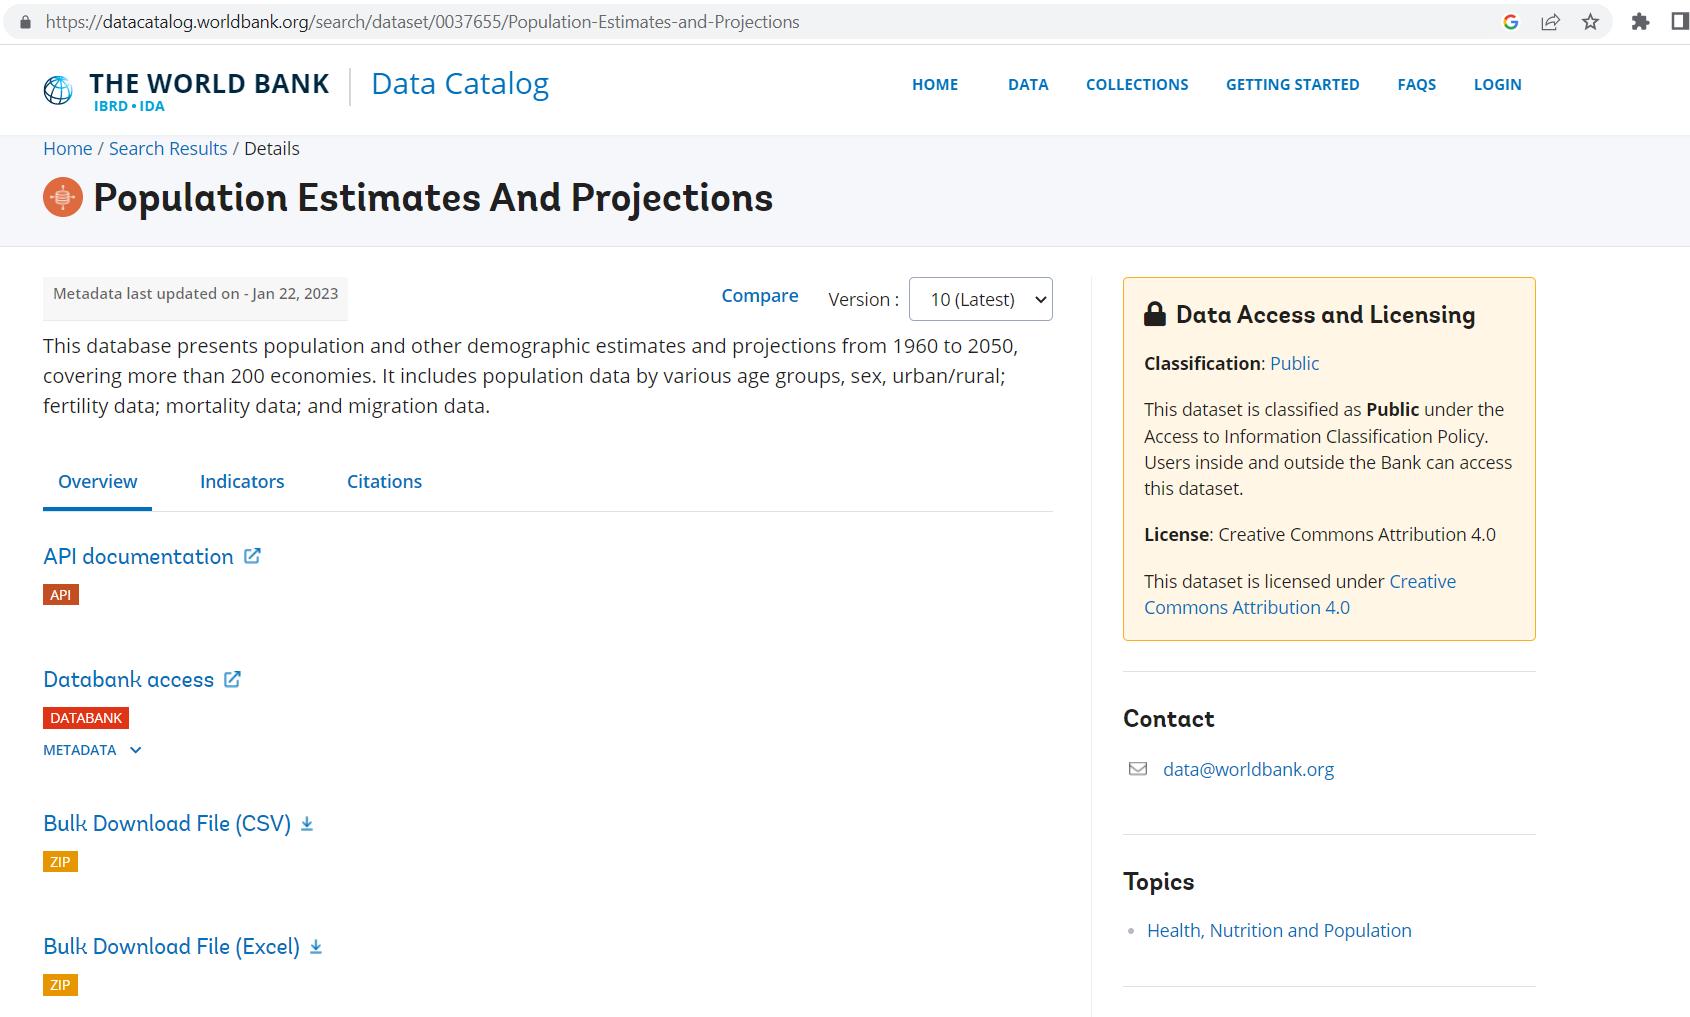
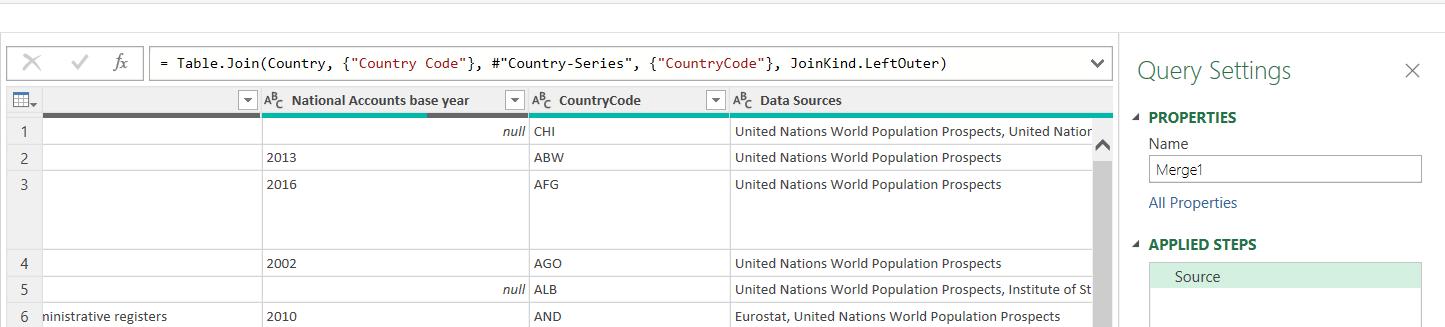
I have been transforming the data and last week, I improved the steps created automatically by Power Query when I used ‘Merge Queries’ to combine the data from Country and Country-Series.
This time, I will move on to the Data query and prepare this data.
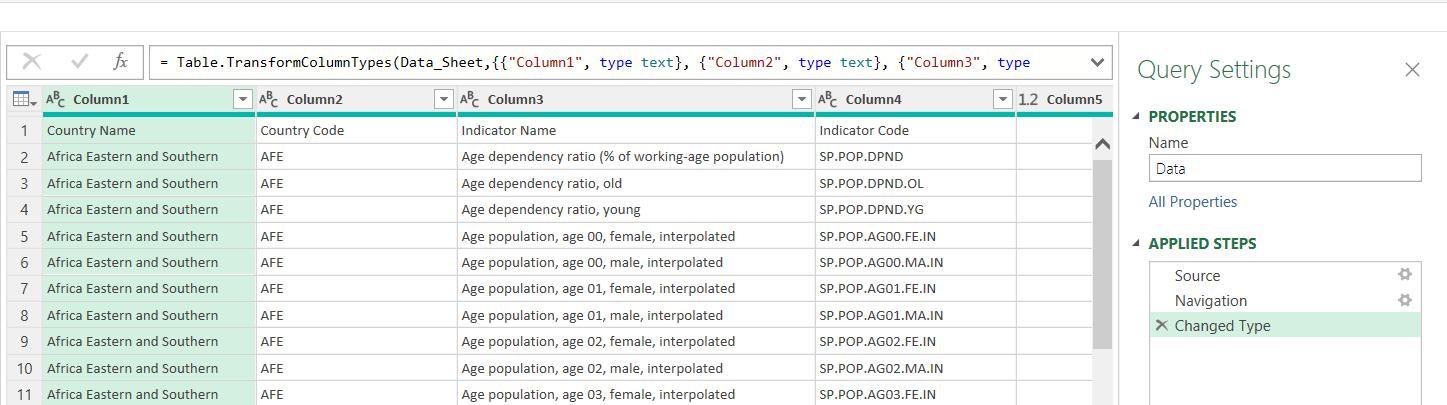
This query appears to contain information about the population of each country. I note that although I have a column with the heading ‘Country Code’ in the first row, when I look at the values underneath ‘Country Name’, I see that the first rows are for a region, not a single country.
I can look at the filter on Column1 to see what values are in this column:
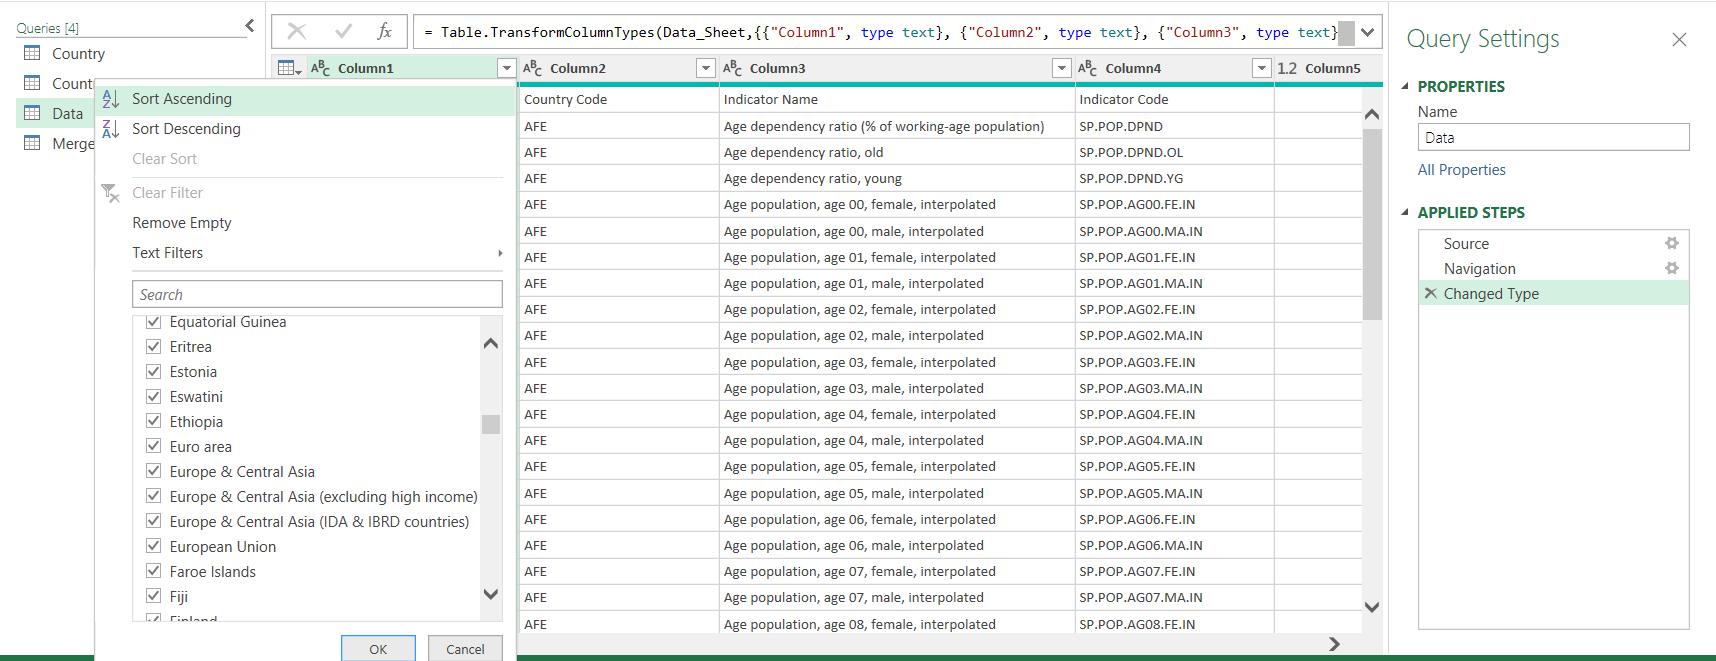
I have a mixture of data, some for individual countries and some for regions. When I come to merge this data, I will need to ensure I don’t ignore the rows in Data that do not match a country on Country.
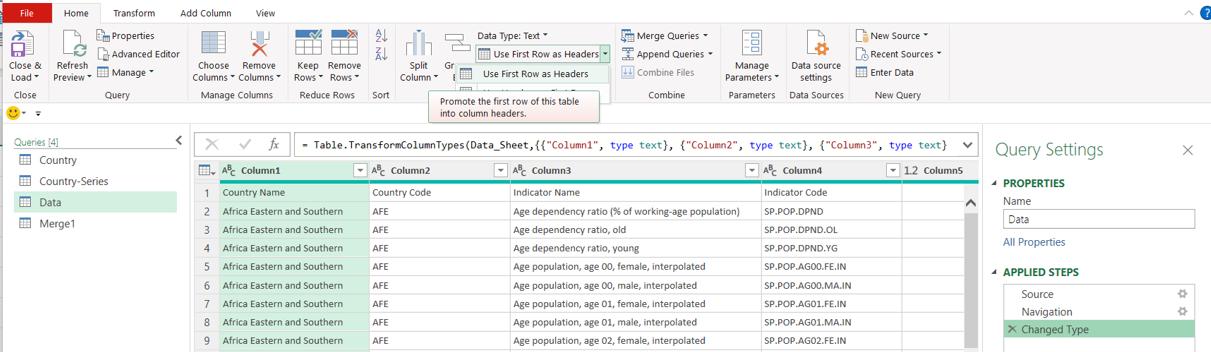
I start by cleaning up the Data query. I need to promote the first row to the headings, which I can do from the ‘Home’ tab:
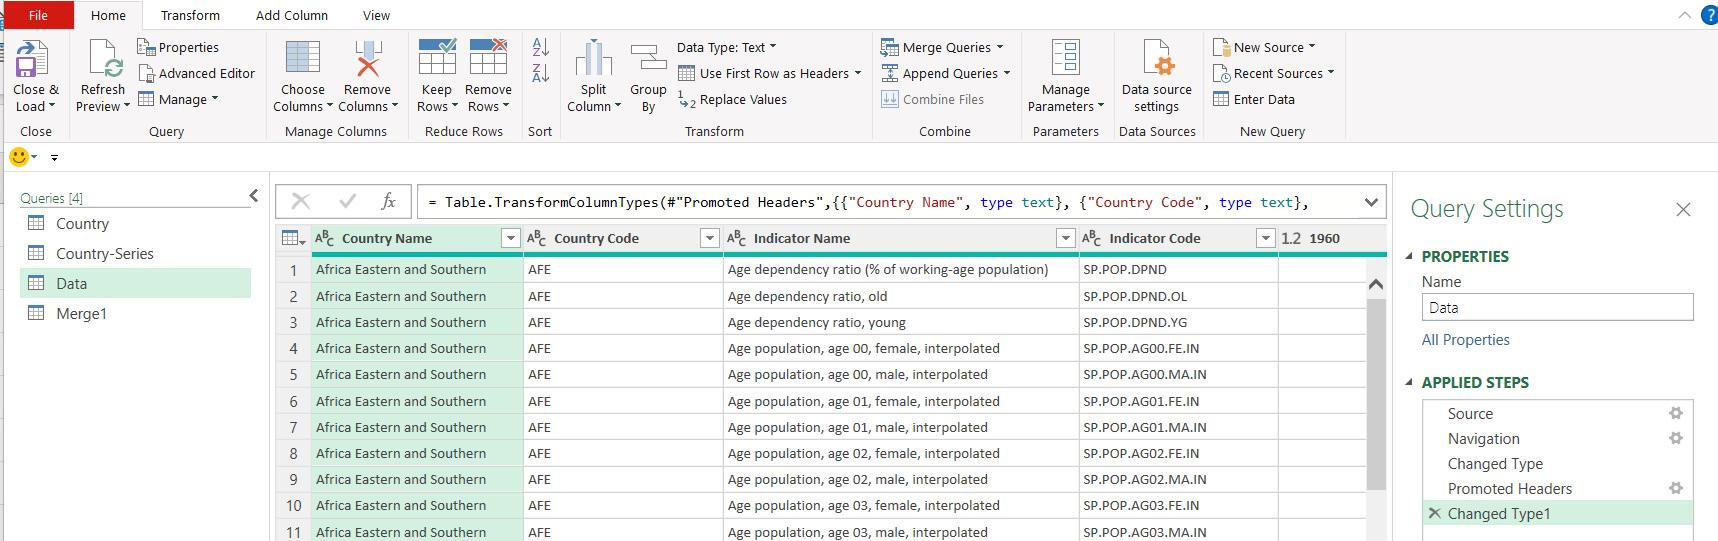
This also generates a ‘Changed Type1’ step for me:
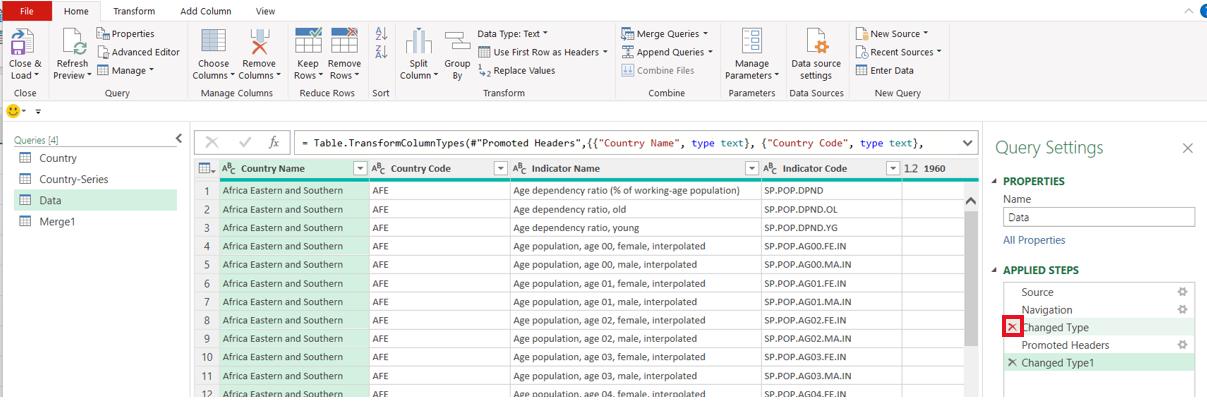
I don’t need the earlier ‘Changed Type’ step, so I can delete it using the cross icon next to it:
I am prompted to confirm this choice:
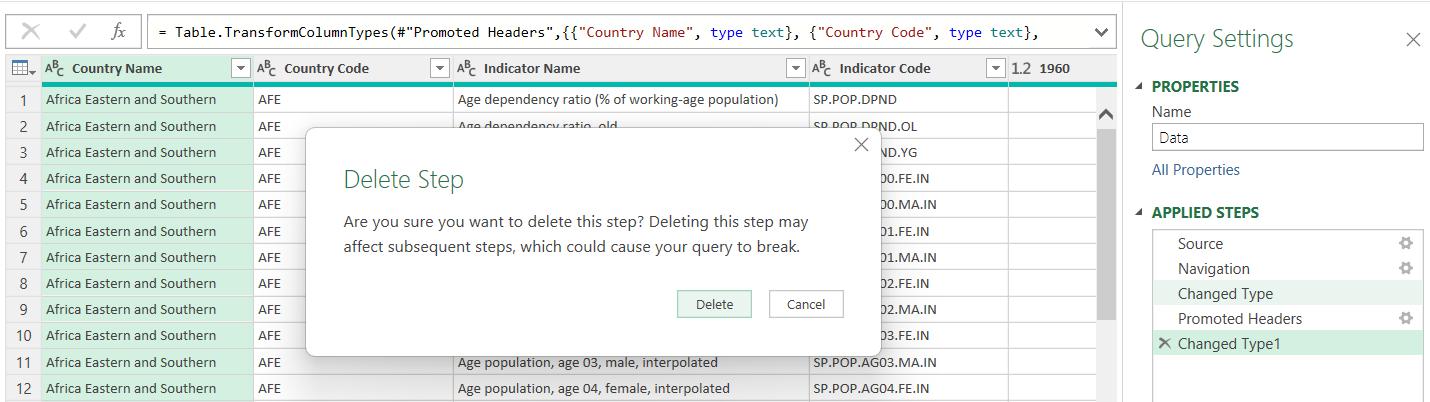
If this were a step that affected the name of a column, or if the subsequent steps relied on the data type being changed, then this could give me problems, but since I know that it will not affect the later steps I can go ahead. Power Query does not have an ‘undo’ option. Therefore, if I were uncertain about whether deleting a step would cause problems, I could make a copy of the query by right-clicking in the Queries pane and choosing to duplicate the query before proceeding.
Having deleted the step, a quick way to see all the columns without scrolling is to use the ‘Choose Columns’ feature on the Home tab:
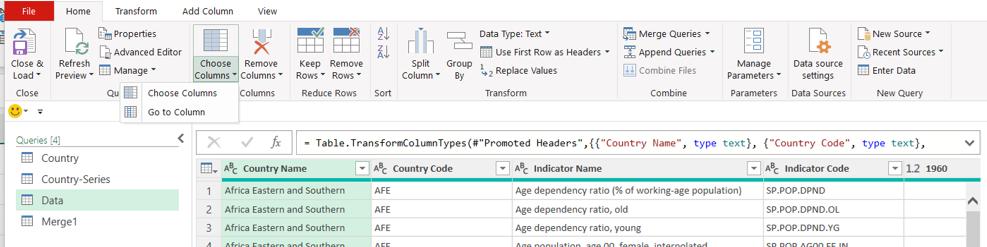
This allows me to see the complete list:
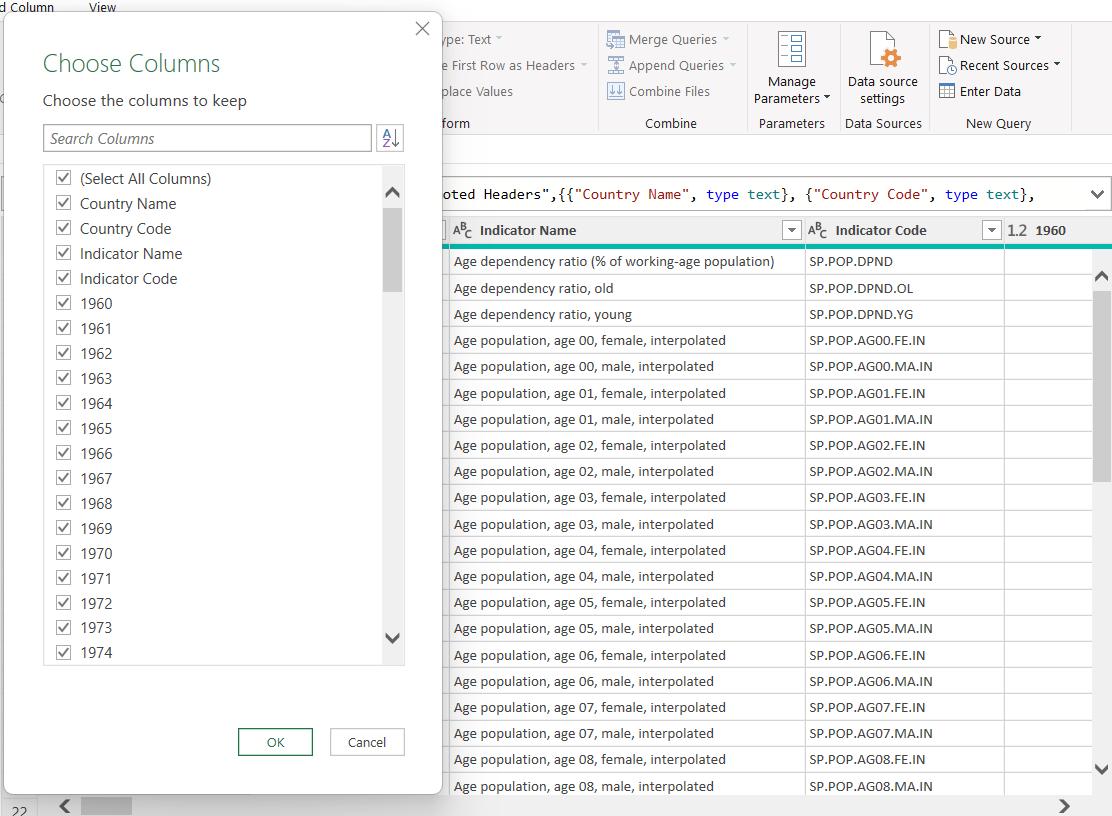
I have the Country Name, Country Code, IndicatorName, Indicator Code and then the years from 1960 projected to 2050. I will only uncheck the Indicator Code column, as it’s not giving me any useful information.
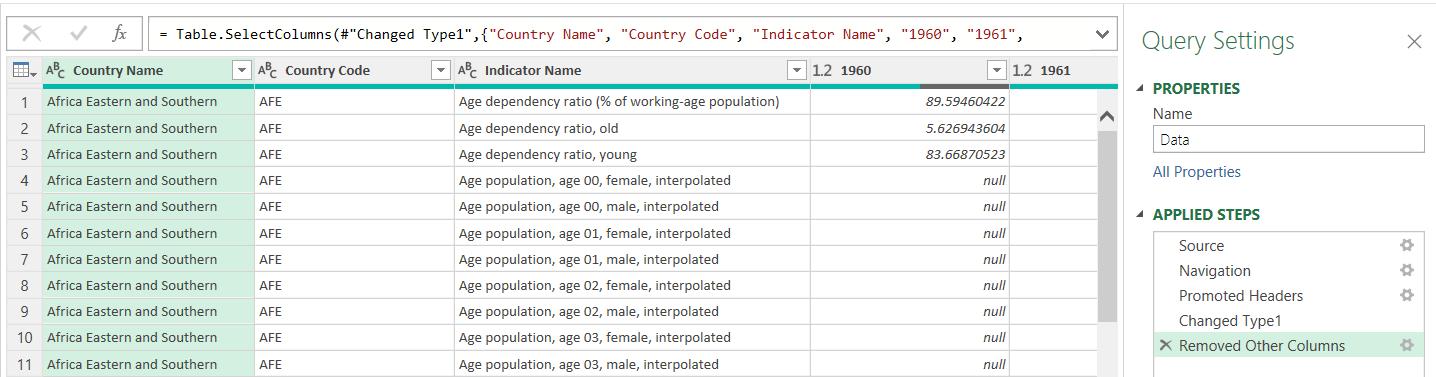
Note that the step created is ‘Removed Other Columns’ as it is safer to keep the columns I need, since if any columns are added to Data, my query will be unaffected.
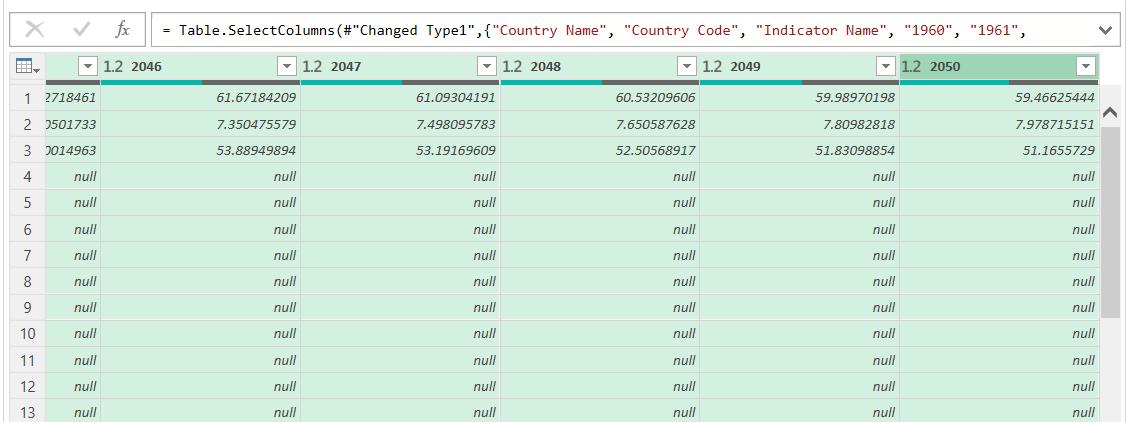
Looking at the data, I can see that there are some categories where all the year columns have null amounts:
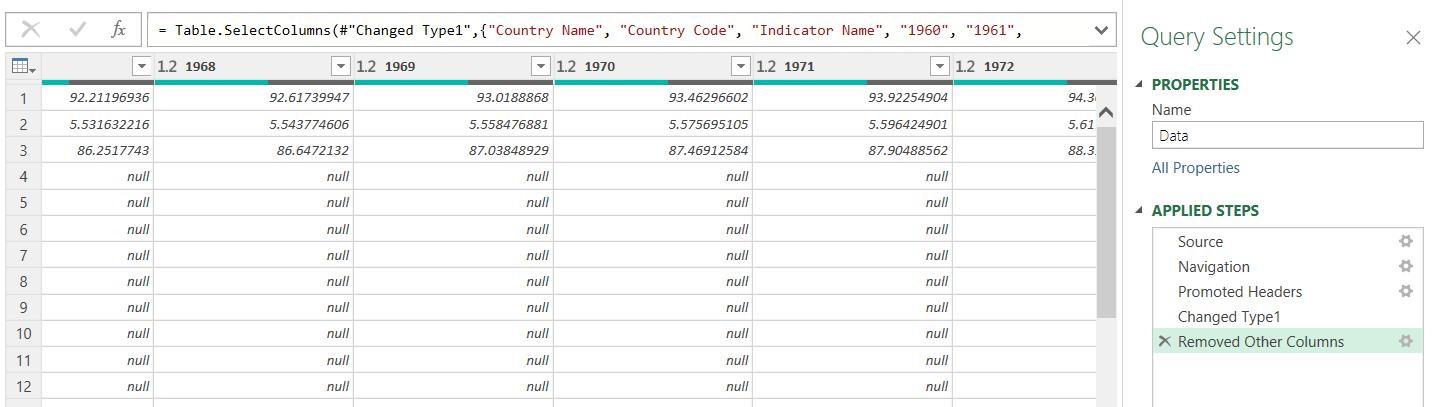
I can remove these rows. I start by selecting all the year columns. The easiest way to select all the years is to select 1960, scroll across to 2050, and then press SHIFT whilst I select column 2050, to select the complete range of years.
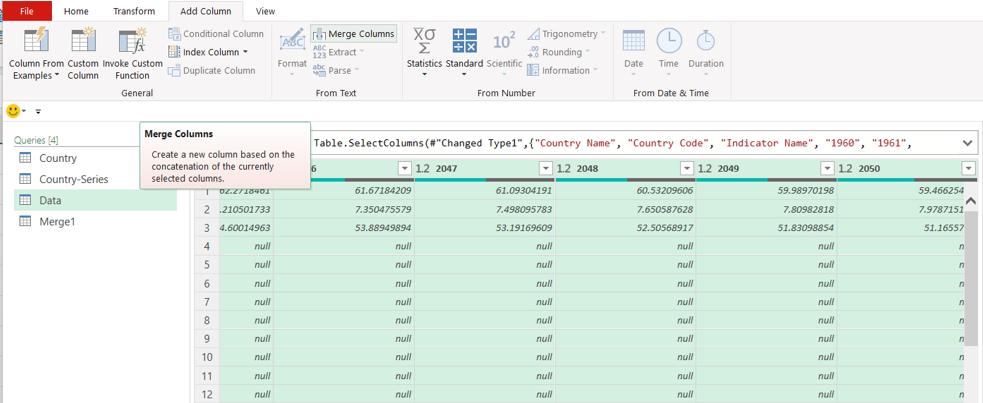
Next, I merge the columns from the ‘Add Column’ tab:
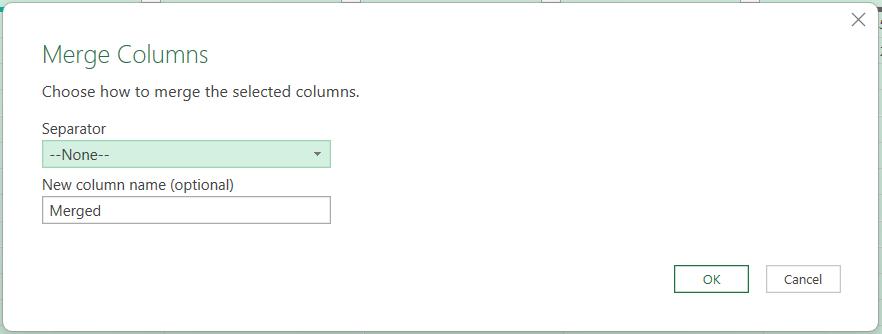
I can take the default settings in the dialog box, as I will be deleting this column soon.
This gives me one column, which I can filter:
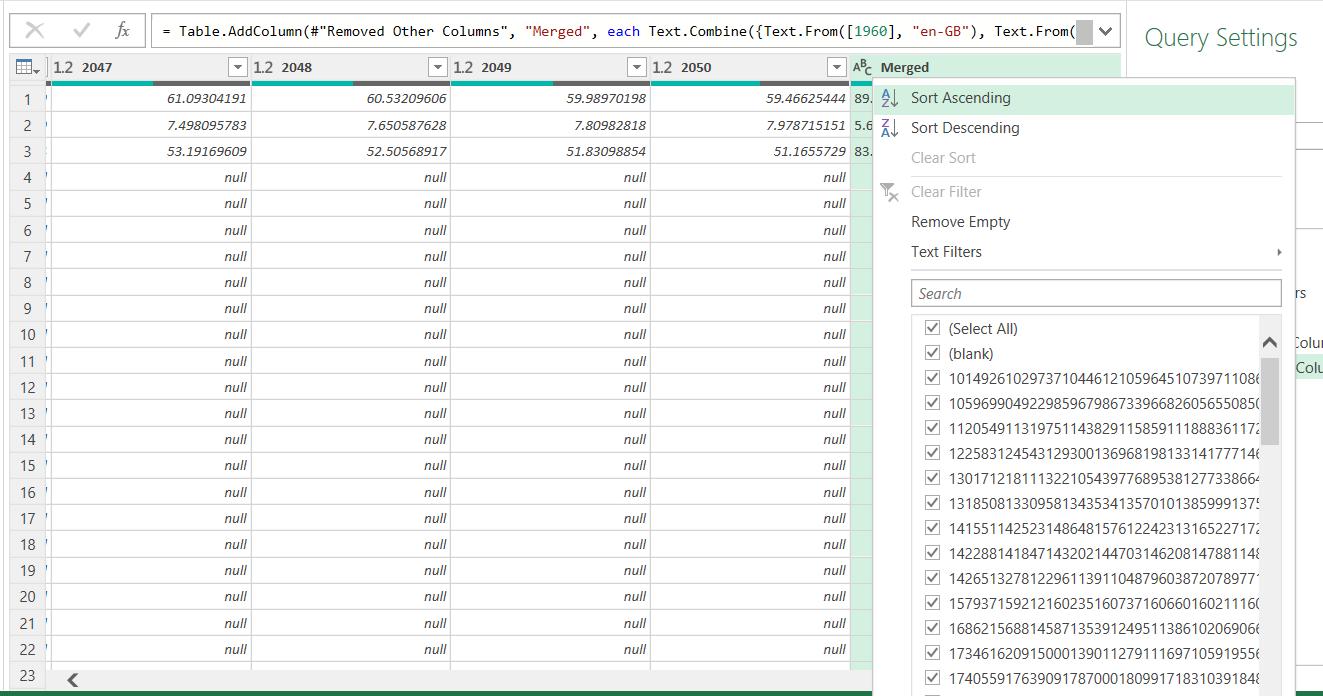
I choose to ‘Remove Empty’:
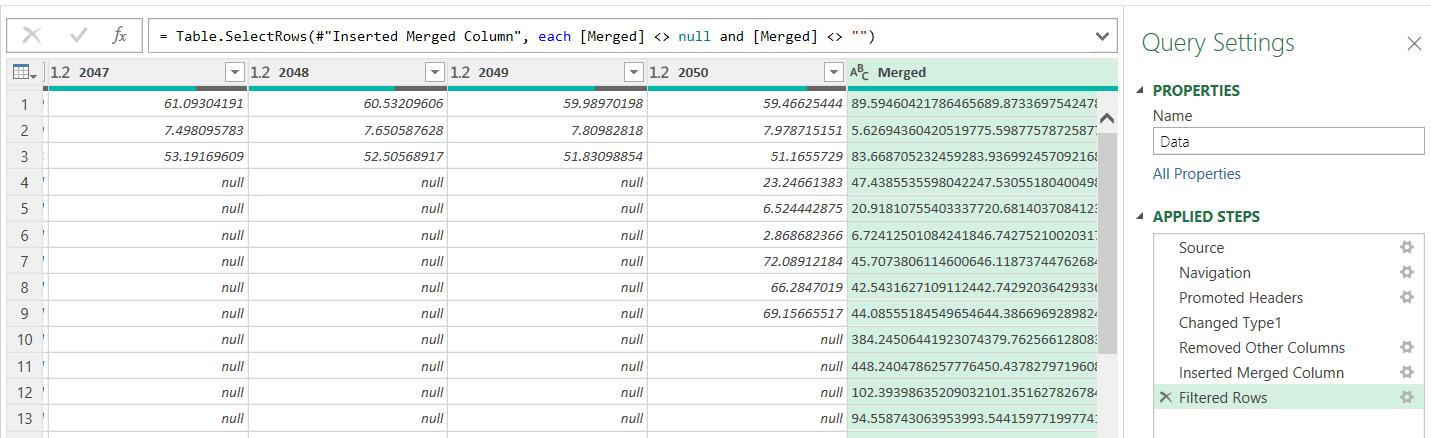
I can now delete the Merged column.

Next time, I will look at some ways to combine my Data and Country queries.
Come back next time for more ways to use Power Query!