
A to Z of Excel Functions: The MEDIAN Function
21 February 2022
Welcome back to our regular A to Z of Excel Functions blog. Today we look at the MEDIAN function.
The MEDIAN function
In statistics and probability theory, the median is the value separating the higher half from the lower half of a data sample, population or probability distribution. For a dataset, it may be thought of as "the middle" value. The basic feature of the median in describing data compared to the mean (often simply described as the "average") is that it is not skewed by a small proportion of extremely large or small values, and therefore provides a better representation of a "typical" value. Median income, for example, may be a better way to suggest what a "typical" income is, because income distribution can be very skewed. The median is of central importance in robust statistics, as it is the most resistant statistic, having a breakdown point of 50%: so long as no more than half the data are contaminated, the median is not an arbitrarily large or small result.
The MEDIAN function measures what is known as “central tendency”, which is the location of the centre of a group of numbers in a statistical distribution. There are three common measures of central tendency:
- Average: the arithmetic mean, calculated by adding a group of numbers and then dividing by the count of those numbers. For example, the average of 2, 3, 3, 5, 7, and 10 is 30 divided by 6, which is 5
- Median: the middle number of a group of numbers; that is, half the numbers have values that are greater than the median, and half the numbers have values that are less than the median. For example, the median of 2, 3, 3, 5, 7, and 10 is 4. If the number of values in the selection is an even number, the median is defined as the midpoint between the two central numbers
- Mode: the most frequently occurring number in a group of numbers. For example, the mode of 2, 3, 3, 5, 7, and 10 is 3.
For a symmetrical distribution of a group of numbers, these three measures of central tendency are all the same. For a skewed distribution of a group of numbers, they can be different.
The MEDIAN function employs the following syntax to operate:
MEDIAN(number1, [number2], ...)
The MEDIAN function has the following arguments:
- number1: this is required. The first number, cell reference, or range for which you want the median
- number2, …: this is optional. Additional numbers, cell references or ranges for which you want the median, up to a maximum of 255 in total.
It should be further noted that:
- if there is an even number of numbers in the set, then MEDIAN calculates the average of the two numbers in the middle
- arguments may either be numbers or names, ranges or cell references that contain numbers
- logical values and text representations of numbers that you type directly into the list of arguments are counted
- if a range or cell reference argument contains text, logical values, or empty cells, those values are ignored; however, cells with the value zero are included
- arguments that are error values or text that cannot be translated into numbers cause errors.
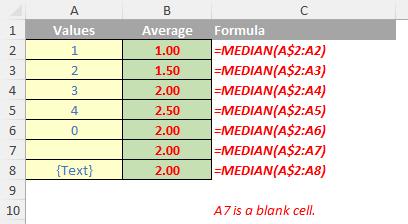
You should bear in mind that when you calculate the median of cell values, there is a difference between empty cells and those containing the value zero. If you have cleared the ‘Show a zero in cells that have a zero value’ check box in the Excel Options dialog box in Excel, you may not realise zeros are being included in calculating the average. To locate the ‘Show a zero in cells that have a zero value’ check box, go to File -> Options -> Advanced and look under ‘Display options for this worksheet’.
Please see my example below:
We’ll continue our A to Z of Excel Functions soon. Keep checking back – there’s a new blog post every business day.
A full page of the function articles can be found here.