
A to Z of Excel Functions: The PERCENTILE.INC Function
7 August 2023
Welcome back to our regular A to Z of Excel Functions blog. Today we look at the PERCENTILE.INC function.
The PERCENTILE.INC function
The nth percentile of a dataset is the value that cuts off the first n% of the data values when all of the values are sorted from least to greatest. For example, the 90th percentile of a dataset is the value that segregates the bottom 90% of the data values from the top 10% of data values.
There are three distinct functions you can use to calculate percentiles in Excel:
- PERCENTILE.EXC: this function returns the kth percentile of a dataset, excluding the values zero [0] and one [1]
- PERCENTILE.INC: this function returns the kth percentile of a dataset, including the values zero [0] and one [1]
- PERCENTILE: this function returns the kth percentile of a dataset as well. It will return the same value as the PERCENTILE.INC function.
In almost all cases, it is probably best to use the PERCENTILE.INC function because this function includes the values zero [0] and one [1] when calculating the percentiles and is the function that effectively “replaces” PERCENTILE.
No matter which of the three functions you use to calculate percentiles, the difference between the values calculated by PERCENTILE.EXC and PERCENTILE.INC will be similar in most cases. In some instances, it’s even possible that the two functions will return precisely the same values depending upon the numbers analysed.
The PERCENTILE.INC function is a statistical function that calculates the value at a given percentile in a dataset. It considers the range between zero [0] and one[1] including the extreme values. This function is particularly useful when analysing data distributions and understanding the relative position of a specific value within a dataset. For example, you can decide to examine candidates who score above the 90th percentile.
The PERCENTILE.INC function has the following syntax:
=PERCENTILE.INC(array, k)
It contains two arguments:
- array which is required and represents the array of values or range of data that defines relative standing
- k which is also required is a value 0 ≤ k ≤ 1 (0..1 inclusive), which represents the percentile (or kth percentage).
It should be noted that:
- if array is empty, PERCENTILE.INC returns the #NUM! error value
- if k is nonnumeric, PERCENTILE.INC returns the #VALUE! error value
- if k is < 0 or if k > 1, PERCENTILE.INC returns the #NUM! error value
- if k is not a multiple of 1/(n + 1) (where n is the number of values in the array), PERCENTILE.INC interpolates to determine the value at the kth percentile
- PERCENTILE.INC will interpolate when the value for the specified percentile lies
between two [2] values in the array. If
it cannot interpolate for the percentile, k specified, Excel will return #NUM!error
- the array argument ignores text,
logic, date and time values.
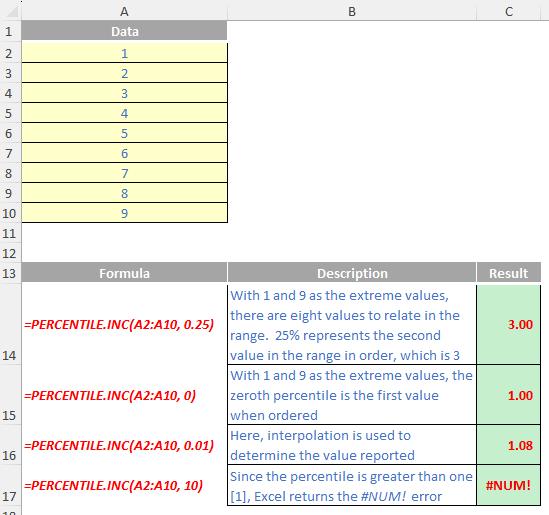
Please see my examples below:
We’ll continue our A to Z of Excel Functions soon. Keep checking back – there’s a new blog post every business day.
A full page of the function articles can be found here.