
A to Z of Excel Functions: The PY Function
8 April 2024
Welcome back to our regular A to Z of Excel Functions blog. Today we look at the PY function.
The PY function

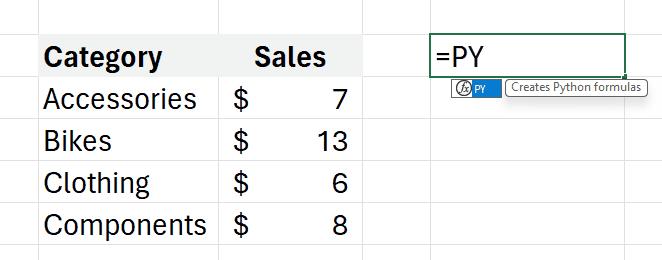
Python in Excel, a relatively recent innovation, makes it possible to natively combine the programming language Python and Excel analytics within the same workbook - with no setup required. You may type Python directly into a cell once you have entered
=PY
and the Python calculations run in the Microsoft Cloud. Your results are then returned to the worksheet, including plots and visualisations.

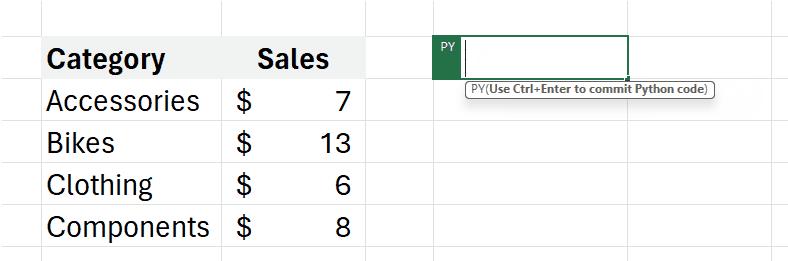
Every day, millions of users around the world rely on familiar Excel tools such as formulae, charts and PivotTables to analyse and understand their data. To get started, you simply type the PY function into Excel, which allows you to input Python code directly into Excel cells.

OK, so it’s not actually a python, but we like the picture…
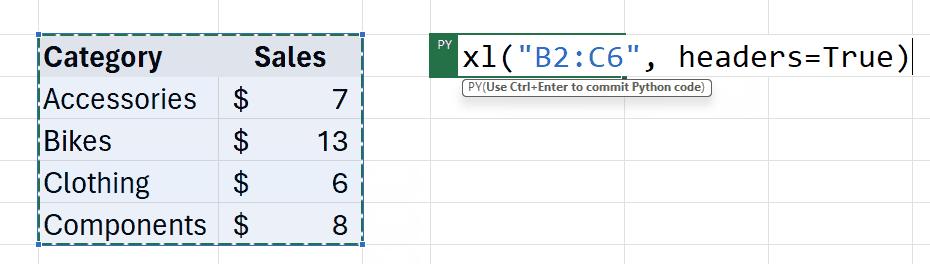
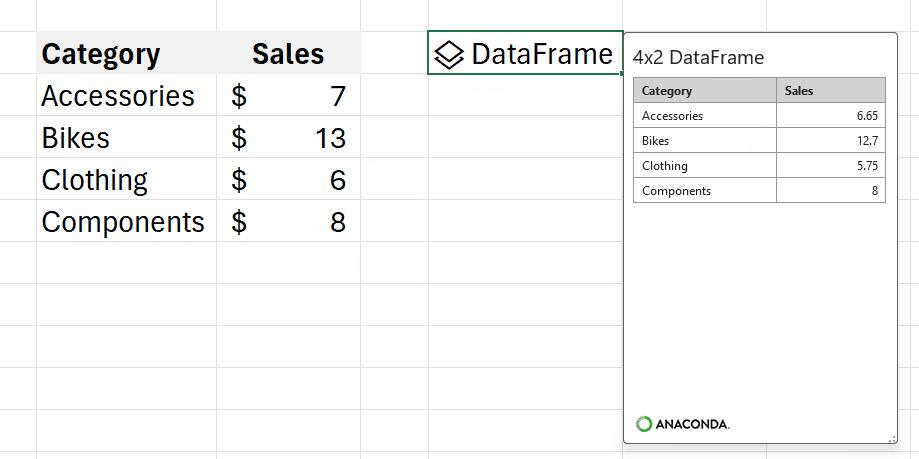
For example, to create DataFrames with just a few simple clicks, it’s no more difficult than typing the following:
With PY, you now have access to powerful analytics via Python for visualisations, cleaning data, machine learning, predictive analytics, and more. You can create end to end solutions that seamlessly combine Excel and Python all within Excel. Using Excel’s built-in connectors and Power Query, users can easily bring external data into Python in Excel workflows. Python in Excel is compatible with the tools users know well, such as formulae, PivotTables and Excel charts.
An example of an advanced visualisation, for instance, might be the following. You can tap into the potential of well-known Python charting libraries like Matplotlib and seaborn to create a wide variety of charts, spanning from conventional bar graphs and line plots to specialised visualisations such as heatmaps, violin plots and swarm plots.

There is more though. You can consider the impact of machine learning, predictive analytics and forecasting. For example, you may leverage the capabilities of Python libraries like scikit-learn and statsmodels to apply popular machine learning, predictive analytics, and forecasting techniques such as regression analysis, time series modelling, etc. You might even throw in a LAMBDA along the way!

You can consider data cleansing too. You may make efficient use of advanced data cleaning techniques such as locating missing values, standardising formats, removing duplicates and employing techniques like regular expressions for pattern-based transformations.


Python code used by Excel runs on the Microsoft Cloud with enterprise-level security as a compliant Microsoft 365 connected experience. The Python code runs in its own hypervisor isolated container using Azure Container Instances and secure, source-built packages from Anaconda through a secure software supply chain. Python in Excel keeps your data private by preventing the Python code from knowing who you are, and opening workbooks from the internet in further isolation within their own separate containers. Data from your workbooks can only be sent via the built-in xl() Python function, and the output of the Python code can only be returned as the result of the =PY() Excel function.
We’ll continue our A to Z of Excel Functions soon. Keep checking back – there’s a new blog post every business day.
A full page of the function articles can be found here.