
A to Z of Excel Functions: The RRI Function
17 February 2025
Welcome back to our regular A to Z of Excel Functions blog. Today we look at the RRI function.
The RRI function

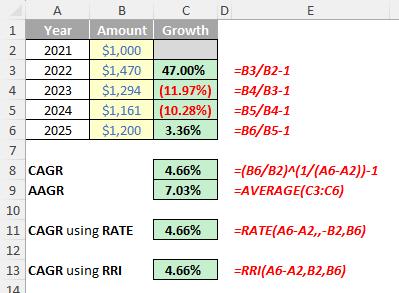
Sometimes, you seek to invest and work out what your return will be. If it’s just for one period, it’s simple. If you invested $1,000 and received $1,200 a period later, then your return would be 20% for the period as $1,000 x (1 + 20%) = $1,200.
But what if it’s more than one period? Assuming no withdrawals from your investment, the rate will compound over time, i.e. you will receive interest on your interest. Thus, if you received $1,200 for an investment of $1,000 made two periods previously, it would be wrong to calculate this as 10% (being 20% divided by two [2]). This is because
$1,000 x (1 + 10%) x (1 + 10%) = $1,000 x (1 + 10%)2 = $1,100 x (1 + 10%) = $1,210.
The additional $10 emanates from calculating 10% of the first period’s interest ($100) in the second period. This will only exacerbate when multiple periods are considered. Instead, the correct formula is:
($1,200 / $1,000)½- 1 = 9.54% (approx.)
To check this:
$1,000 x (1 + 9.54%) x (1 + 9.54%) = $1,000 x (1 + 9.54%)2 = $1,095.4 x (1 + 9.54%) = $1,200.
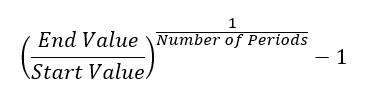
Extrapolating this formula, we get the compound periodic growth rate is
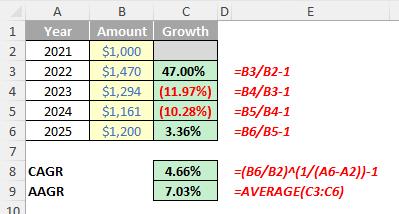
If each period is a year, this is often known as the Compound Annual Growth Rate (CAGR). This should not be confused with the Average Annual Growth Rate (AAGR) which calculates annual growth rates yearly and then simply averages this number, which may be useful for shorter investment periods when you want greater clarity (rather than accuracy) for growth each year, e.g.
The CAGR could be calculated by using the RATE function:
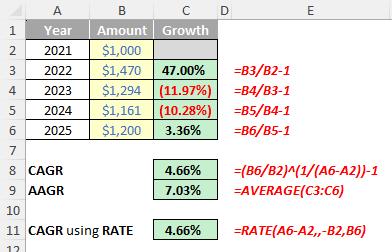
Here, A6-A2 calculates the number of periods, the second argument is not specified (i.e. zero [0]) as there are no additional payments or withdrawals, the third argument (B2) is the investment (this must be negative) and the final argument (B6) is the future value at the end.
It’s a bit complicated, which is where the RRI function comes in. This returns the equivalent interest rate for the growth of an investment.
It has the following syntax:
RRI(nper, pv, fv)
The RRI function has the following three [3] arguments, all required:
- nper: this argument represents the number of periods for the investment
- pv: this is the present value of the investment
- fv: this is the future value of the investment.
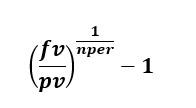
RRI returns the interest rate given nper (the number of periods), pv (present value) and fv (future value), calculated by using the following equation explained above:
It should be noted that:
- if argument values are not valid, RRI returns the #NUM! error value
- if arguments are not using valid data types, RRI returns the #VALUE! error value
- pv should not be negated (unlike RATE).
Thus, we can calculate the CAGR simply in our example above:
Be careful calculating interest / investment rates. As a model auditor for over 30 years, you start to recognise and look out for common errors in financial spreadsheets. One common area of malignant modelling is the inability of many analysts to convert an annual interest rate into a monthly or quarterly rate correctly. Sometimes the error is immaterial; other times, it can cause major issues (e.g. for bank forecasts). This isn’t so much an Excel issue as a mathematical problem, but it is still relevant to financial modellers and more often than not, it’s calculated incorrectly.
The key thing any modeller charged with this exercise must do is read the debt term sheet or deposit account prospectus to see what the effective annual rate is. Accountants talk about nominal interest rates and such like, but the effective annual rate is the amount of interest expressed as a percentage of the opening debt or cash balance if interest were to be paid and calculated as per the terms of the underlying document.
It’s easier said than done.
Let me demonstrate with an example: consider a loan of $100 where interest is calculated in arrears on a monthly compounding basis paid quarterly at the end of each quarter. The effective rate is determined to be 12%. The question is, what is the appropriate monthly rate be for cashflow calculations?
Who said 1%? That’s a common answer, derived as 12% divided by the number of months in a year (12). It sounds good, but if I crunch the numbers, I will get the following result:
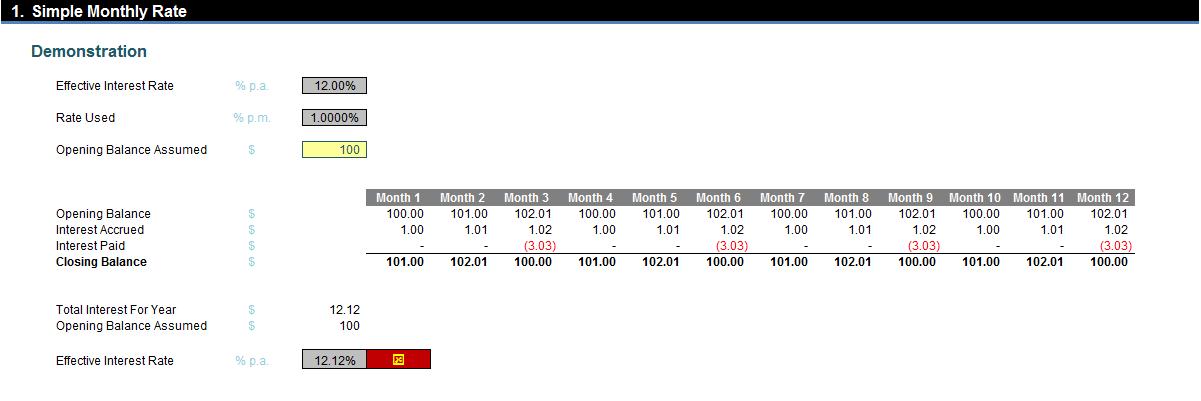
On a $100 balance with interest of 1% monthly paid quarterly, the total interest for the year will be $12.12 – that’s an effective annual rate of 12.12% rather than 12% (12.00%). This is not correct, as interest is being rolled up at the end of each of the first two months in the quarter and is attracting further interest, i.e.interest is compounding and has not been taken into account by simply dividing the annual rate by the number of months in a year.
So, what about using the compounding formula instead? Interest can then be calculated as
=(1+12%)1/12 - 1
This equates to 0.9489% per month. This will consider compounding – well, sort of:
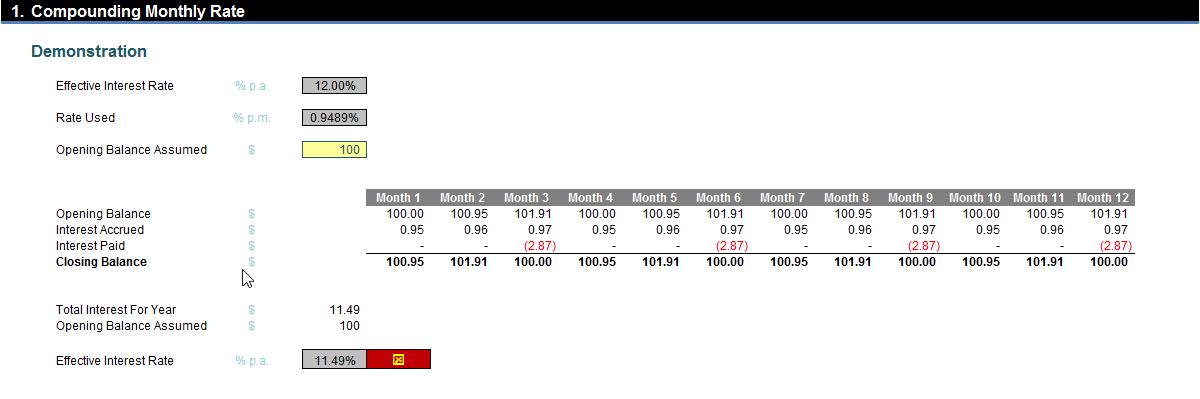
This hasn’t worked either: interest has been under-accrued (that’s a good word I’ve just made up) as only $11.49 has been computed for the year – an effective rate of 11.49%.
Here, the calculation is again too simplistic as it does not consider that the interest is paid quarterly. This means that compounding throughout the year does not occur, hence the shortfall of 0.51%.
The correct formula is:
=(1+(Effective Annual Interest Rate x Payment Frequency / Months in Year))1/Payment Frequency - 1
If payments are made once every three months, then there are four payments (equal to Months in Year / Payment Frequency or 12 / 3) each year. At these points, compounding stops. Therefore, the interest rate of 12% per annum is effectively 3% per quarter. The compounding formula can then be applied to the quarterly rate to get the monthly rate accordingly:
=(1+3%)1/3 - 1
This equates to 0.9902%. This is correct, viz.
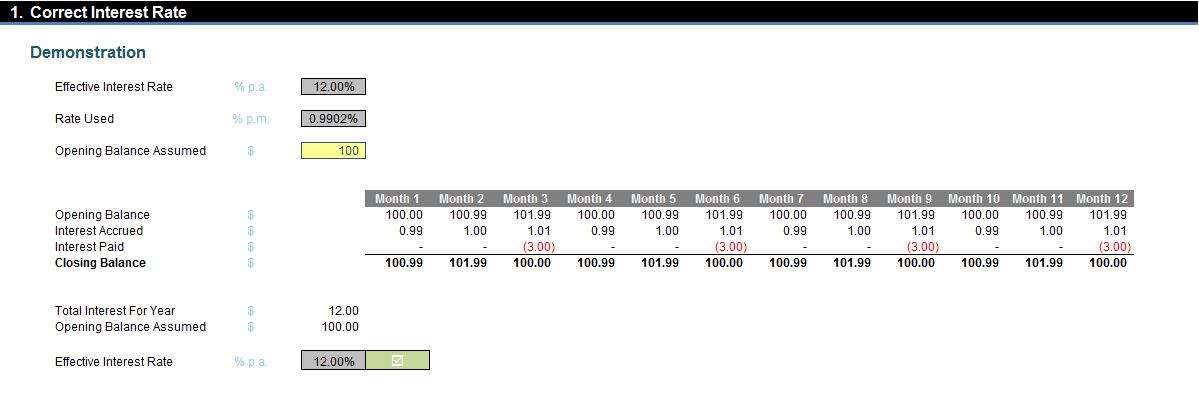
Success!
This is the formula that should be applied to calculate the appropriate monthly interest rate from a quoted effective annual one.
Word to the Wise
For the record, it should be noted that if interest is paid monthly, the formula above reduces to the simple interest rate method (i.e. simply divide the rate by 12). Similarly, if interest is only paid at the end of the year, the compounding formula is correct too. Essentially, the formula explained above is the “halfway house” between the two.
We’ll continue our A to Z of Excel Functions soon. Keep checking back – there’s a new blog post every other business day.