
Charts and Dashboards: Dynamic Charts – Part 2
10 July 2020
Welcome back to this week’s Charts and Dashboards blog series. This week, we will continue to talk about creating Dynamic Tables using the OFFSET function.
To recap, Dynamic Tables are used to make sure that whenever a data range is updated or modified, the report associated with it will be changed accordingly. We may either use the OFFSET function or Tables to create Dynamic Tables in Excel. This week, we’ll look at OFFSET.
Using the OFFSET function
To begin, I select the data and give it a name in the Name Box, viz.
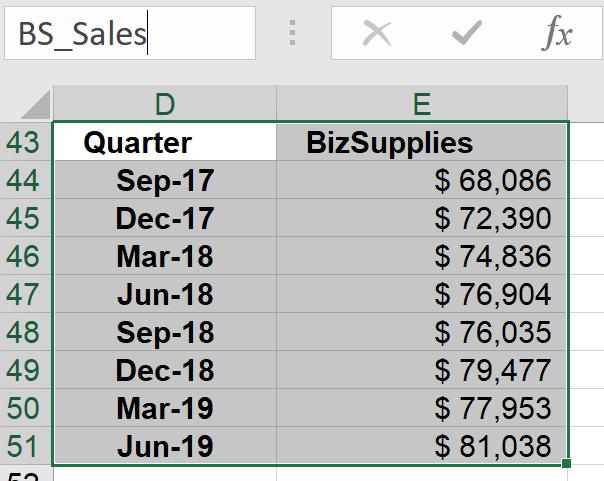
Now, whenever I refer to the dataset BS_Sales, it will point to the range D43:E51 which contains the BizSupplies quarterly sales. If another row is added to the data, it will still point to the same range, as this range is static. However, I may use the OFFSET function to make this range dynamic.
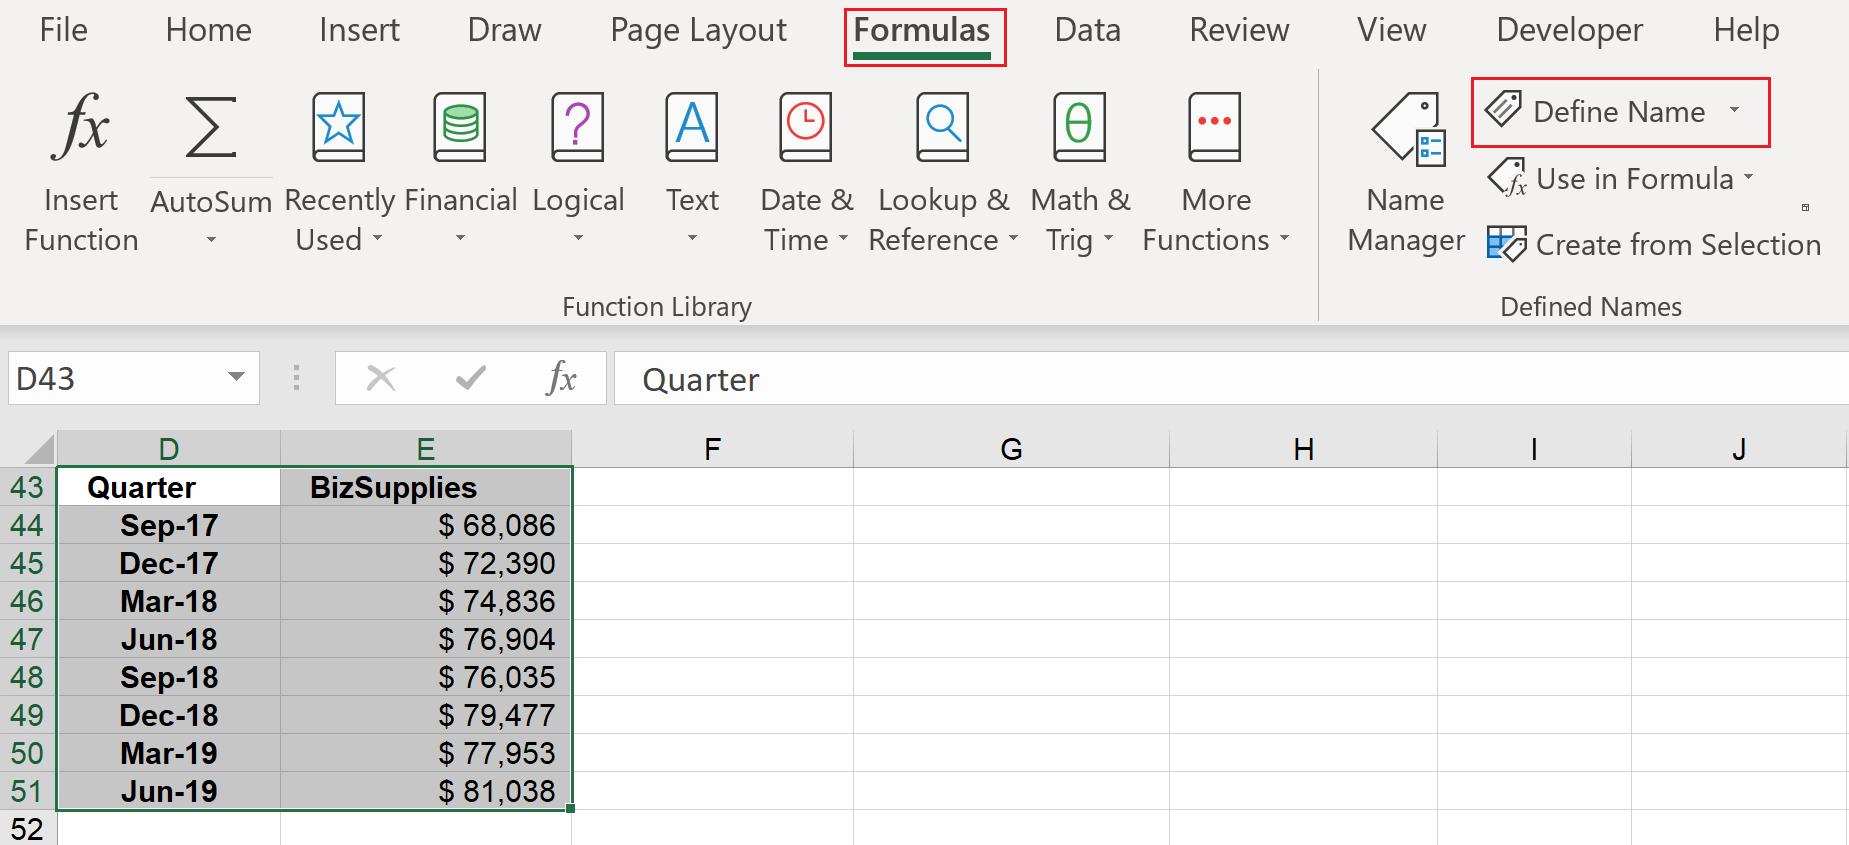
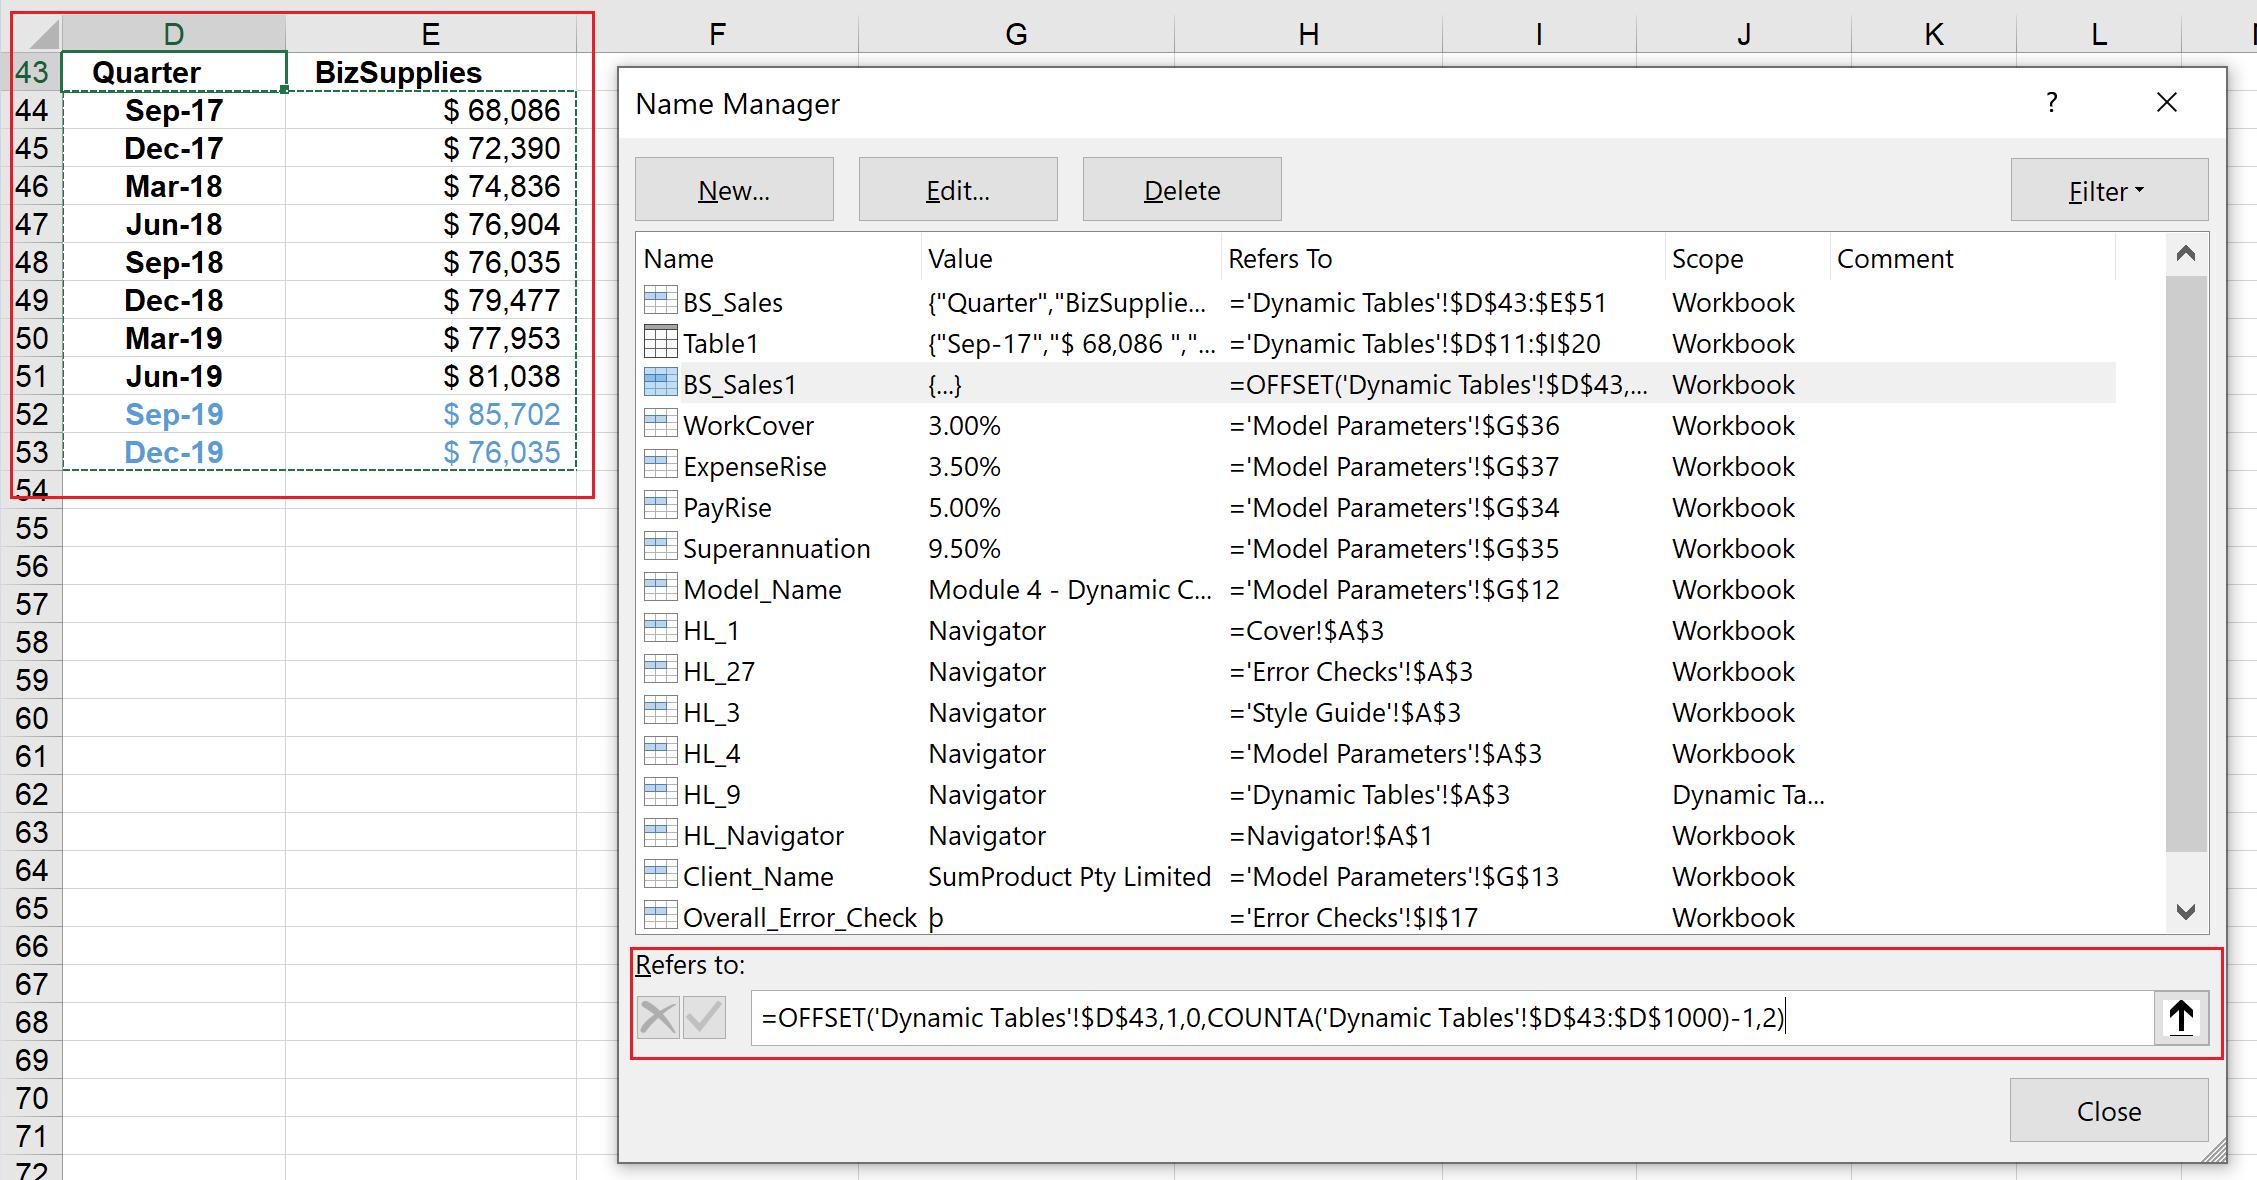
To do this, I select the range D43:E51 and navigate to the Formulas tab on the Ribbon, where I then ‘Define Name’…
The ‘New Name’ dialog will appear. I type the OFFSET formula into the ‘Refers to’ box as shown below:
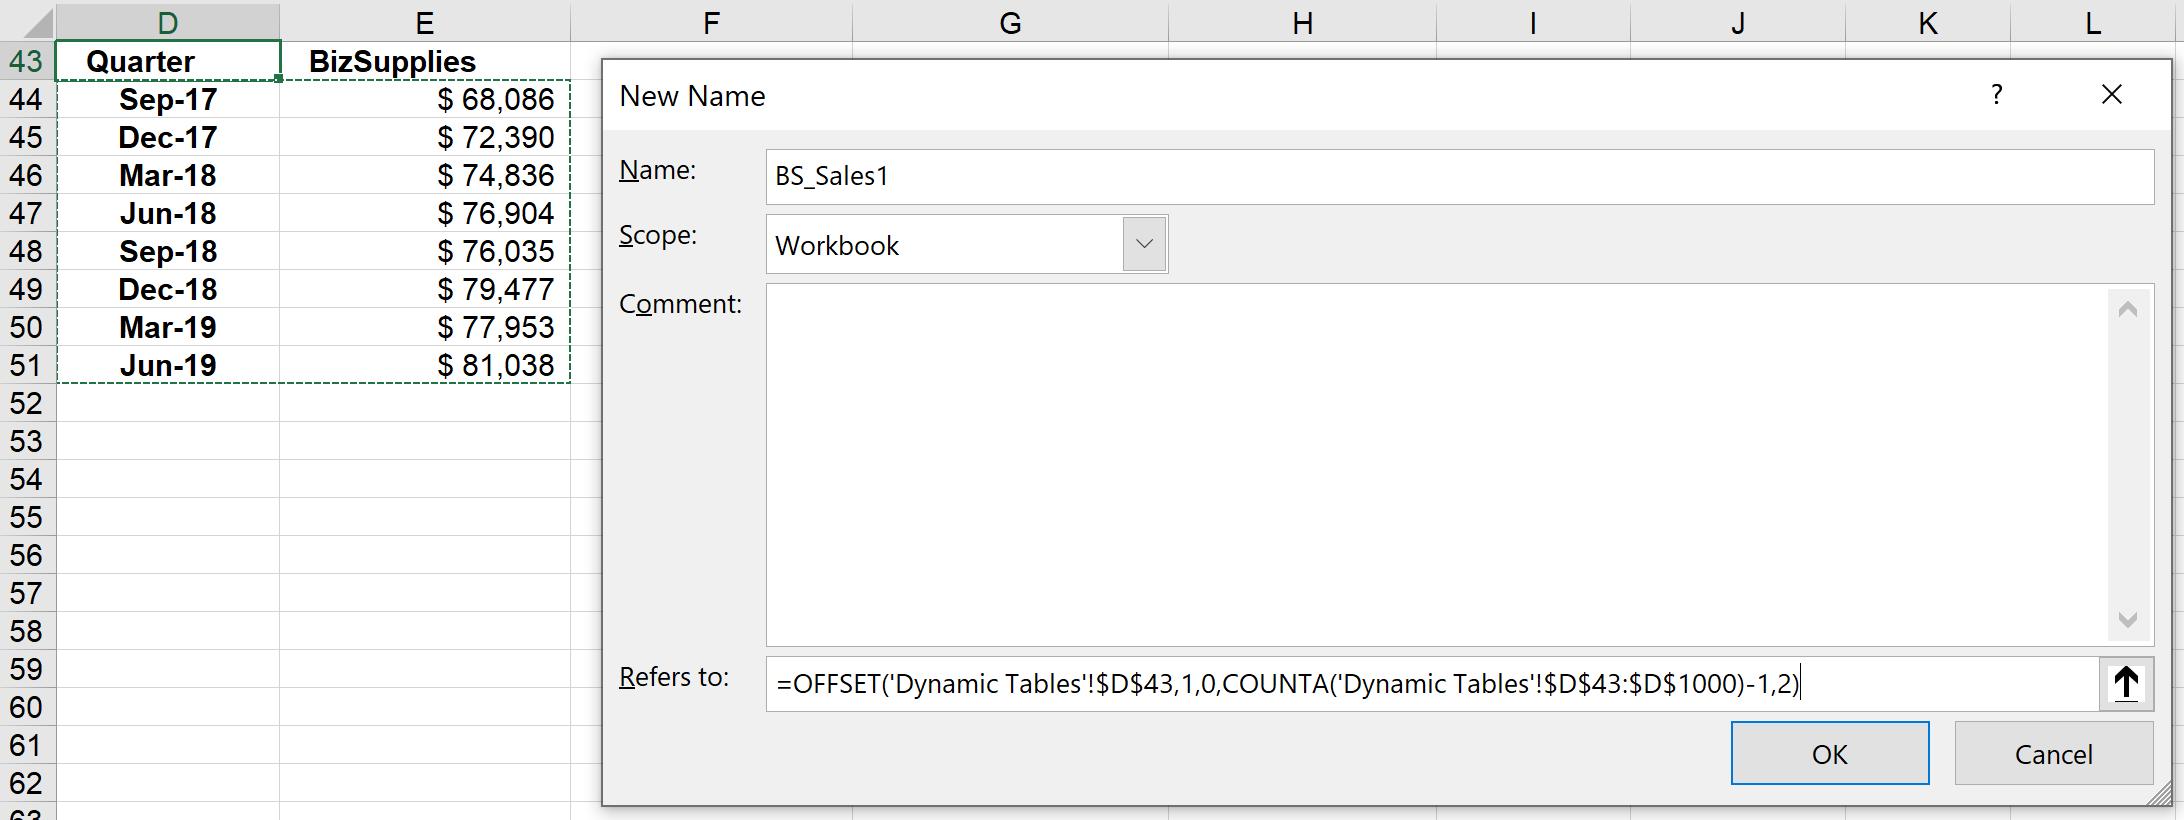
Let’s break down the OFFSET function formula:
=OFFSET('Dynamic Tables'!$D$43,1,0,COUNTA('Dynamic Tables'!$D$43:$D$1000)-1,2)
- I choose the starting cell, which, in this case, is ‘Dynamic Tables’!$D$43
- I need to type 1,0 as it will count how many rows or columns to go
- I need to count whatever the data is in Column D, e.g. range D43:D1000 and use that as the number of rows, so use COUNTA function and select ‘Dynamic Tables’$D$43:$D$1000
- since I do not want the first row (which is the Quarter header) to be counted, I have to subtract one (1)
- the number of columns will always be two (2).
If I go to the Formula tab and then click on ‘Name Manager’,
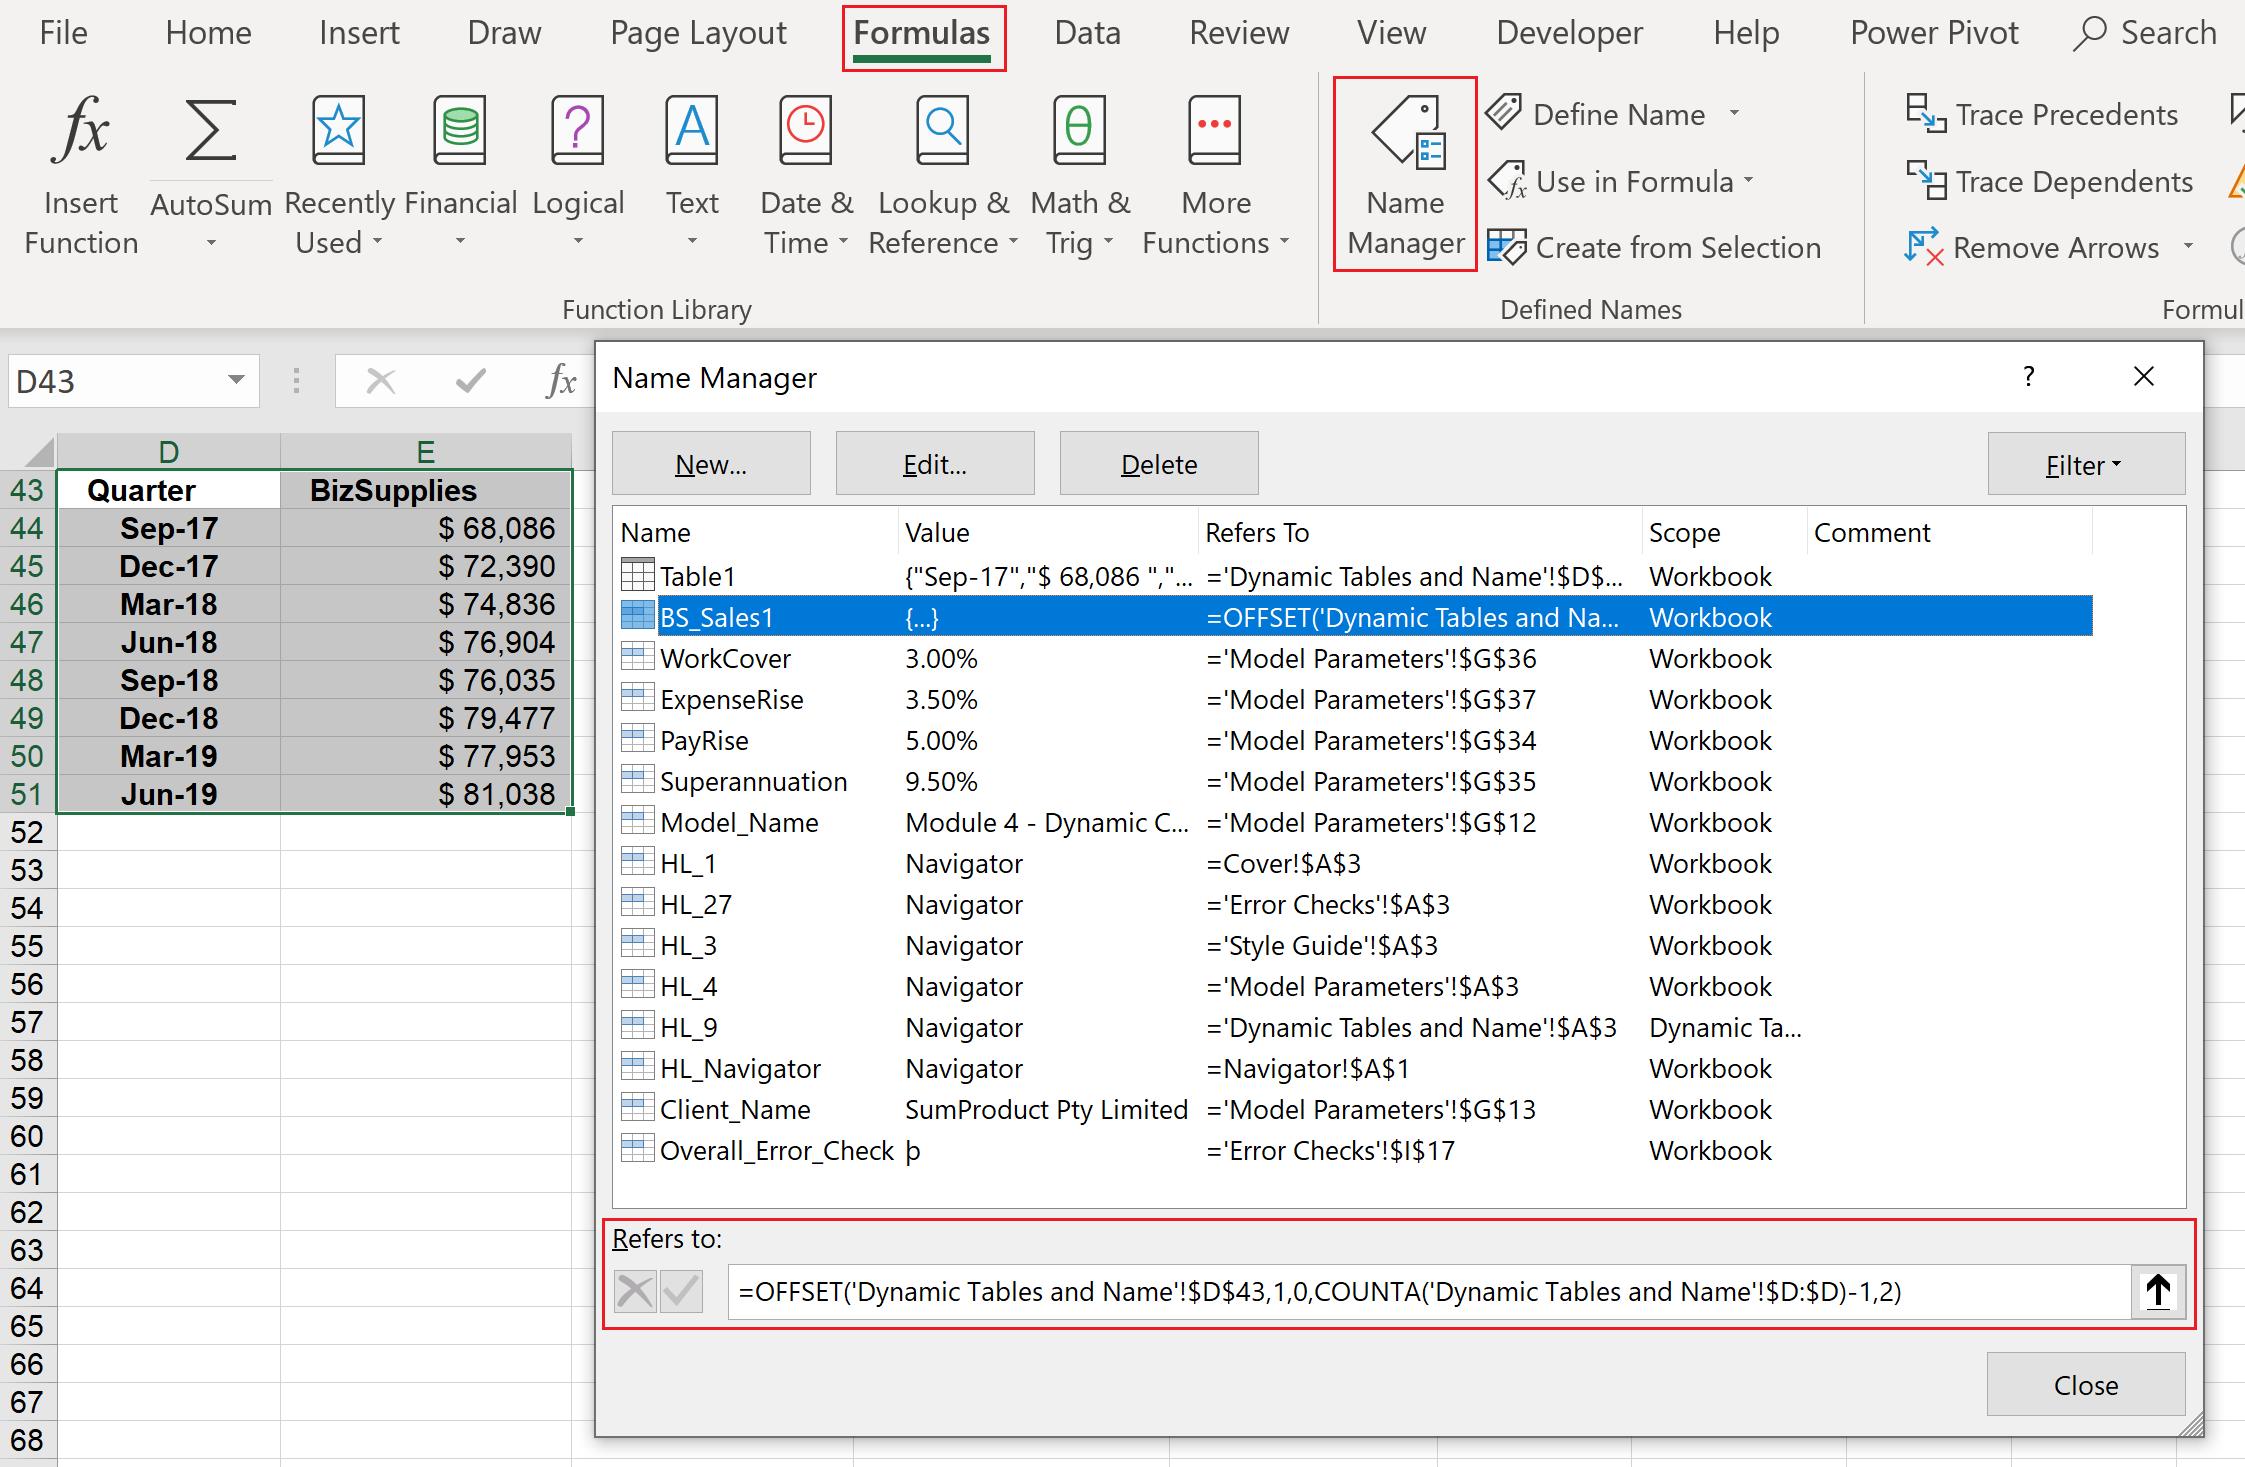
If I add more data to the table (here as blue colour to make it clear) and then go back to Formula -> ‘Name Manager’ and click on the ‘Refers to’ field again, I will now see the range has been changed to cover the newly added data:
The table has now become dynamic.
That’s it for this week, check back next week for more Charts and Dashboards tips.