
Charts and Dashboards: Great Gantt - Part 1
16 July 2021
Welcome back to our Charts and Dashboards blog series. This week, I look at how to create a Gantt chart.
Mary, one of my best imaginary salespeople, has a list of tasks to complete so that we can update our tent business.
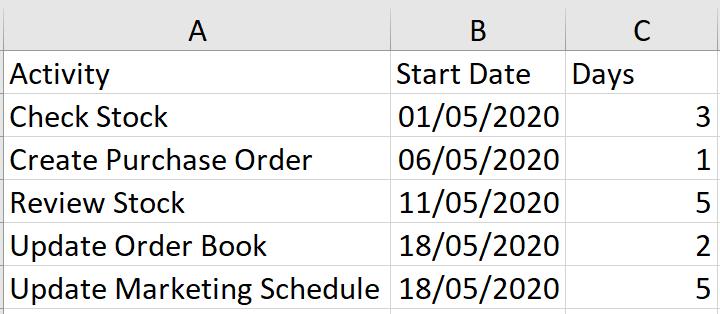
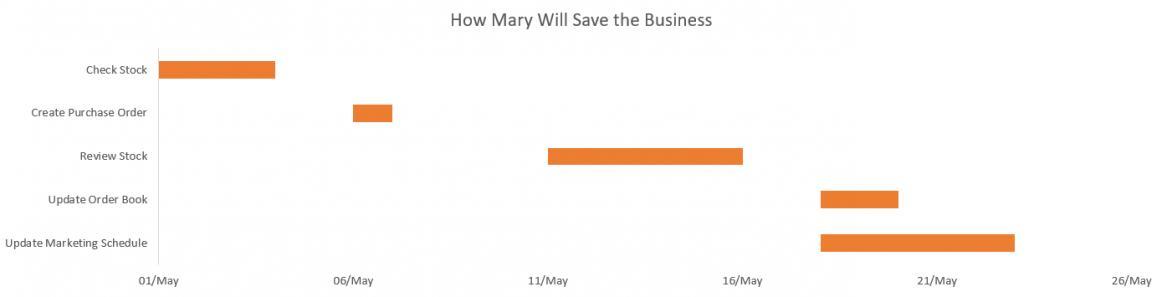
I want to present this in a Gantt chart, so that Mary may easily see the length of each task and whether any tasks overlap.
This week I am going to organise the data I need to do this in a chart. Next time, I will format the chart.
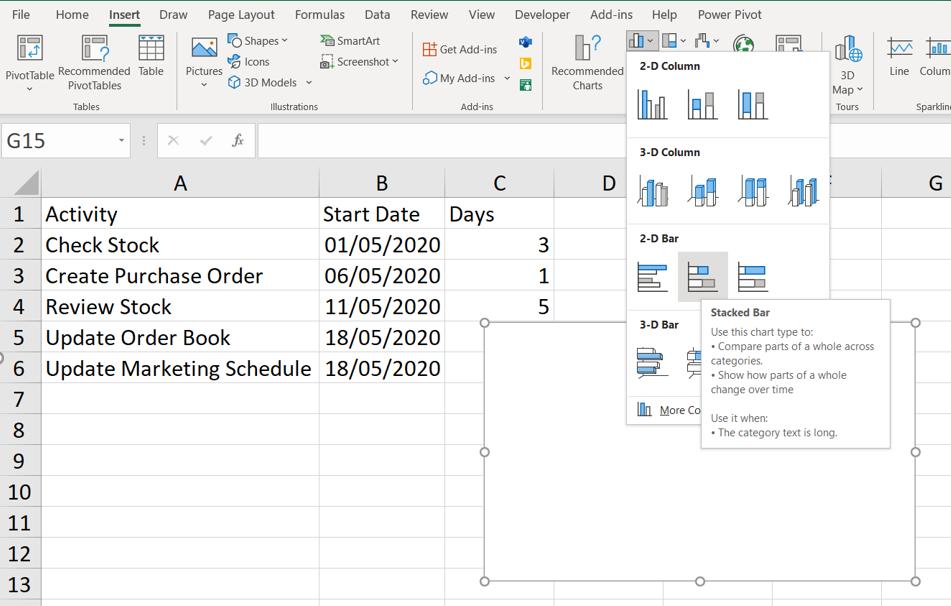
Without selecting any of the data, I start with a blank chart. In the Charts section of the Insert tab, I choose to create a Stacked Bar chart, which is under the Bar chart dropdown in the ‘2-D Bar’ section.
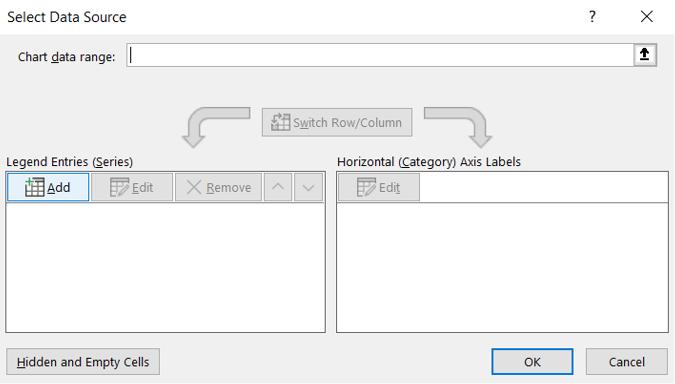
To add data to my chart, I go to ‘Select Data’ on the ‘Chart Design’ tab.
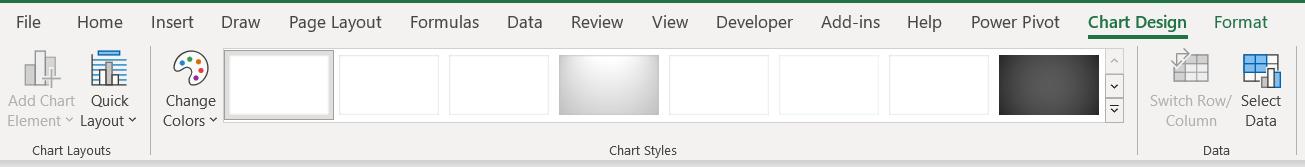
This brings up a dialog, where I can choose to ‘Edit Series’:
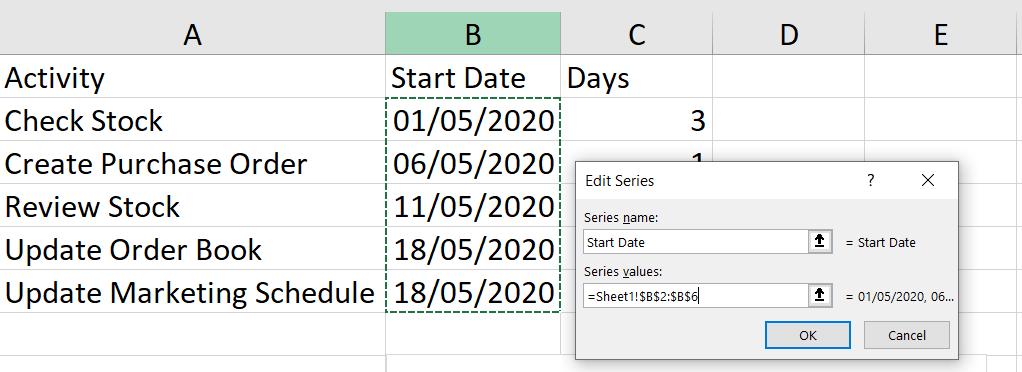
I create a series called Start Date and then choose the values in the Start Date column.
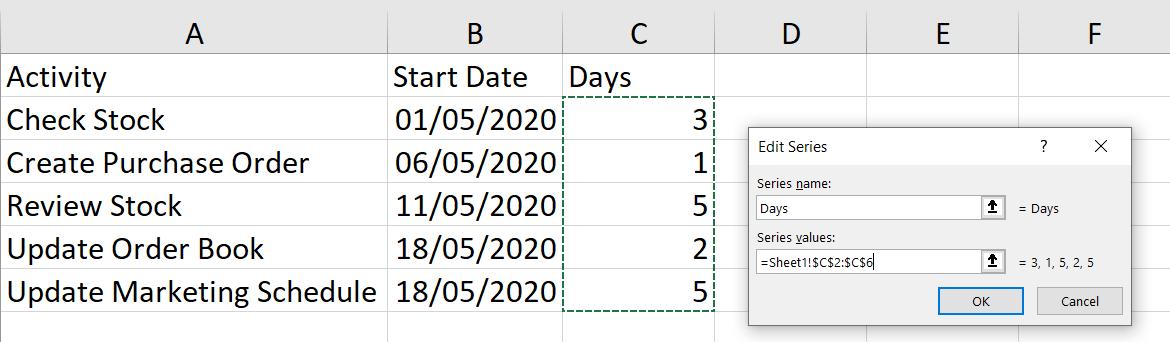
Then, I add another series, Days, and I choose the values in the Days column.
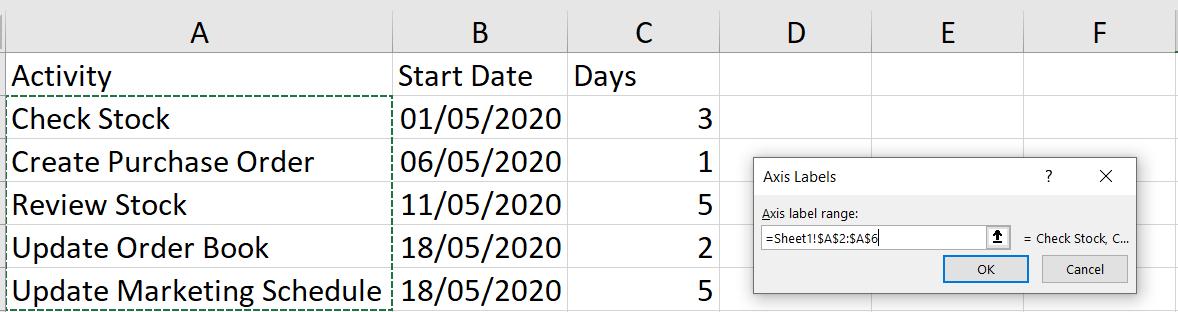
Back in the ‘Select Data’ dialog, I edit the ‘Horizontal (Category) Axis Labels’:
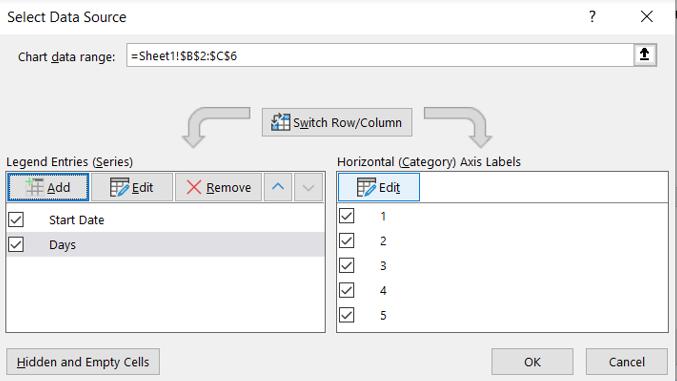
In the dialog, I enter the data in the Activity column.
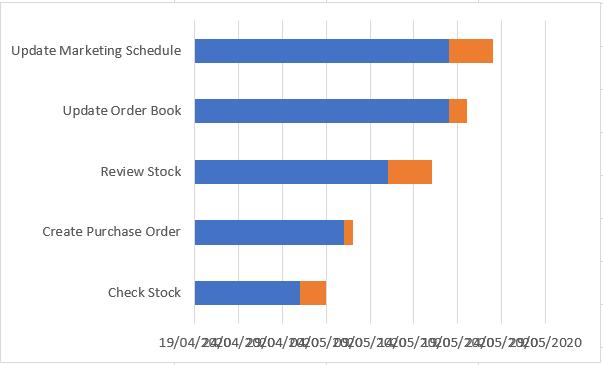
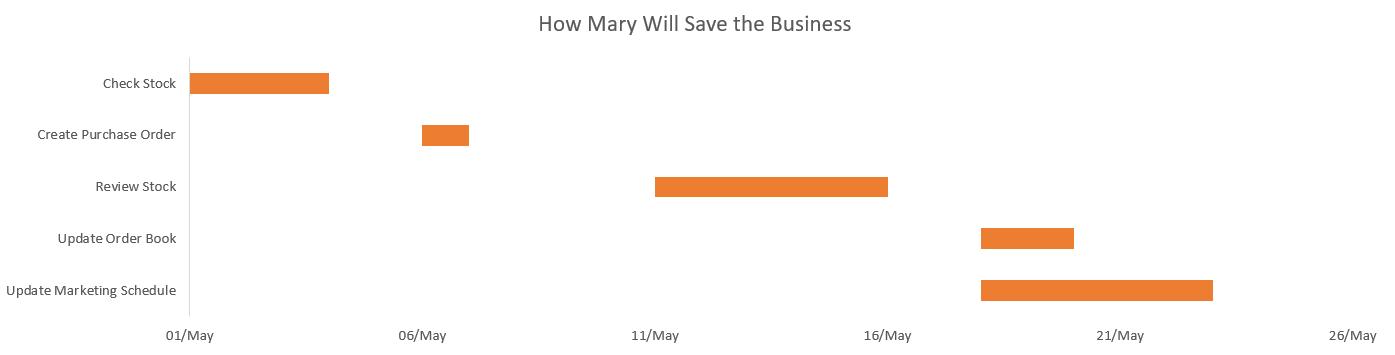
This gives me all the data I need on my chart, but I have some formatting to do. Next time I will change this:
to this:
That’s it for this week. Come back next week for more Charts and Dashboards tips.