
Charts and Dashboards: Getting to Know Charts in Excel
18 October 2019
Welcome to the very first post on Charts and Dashboards blog series. As a fresh start, let’s get to know about Charts and Dashboards in Excel.
What are charts?
Charts are visual representations of data organised into a graphical format. Data is usually represented by symbols like bars in a bar chart, lines in a line chart or areas in an area chart.
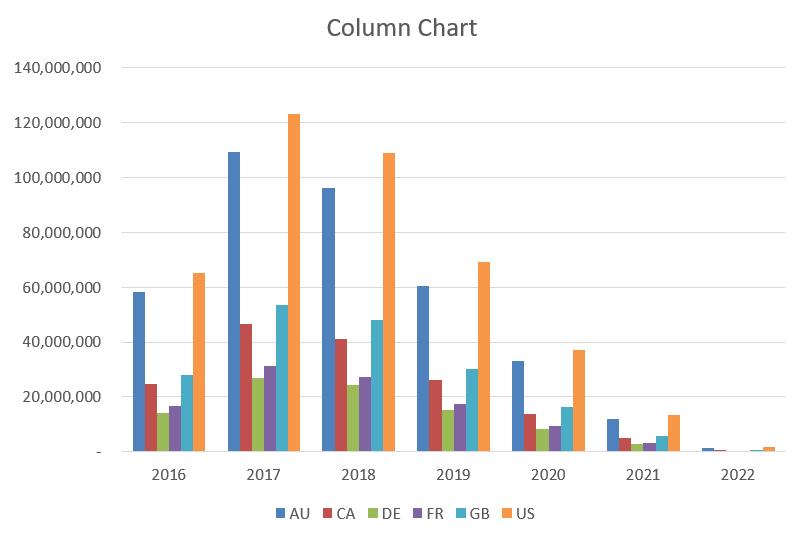
Here are some examples of column charts…
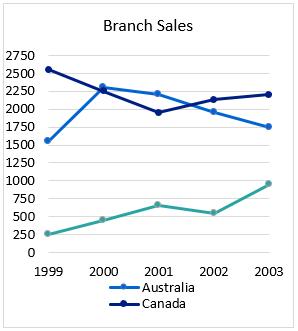
…and line charts:
What do I need to create charts?
I simply can create charts using Excel. All Excel versions offer chart creation tools. To insert a chart, this varies slightly between versions of Excel, but typically, it goes something like this. From the Insert tab:

However, on the Insert tab, there are several new chart types available only in Excel 2016 / Office 365 onwards, such as Box & Whisker, Funnel, Histogram – Pareto, Sunburst, Treemap, Waterfall, and in Excel 2019, Filled map.
There, a key question is: how do you know which version of Excel you are using?
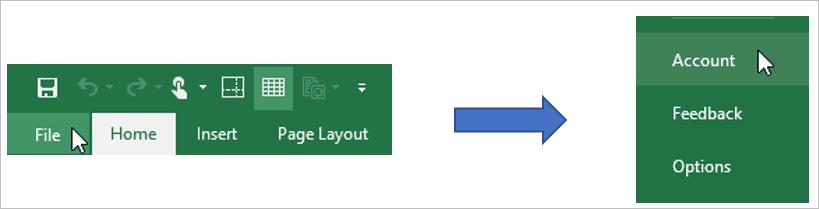
- In the File tab on the Ribbon, choose Account:
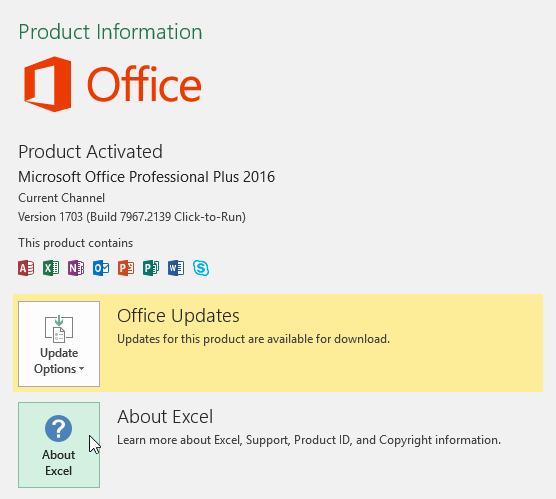
- Then, select the ‘About Excel’ option. The version of Excel will be displayed at the top of the pop-up window:
What would I use charts for?
The simple answer is to present data!
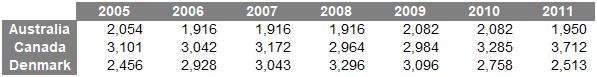
I am not able to determine patterns in the data just by looking at raw numbers:
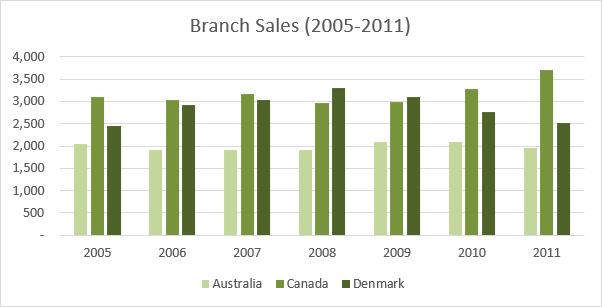
However, with a chart, life is much easier:
That’s it for this week; check back next week for more Charts and Dashboards tips.