
Final Friday Fix: May 2022 Challenge
27 May 2022
On the final Friday of each month, we are going to set an Excel / Power BI challenge for you to puzzle over so that you can get your “Excel fix”. Challenge your office colleagues to see who can solve the puzzle quickest. There are no prizes at this stage: you are playing for bragging rights only!
The Challenge
We are all aware that Power Pivot works with the DAX (Data Analysis Expression) language. Power Pivot employs DAX for data modelling, and it is simple to use for self-service BI. Data tables and columns in data tables are the foundation of DAX. It's worth noting that it's not reliant on individual cells in the table like Excel's formulae and operations are. Data Analysis Expressions (DAX) may appear overwhelming at first, but the fundamentals of DAX are simple. However, as we continue to try to tackle ever more challenging challenges, we occasionally reach some hard boundaries.
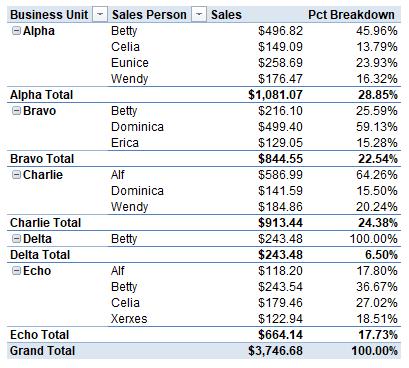
We have sales data for each employee in their respective business divisions. What would you do if you wanted to create a PivotTable that showed the sales amount made by each salesperson in their individual business units, as well as a percentage breakdown for each business unit and the percentage contribution of each business unit to total sales?
You can download the question file here.
As always, there are a few requirements:
- this problem should be solved entirely in Power Pivot and with the help of measures
- filtering should not modify the proportion contribution of each business unit to total sales.
Sounds easy? Then why not have a go? We’ll publish one solution in Monday’s blog. Have a great weekend in the meantime!