
Monday Morning Mulling: November 2023 Challenge
27 November 2023
On the final Friday of each month, we set an Excel / Power Pivot / Power Query / Power BI problem for you to puzzle over for the weekend. On the Monday, we publish a solution. If you think there is an alternative answer, feel free to email us. We’ll feel free to ignore you.
The challenge this month was to create a cumulative COUNTIF with only one [1] Excel formula.
The Challenge
We considered this example on Friday: three [3] players play a game together and each time there is only one [1] winner. They keep a record of the results (as in the picture) and they would like a running count of how many times the current winner has won. For example, player ‘A’ won the sixth game, which was their third personal victory, so the sixth running count should be three [3]. Similarly, the seventh count should be four [4]. We challenged you to create an appropriate Excel formula.
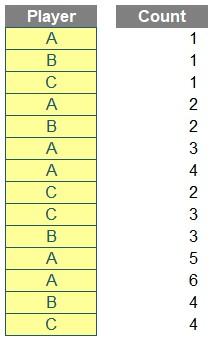
The data was stored in a Table Tbl_Outcomes, and the result should look like the screenshot above. There were some requirements:
- the solution should be a single formula, within one cell
- this was a formula challenge; no Power Query / Get & Transform or VBA.
The question file could be downloaded here and you could download our sample solution here, which we will walk through in the details below.
A COUNTIF Approach
The core of our solution is the COUNTIF function. The COUNTIF function has two [2] arguments, range and criteria, and it counts how many times the specified criteria (yes, I know it should be “criterion”, but try telling that to Microsoft!) occurs in the designated range. More advanced uses of the COUNTIF function might include using wildcard characters (* and ?) on text strings, or using comparison operators to find a range of numerical values (e.g. count all values greater than 20). For more details on that, please see our blog on the COUNTIF function.
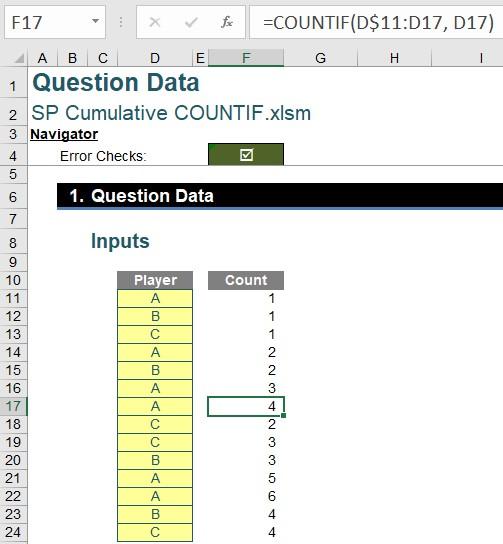
The core of our solution is to extract longer and longer segments to use in the range argument. To start, we can achieve that by anchoring the beginning of ranges. For example, player ‘A’ wins the seventh game, and we can use the following formula to calculate the seventh count.
=COUNTIF(D$11:D17, D17)
The formula counts the seventh winner (player ‘A’) among all previous winners (D11:D17), and it does the same on longer and longer ranges.
A LAMBDA Construction
For concise presentation, we define a named range Outcomes for the Table column Tbl_Outcomes[Player].
To describe our logic, we are counting the nth record in the range one [1] to n, which may be encoded into a LAMBDA function. Here we will use a BYROW function with a LAMBDA function, and we will also use a TAKE function (also explained below) to extract the first n cells of a range.
The BYROW function has the following syntax:
=BYROW(array, LAMBDA(parameter, calculation))
There are two [2] arguments: an array and a LAMBDA function. The LAMBDA function takes each row of the array as its parameter and performs the specified calculation on it.
The TAKE function has the following syntax:
=TAKE(array, rows, [columns])
and it has three [3] arguments:
- array: the array from which to take rows or columns
- rows: the number of rows to take. A negative value takes from the end of the array
- columns: the number of columns to take. A negative value takes from the end of the array.
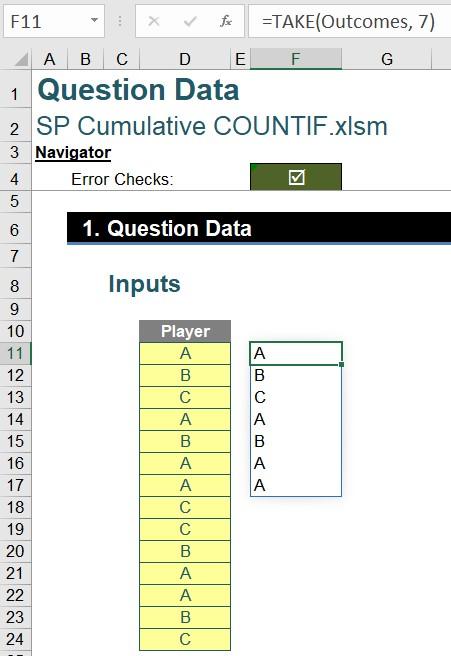
For example, the following formula will take the first seven [7] cells from Outcomes:
=TAKE(Outcomes, 7)
and we can use that as the range in a COUNTIF function.
Now we are ready to look at the final formula:
=BYROW(SEQUENCE(ROWS(Outcomes)),
LAMBDA(n, COUNTIF(TAKE(Outcomes, n), INDEX(Outcomes, n))))
The ROWS function measures how long the list Outcomes is, and the SEQUENCE function creates an index for that starting from one [1].
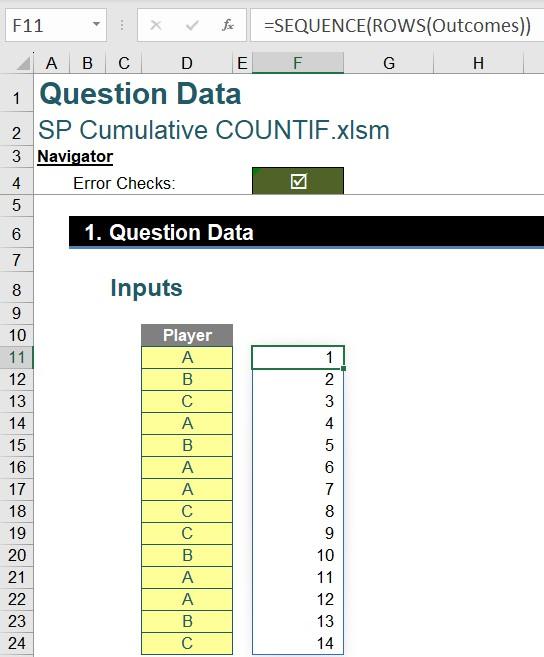
Then the LAMBDA function uses each of the index as the parameter n. For the nth row, the TAKE function takes the first n cells from the list Outcomes, and the INDEX function outputs the nth entry of Outcomes. The COUNTIF function counts how many times the nth entry occurs in the first n cells. Thus, with one [1] Excel formula, we are able to count how many times the current winner has won already:
Word to the Wise
The solution can be further simplified to the following:
=COUNTIF(TAKE(Outcomes, SEQUENCE(ROWS(Outcomes))), Outcomes)
where we’ve used the spilled index from ROWS and SEQUENCE functions in the rows argument of the TAKE function, and the whole list Outcomes in the criteria argument of the COUNTIF function.
Using the SEQUENCE function inside the TAKE function produces an array of arrays, which is not allowed in Excel, but it happens to work inside the COUNTIF function.
If we try to visualise the TAKE function, we will get #VALUE! errors instead of #SPILL! errors.
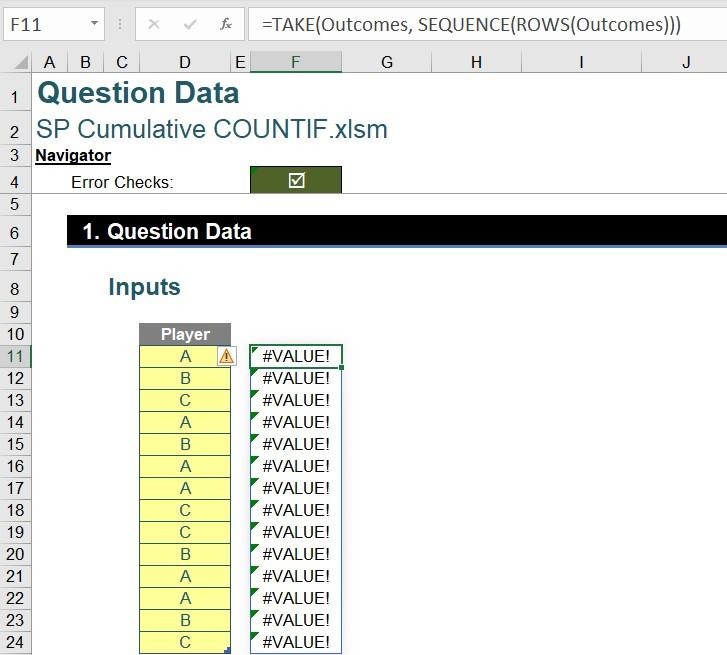
Confusing, eh?
The Final Friday Fix will return on Friday 29 December 2023 with a new Excel Challenge. In the meantime, please look out for the Daily Excel Tip on our home page and watch out for a new blog every business working day.