
Power BI Blog: List Slicer Continues to Improve
19 June 2025
Welcome back to this week’s edition of the Power BI blog series. This week revisit the ever-improving List slicer.
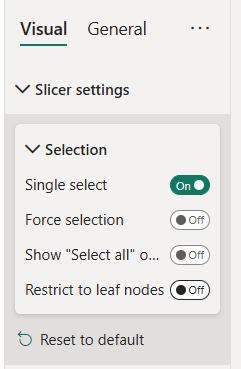
Released in Preview in October 2024, the List slicer continues to improve. For a start, you may now restrict selection in the slicer to only the last level (leaf nodes) when using a hierarchy with the slicer. This means that users can only select the most specific items within the list. To use this option, just select the ‘Restrict to leaf nodes’ option with the Selection card of the Formatting pane. Once selected, selecting any of the higher nodes of the slicer will always expand / collapse the level instead of selecting it.
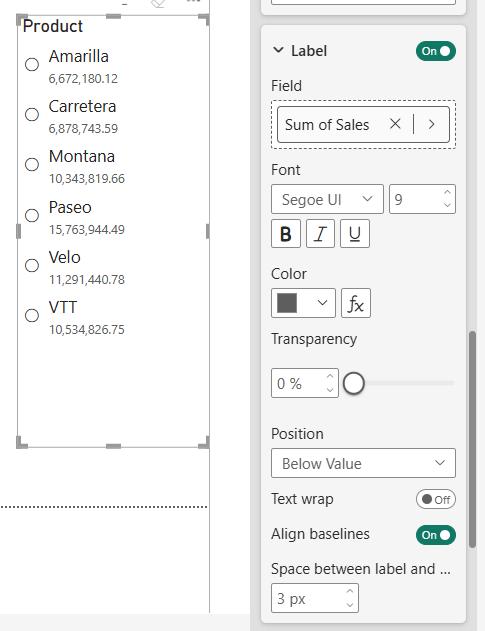
Next are two [2] new slicer formatting options: Label and Images.
- Label allows you to add a secondary row to each value in the slicer to provide additional information, whether that be a subtitle or an additional metric. You can find Label as a section of the Callout values card. You have similar formatting options to the values themselves
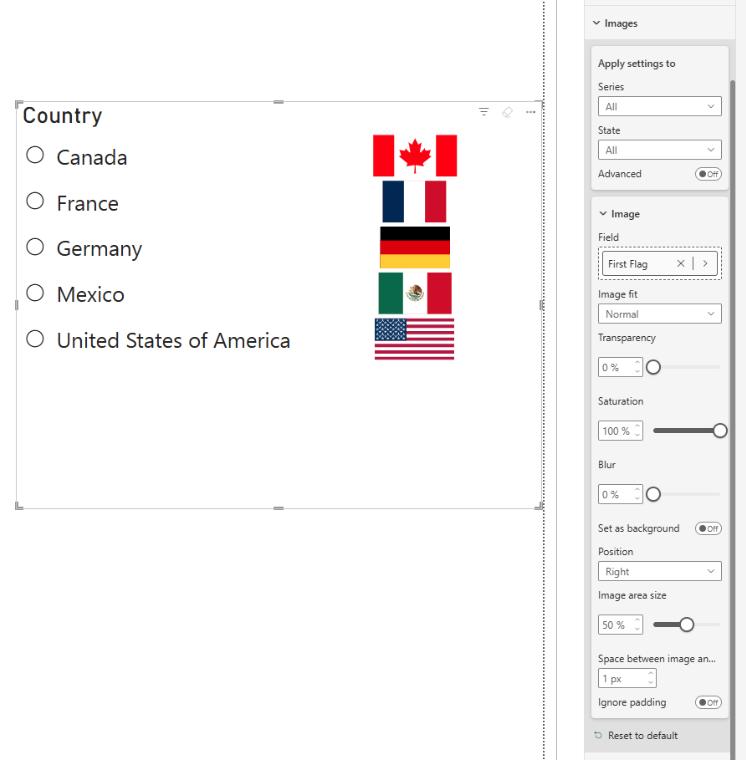
- The new Images card lets you add, er, images to your slicer. You can add a unique image from your model to go along with each value of your slicer and control some basic formatting for that image including (but not limited to) image fit, transparency, saturation and position.
The method for controlling the formatting of the various states of the slicer has been thoroughly revised. Previously, you were limited to Default, Hover, Press, Selected and Mixed as your states, and the formatting was always shared across all fields within the hierarchy. Now, you may format each field of your hierarchy separately using the Series dropdown of the Apply settings to card.
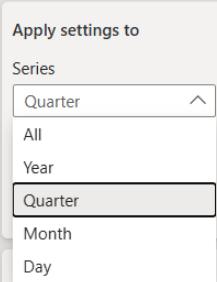
For each of those, you’ll have control over a subset of the following states: All, Rest, Hover, Press, Selected and Mixed. Power BI has been updated: the dropdown now conditionally shows only the states that are most commonly applicable for that card’s component, so for example, you won’t see Mixed as an Option for the expand / collapse icon.
Additionally, Power BI has an Advanced toggle that breaks down the states you can configure into Selection, Expansion and Interaction States.
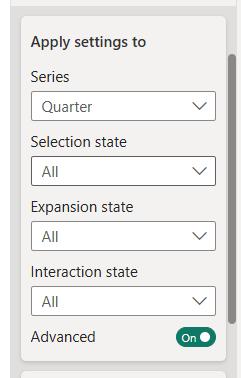
The breakdown of what’s formattable in each of these is as follows:
- Selection state: All, Selected, Unselected, Mixed
- Expansion state: All, Expanded, Collapsed
- Interaction state: All, Hover, Press, Rest, Disabled.
This allows you to get incredibly precise about the formatting for every possible state of individual values of the slicer. It should be remembered that you may do this separately for each level of the hierarchy if you want to. You have these new state controls for the Callout values, Images, Selection icon, expand / collapse icon and Buttons cards.
Furthermore, you may now paste a series of values into the new List and Button slicers that are in Preview. Simply copy the values you want to filter by to your clipboard from tools just as Excel or Notepad, and either select the Paste option from the ‘…’ button in the visual header or select the slicer and use CTRL + V.
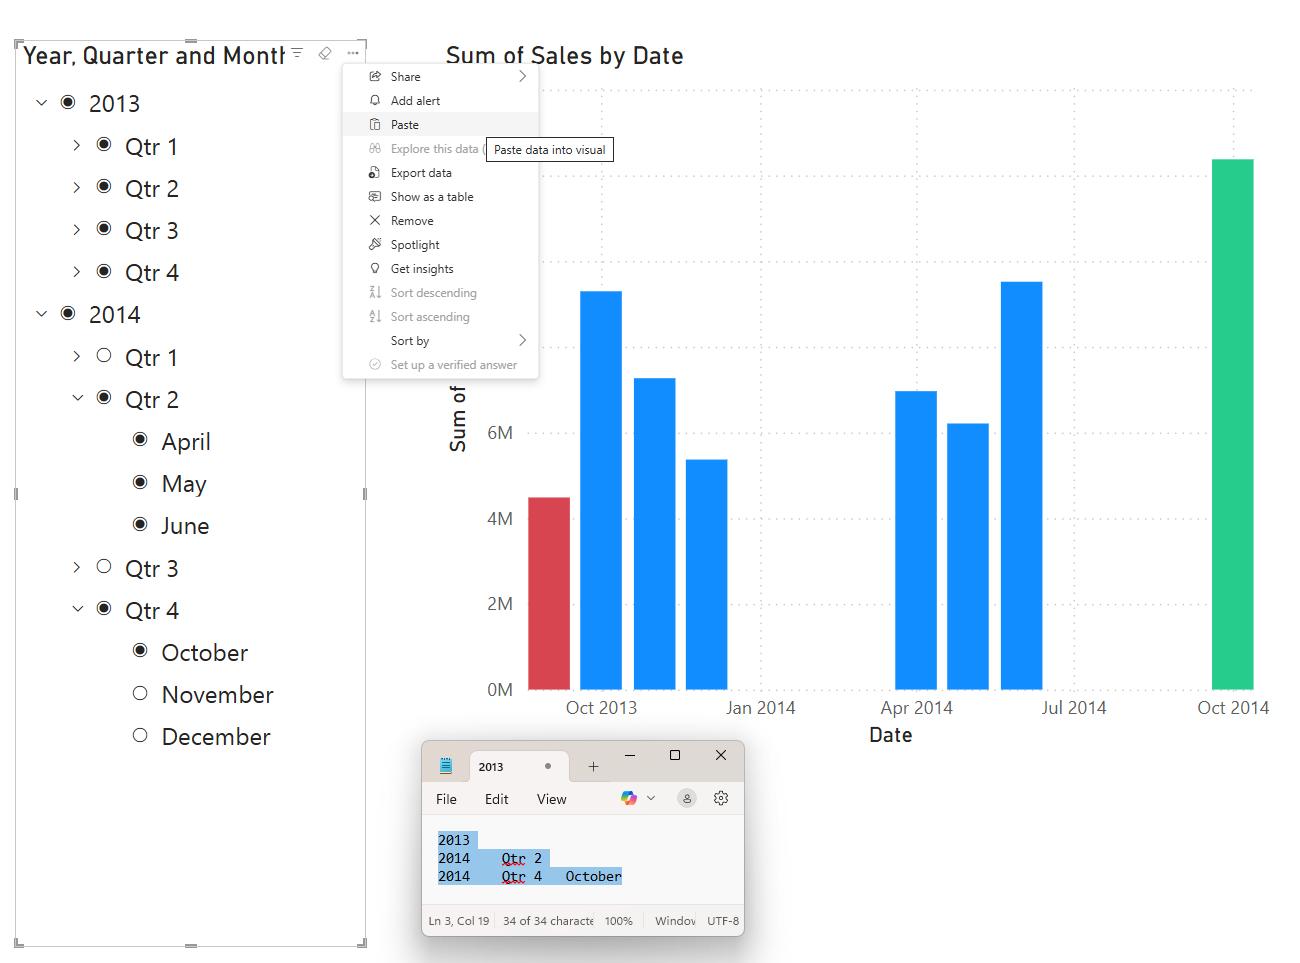
Each individual value should be on its own line, and levels of the hierarchy should be separated by tab. As an example, if you wanted to filter by the second quarter of a year, your row would be ‘2025 Quarter 2’, with a tab in between. Also, the order of the values should be in the same order as the columns in the field well. Your data should also not include any headers.
It should be noted that:
- columns that use group on keys are not supported
- when reading numbers and dates, Microsoft supports both the short format for the current culture and the current column format in Power BI
- empty values within a row are treated as blanks.
In the meantime, please remember we offer training in Power BI which you can find out more about here. If you wish to catch up on past articles, you can find all of our past Power BI blogs here.