Power BI Blog: Data Profiling
15 November 2018
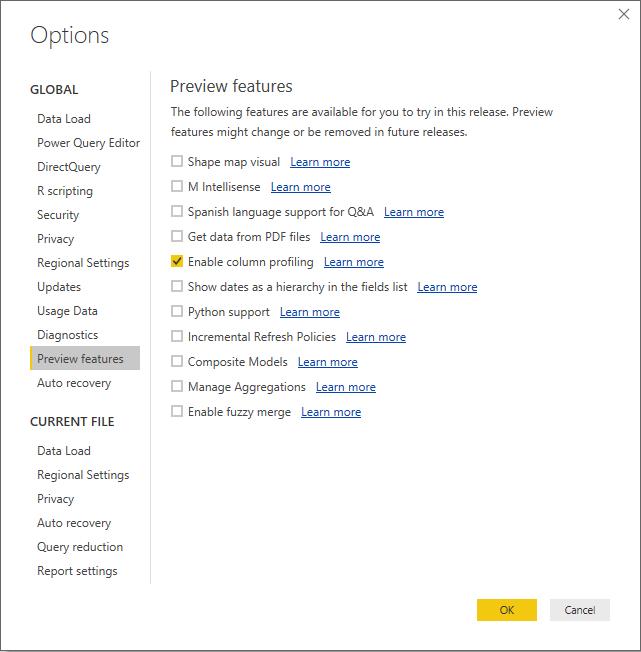
Welcome back to our Power BI blog series! This week, we’re going to talk about a new feature that was launched in October 2018 called Data Profiling. This enables you to easily identify issues with your data in the Power Query Editor. Firstly, you will need to enable this in Options - > Preview features -> “Enable column profiling”, as it’s currently still in preview.

Once you enable it in options, you can open up the Power Query Editor and look at the top of the columns:

That green bar tells you what proportion of values in the column are currently valid, in error, or empty. If there are errors in the dataset, you’ll see a flash of red accordingly:

Alternatively, if there are blank rows (such as when you replace errors with null values), you will see that appear in a different colour as well:

This is a simple way to quickly ascertain what sort of values appear in your rows. You can also see the results more explicitly if you prefer by going to the View tab and clicking on Column Quality.

If you click on Column Distribution instead, you’ll be able to see the distribution of your values too – how many unique or distinct values there are, and roughly how they are split up.


However, it’s important to note that the profiling at the moment only considers values in the top 1000 rows, so it’s not comprehensive! We’re hoping that this will change in future versions, so that it will run over our entire dataset – perhaps in the Data tab in PBI Desktop at least rather than in the Query Editor, if the issue is a load/refresh one.
Hopefully this is a useful new tool for you! Check back next week for more tips and tricks in Power BI!

