
Power BI Blog: Setting Up Custom ToolTips
10 December 2020
Welcome back to this week’s edition of the Power BI blog series. This week, we look at how to set up a custom ToolTip.
We have previously discussed ToolTips and their existence in a previous blog. However, we did not go in depth on how to set them up. Let’s put that right today.
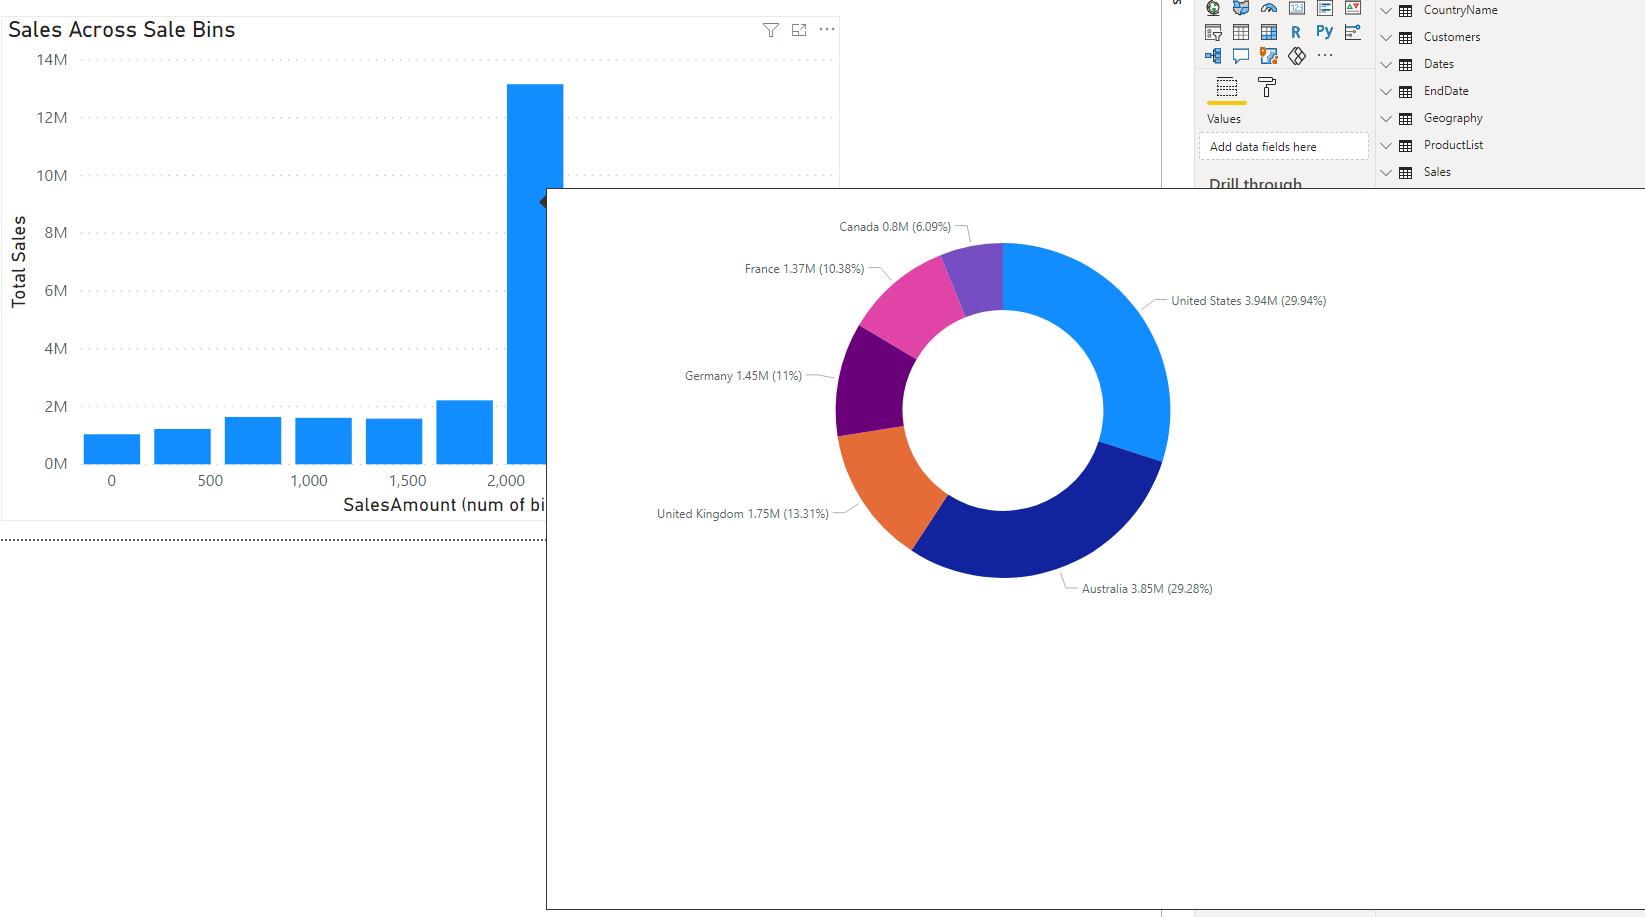
Consider our “complex” example report:
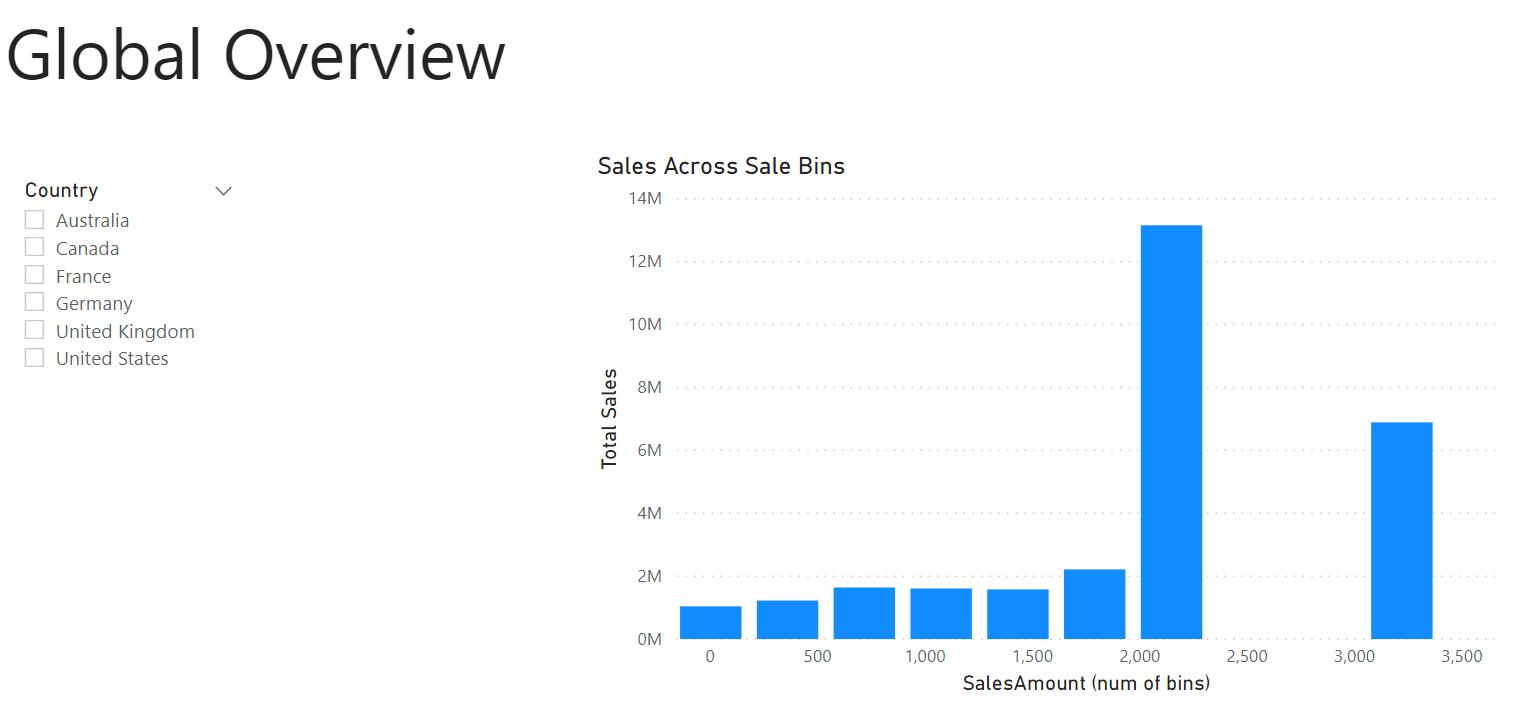
If we move the mouse over any of the columns, by default, we are presented with the following ToolTip:
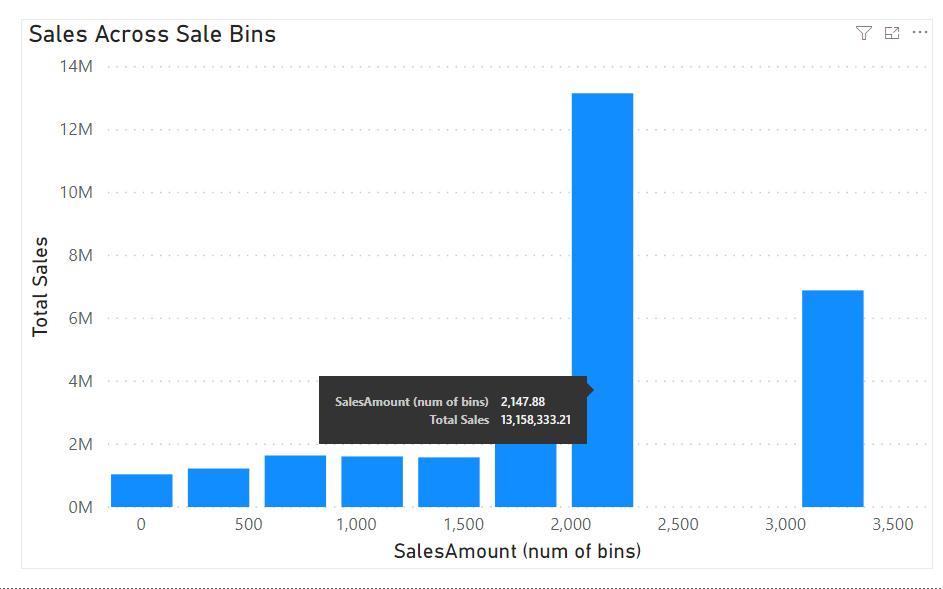
Sure, it has the added benefit of telling us the precise number of Total Sales. However, what if we wanted to know the breakdown of sales in each country when we positioned the mouse over a column?
In this scenario, we are going to have to create a custom ToolTip. The first step in this process is to create a new report page (click on the plus icon on the bottom right-hand side of the pages in Power BI).
There are two things we have to do before creating the visualisations for our custom ToolTip page:
- Mark this page as a ToolTip page
- Change the ‘Page size’.
While on the new page, navigate to the ‘Page information’ drop down section on the Visualizations panel:
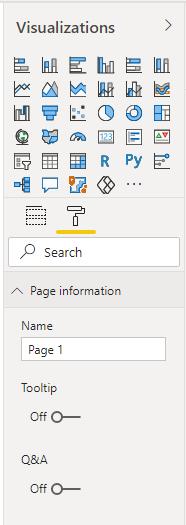
It is always good practice to give the page a name. We have elected to give it the appropriate name of ‘Tooltip1’ (yes 10/10 for being creative!). We also must toggle the Tooltip option to On.
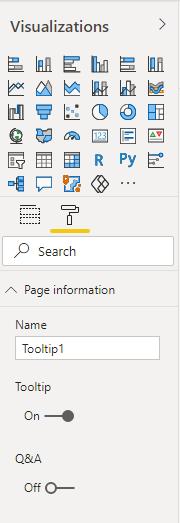
With the Tooltip option toggled On, Power BI will recognise this page as a ToolTip page.
Moving on, we should also adjust the page size. Otherwise, you will end up with a ToolTip that looks like this:
Expand the ‘Page size’ option and select the Tooltip or Custom option from the drop-down list. The Custom option will give you a bit more flexibility in page size, allowing you to adjust how much information you want the ToolTip to portray. For this example, we have picked the Tooltip option.
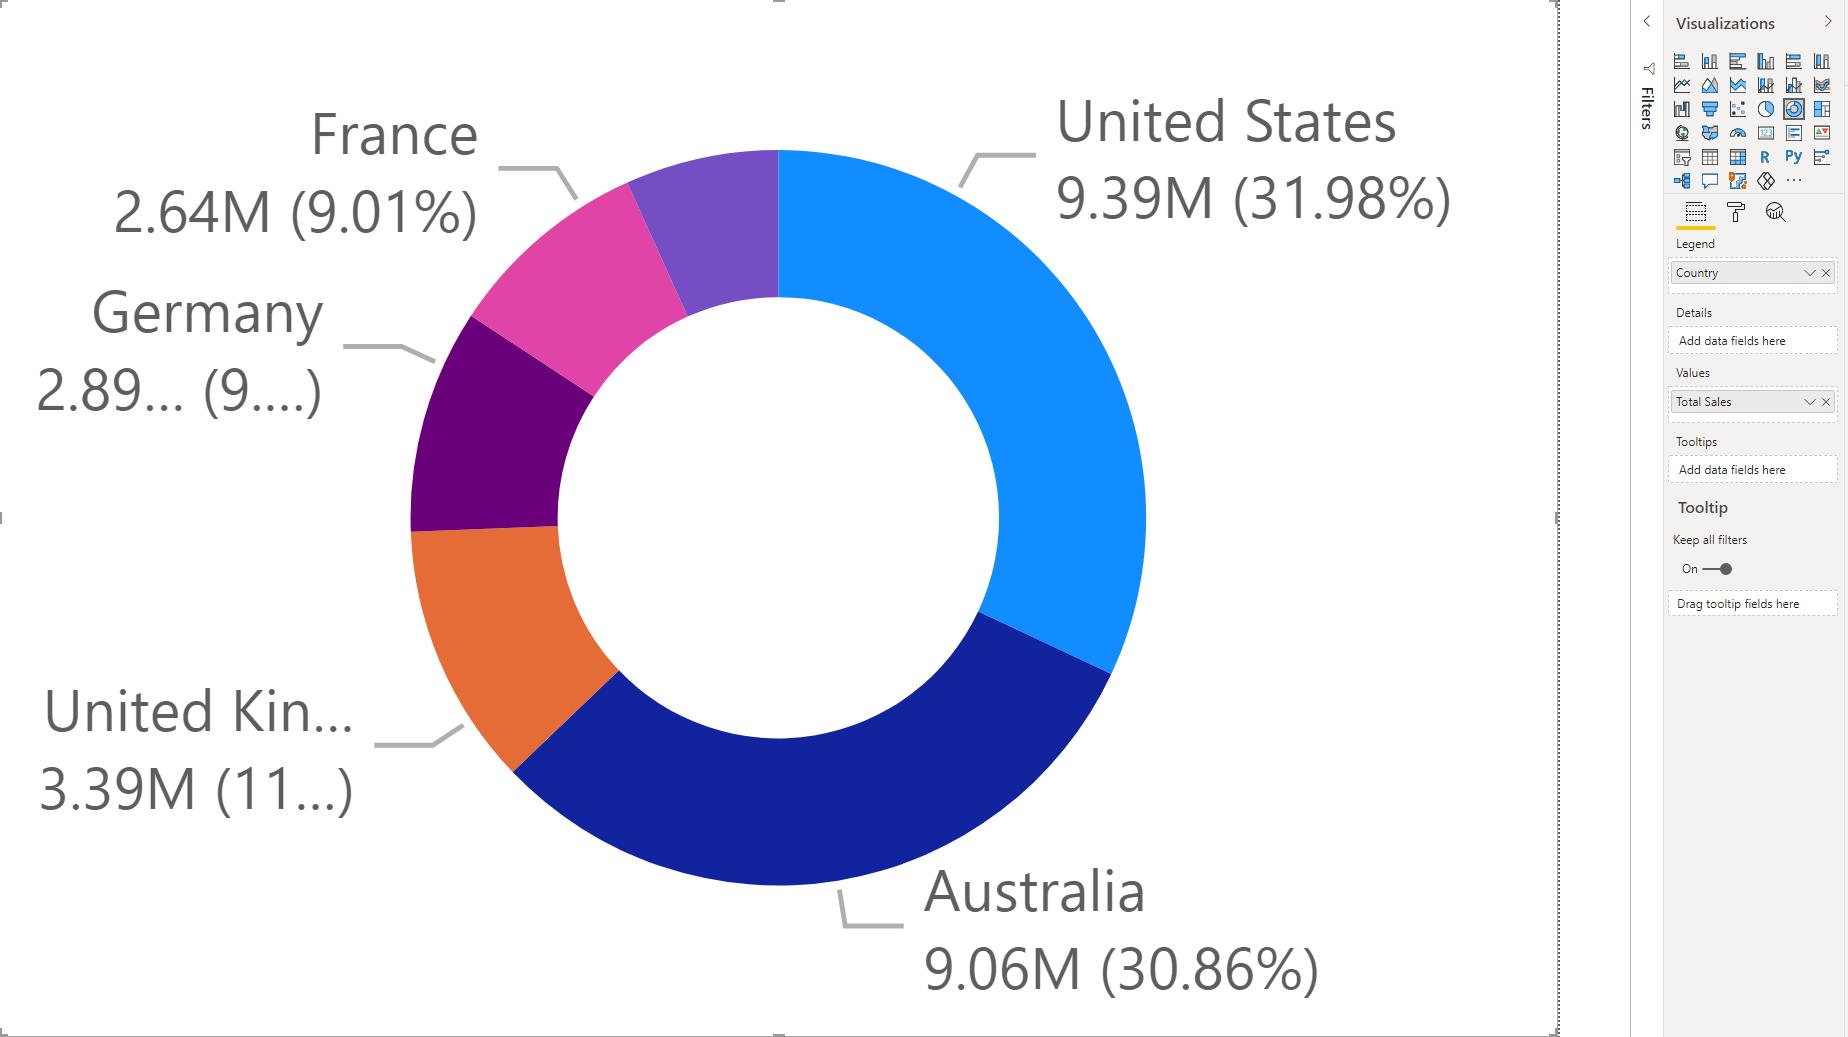
We can finally create the visualisation that we wish to be displayed as the Tooltip. For this example, we have picked a Donut visualisation.
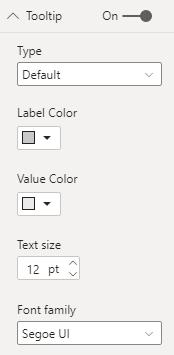
Navigate back to our ‘Global Overview’ page and select the visualisation you wish to add Tooltip1 to. With the visualisation selected, we may go to the Format tab and expand the Tooltip section:
Change the Type to ‘Report Page’. This will reveal a second drop-down option (Page):
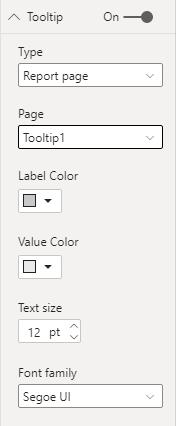
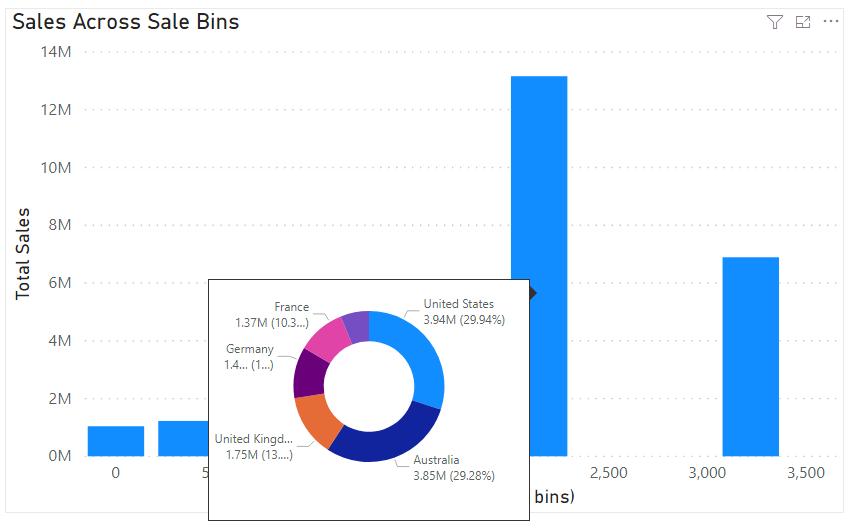
Here we select, you guessed it, Tooltip1. Now if a user places the mouse over a column in the visualisation, this happens:
There we have it, a step and step guide on how to create a custom ToolTip.
That’s it for this week! Join us next week for more on Power BI.
In the meantime, please remember we offer training in Power BI which you can find out more about here. If you wish to catch up on past articles, you can find all of our past Power BI blogs here.