
Power BI Blog: Show Visuals as Tables
7 March 2024
Welcome back to this week’s edition of the Power BI blog series. This week, we look at how to show visuals as Tables.

Leveraging Power BI’s previous accessibility improvements to Table and Matrix visualisations, the Power BI team is now introducing a new view mode called ‘Show visuals as tables’, which displays report visuals in a tabular format with a single action. Some users may prefer to consume data in a text-based or tabular format depending on their different learning styles and usage of assistive technologies. This provides a supplemental format for visuals that allows users to display the data in the way that best meets their needs.
This new view mode is similar to how ‘Show as a table’ displays underlying data for individual visuals today. ‘Show visuals as tables’ will display the underlying data for visuals for all pages in the current report, with the added functionality of interaction and cross-filtering capabilities.
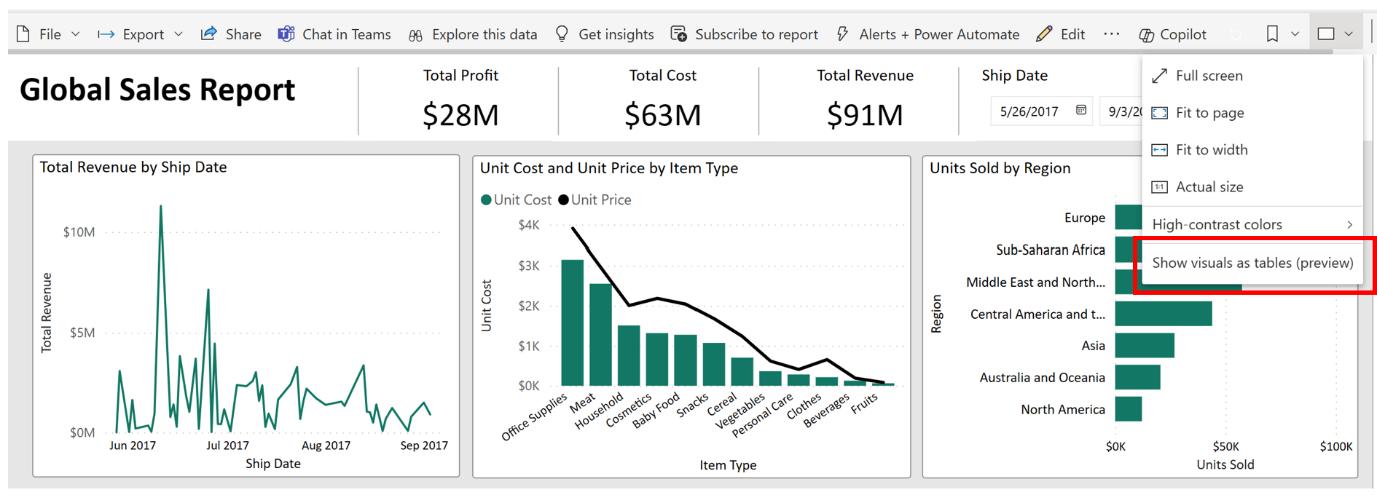
To activate this view mode, navigate to the view dropdown menu and select ‘Show visuals as tables’:
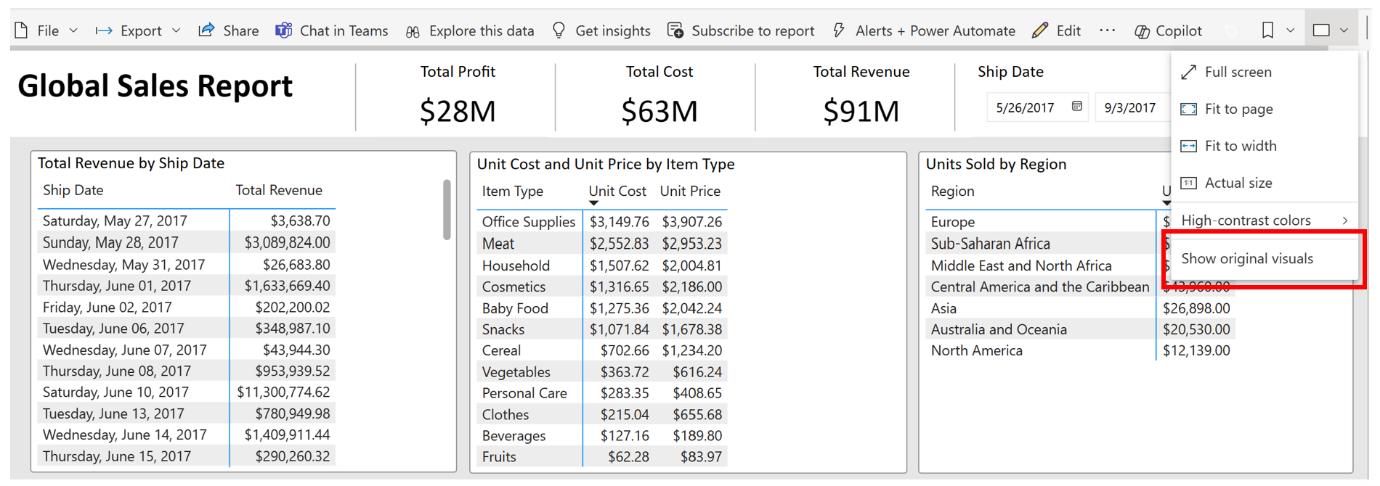
To revert, select ‘Show original visuals’:
Alternatively, you may simply use the keyboard shortcut CTRL + SHIFT + F11 to toggle between the two views.
In the meantime, please remember we offer training in Power BI which you can find out more about here. If you wish to catch up on past articles, you can find all of our past Power BI blogs here.