Power BI Blog: Text isn't Limiting! - Part 2
15 March 2018
Welcome back to Power BI Tips.
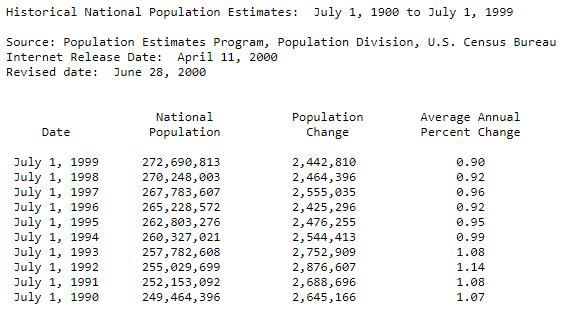
Last time we imported a text file form the US Census Bureau with the historical population estimates:
Using the Query Editor, the data was shaped to this stage:
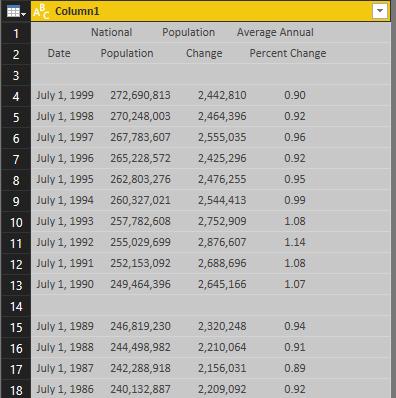
But it's not quite in a database format that we need for analysis. Time to do some more manipulation!
Let’s filter out all the blank rows. Click the drop down on the Column1 header and uncheck “(blank)”.
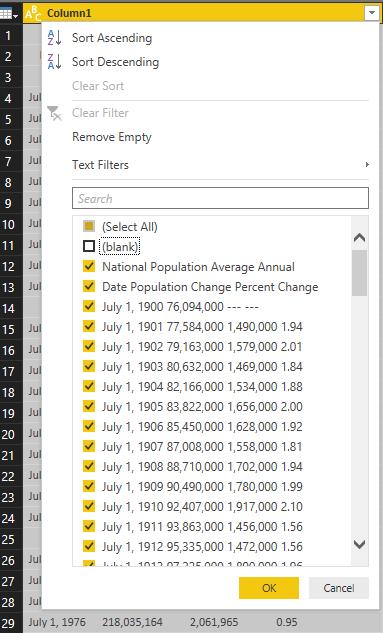
Now it’s time to split the text using the number of characters.
We’ve ascertained that the character widths for the first three columns are 19, 21, 18.
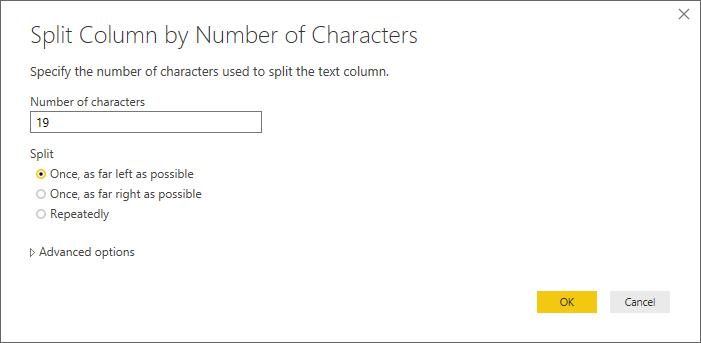
Under the “Transform” menu in the ribbon, In “Text Column” category, hit “Split Column” -> “By Number of Characters”.

Type 19 for the first column and under “Split” choose the “Once, as far left as possible” option.
Let’s see how it looks:
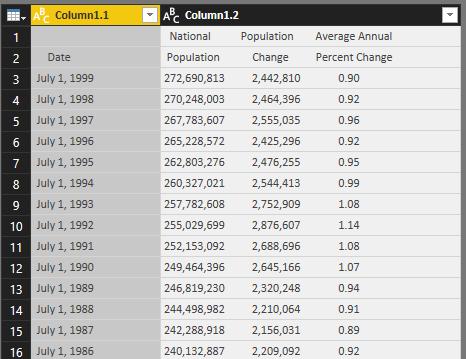
See how Column1.1 is highlighted? Highlight Column1.2 to continue splitting the column by the characters as above.
After the columns are split the table should look like this:
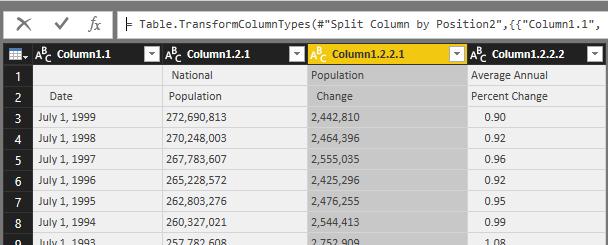
We’ll need to remove all the extra spaces from the entire table. Select all the columns and under the “Transform” menu in the ribbon, in “Text Column” category, choose “Format” -> “Trim”. This removes any leading and trailing spaces in the text.
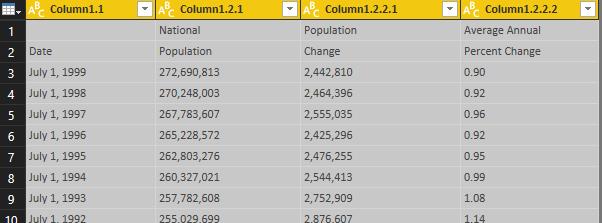
Now for the headers. Notice how the headers take two rows? We’ll need to merge them. In Power Query, the transformations are done on a column basis, to do row operations, we’ll transpose the table to make our column heading and then transpose back.
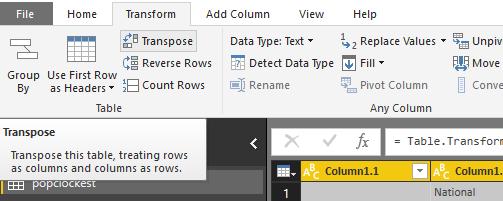
Under the “Transform” menu in the ribbon, in the “Table” category, choose “Transpose”.

Let’s create a column by combining the text of Column1 and Column2.
Under the “Add Column” menu in the ribbon, in the “General” category, choose “Custom Column”.
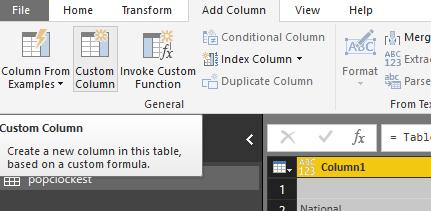
Let’s type the following formula:
=[Column1] & " " & [Column2]
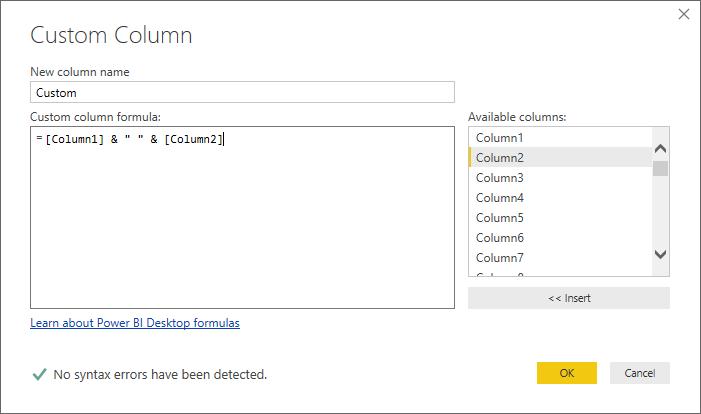
In order to type the column name, double click the column in the “Available columns” list and it will automatically bring it into the formula!
Hit "OK". Notice how the column has been added to the end:

Right click on the column, choose “Move” -> “To Beginning”.
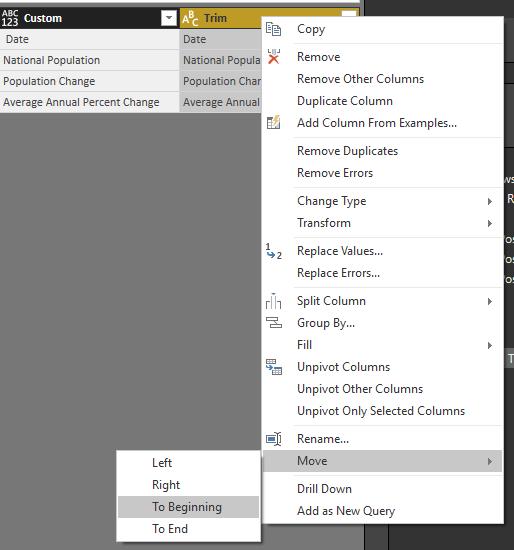
We don’t need Column1 and Column2. Right click and “Remove Columns” and then Transpose the table back. “Use the first row as Headers” and the table is looking pretty good.
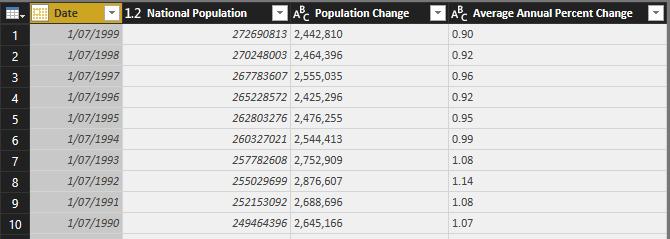
After promoting headers, often the Query Editor will make a best guess of the type of field the column is. Notice how it accurately changed Date into a Date format and National Population as a number respectively. Population Change and Average Annual Percent Change were not changed. This is because in the very last row where there were no values in the text file, the Census bureau used “---“.
Change the format manually by hitting the little icon next to the header name and choose “Decimal Number”.
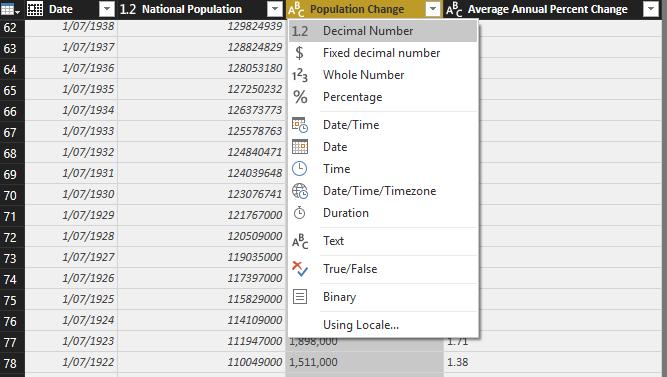
It’ll come up with a prompt saying that there is already a conversion step. “Replace current” to amend the “Change Type” that query generated.
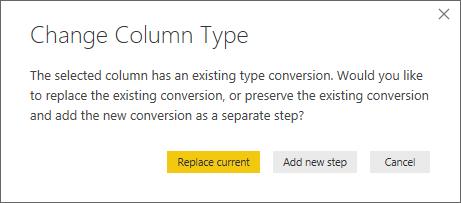
Look at the last line:

Where there was “---” has generated an error, as it was not of the type Decimal. Let’s remove these errors
Select Population Change and Average Annual Percent Change and on the Ribbon under the “Transform” menu, in “Any Column” category, choose “Replace Values” -> “Replace Errors".

Fill the Value with “null”. Null is a special value which denotes that the cell is empty.

And the following result appears:

Rename the query to something more meaningful, "Close & Apply" and we’re ready to go and start playing around with the data and create some visulisations.
Tune in next week for more Power BI Tips.

