Power BI Blog: Visual Calculations Updated
7 November 2024
Welcome back to this week’s edition of the Power BI blog series. This week, we revisit Visual Calculations, which have recently been updated.
We talked about Visual Calculations recently. Visual calculations are now on by default so you can start using them right away without having to enable the Preview feature. Of course, you can still turn them off if you wish by disabling the visual calculations preview in Options and Settings -> Options -> Preview features.
Apart from adding more formatting options as part of the visual level format strings (see below), the latest Power BI updates also enable data types for visual calculations, which allows you to now set the data type for your visual calculations in the Visual format pane under General -> Data format:

Selecting the correct data type is important as it not only influences how your visual calculation can be used in your charts and in your calculations, but also determines which formatting options are available for further customisation. You should bear in mind that if the data type and data do not match, the data type is ignored. For example, if you have data rows that contain ‘ABC’, and set the data type to ‘Decimal number’ then the data cannot be formatted as decimal number, and the data type will not be applied.
It should further be noted that the data type setting is only available for visual calculations, not for fields or measures as their data type can be set in the model only.
As a reminder, you can now add calculations directly onto your visual using visual calculations, which are DAX calculations that are defined and executed directly on a visual. A calculation can refer to any data in the visual, including columns, measures or other visual calculations. This approach removes the complexity of the semantic model and simplifies the process of writing DAX. You may use visual calculations to complete common business calculations such as running sums or moving averages. Visual calculations make it easy to create calculations that were previously very hard or even almost impossible to construct.
To use visual calculations whilst it remains in Preview, you need to enable it in Options and Settings -> Options -> Preview features. Select visual calculations and click OK. Visual calculations will then be enabled after Power BI Desktop is restarted.
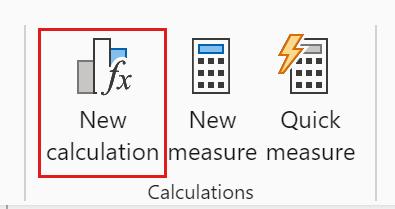
To add a visual calculation, you first need to select a visual. Then, select the ‘New calculation’ button in the Ribbon:

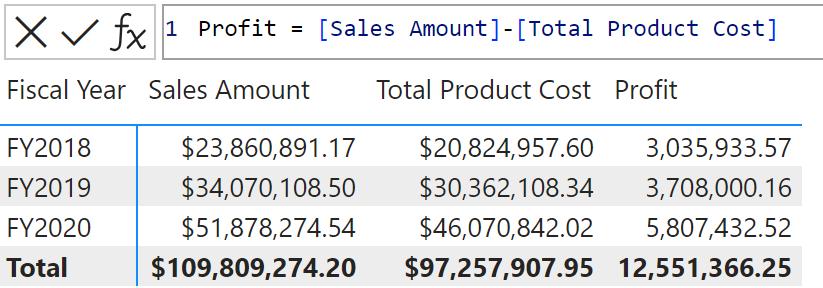
To add a visual calculation, type the expression in the Formula bar in the ‘Visual Calculations edit mode’ that opens. For example, in a visual that contains Sales Amount and Total Product Cost by Fiscal Year, you can add a visual calculation that calculates the profit for each year by simply typing:
Profit = [Sales Amount] – [Total Product Cost]Profit = [Sales Amount] – [Total Product Cost]

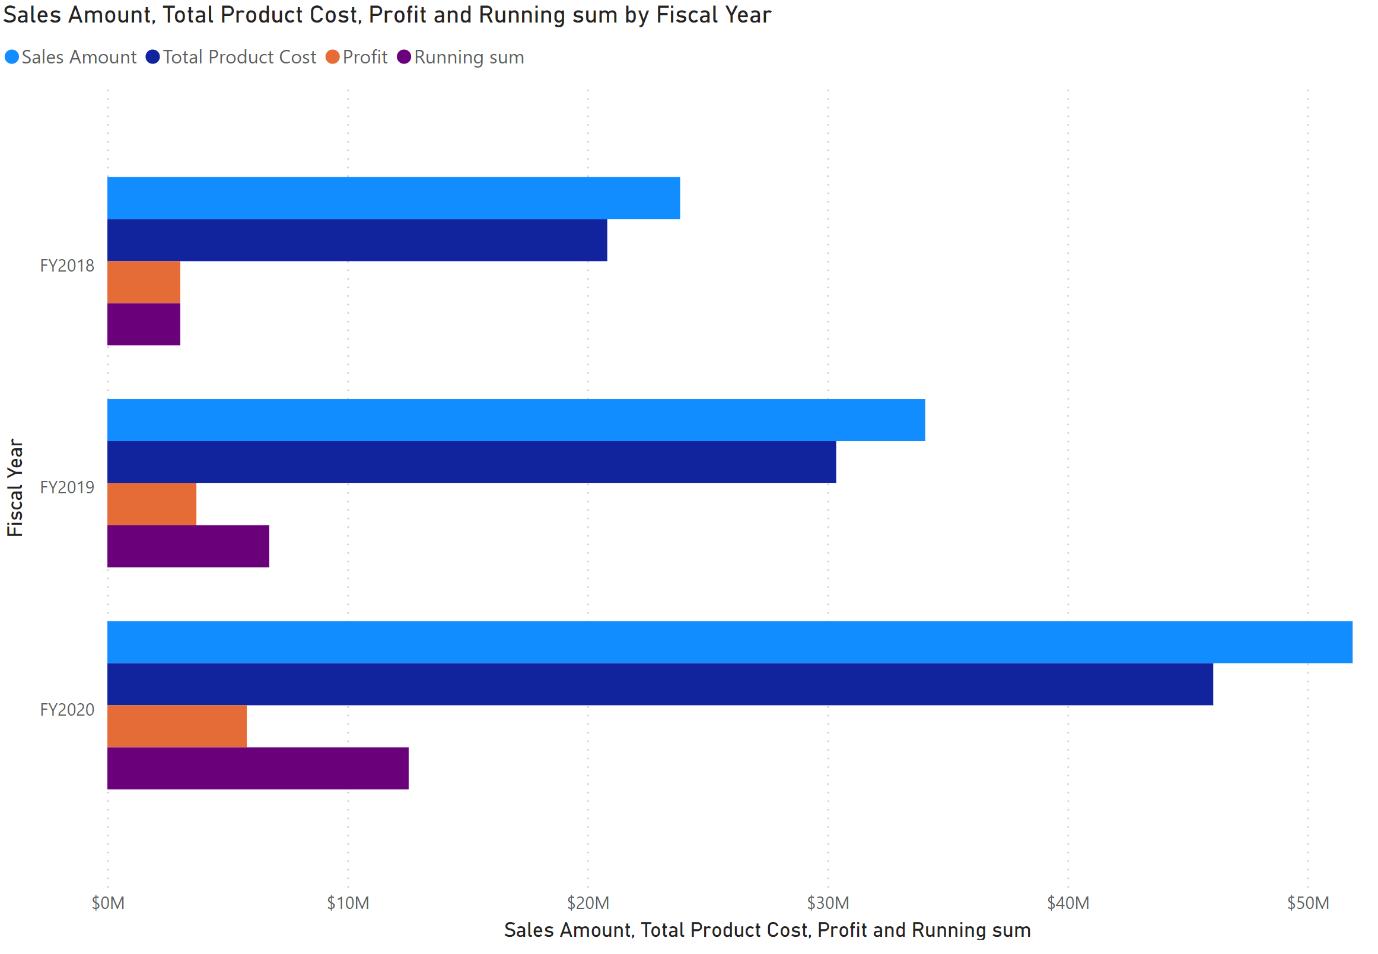
The visual matrix is updated as you add visual calculations in the Formula bar: new visual calculations are added as columns to the visual matrix. Additionally, you can easily add a running sum of profit by writing:
Running sum profit = RUNNINGSUM([Profit])

You can use many existing DAX functions in visual calculations. Functions specific to visual calculations are also available, such as RUNNINGSUM, PREVIOUS and MOVINGAVERAGE. Using these and other functions, visual calculations are much easier to read, write and maintain than the current DAX required.
That’s it for this week. In the meantime, please remember we offer training in Power BI which you can find out more about here. If you wish to catch up on past articles, you can find all of our past Power BI blogs here.

