
Power Pivot Principles: Slicing the Bridge
13 April 2021
Welcome back to the Power Pivot Principles blog. This week, we will create a slicer to filter out the summary table.
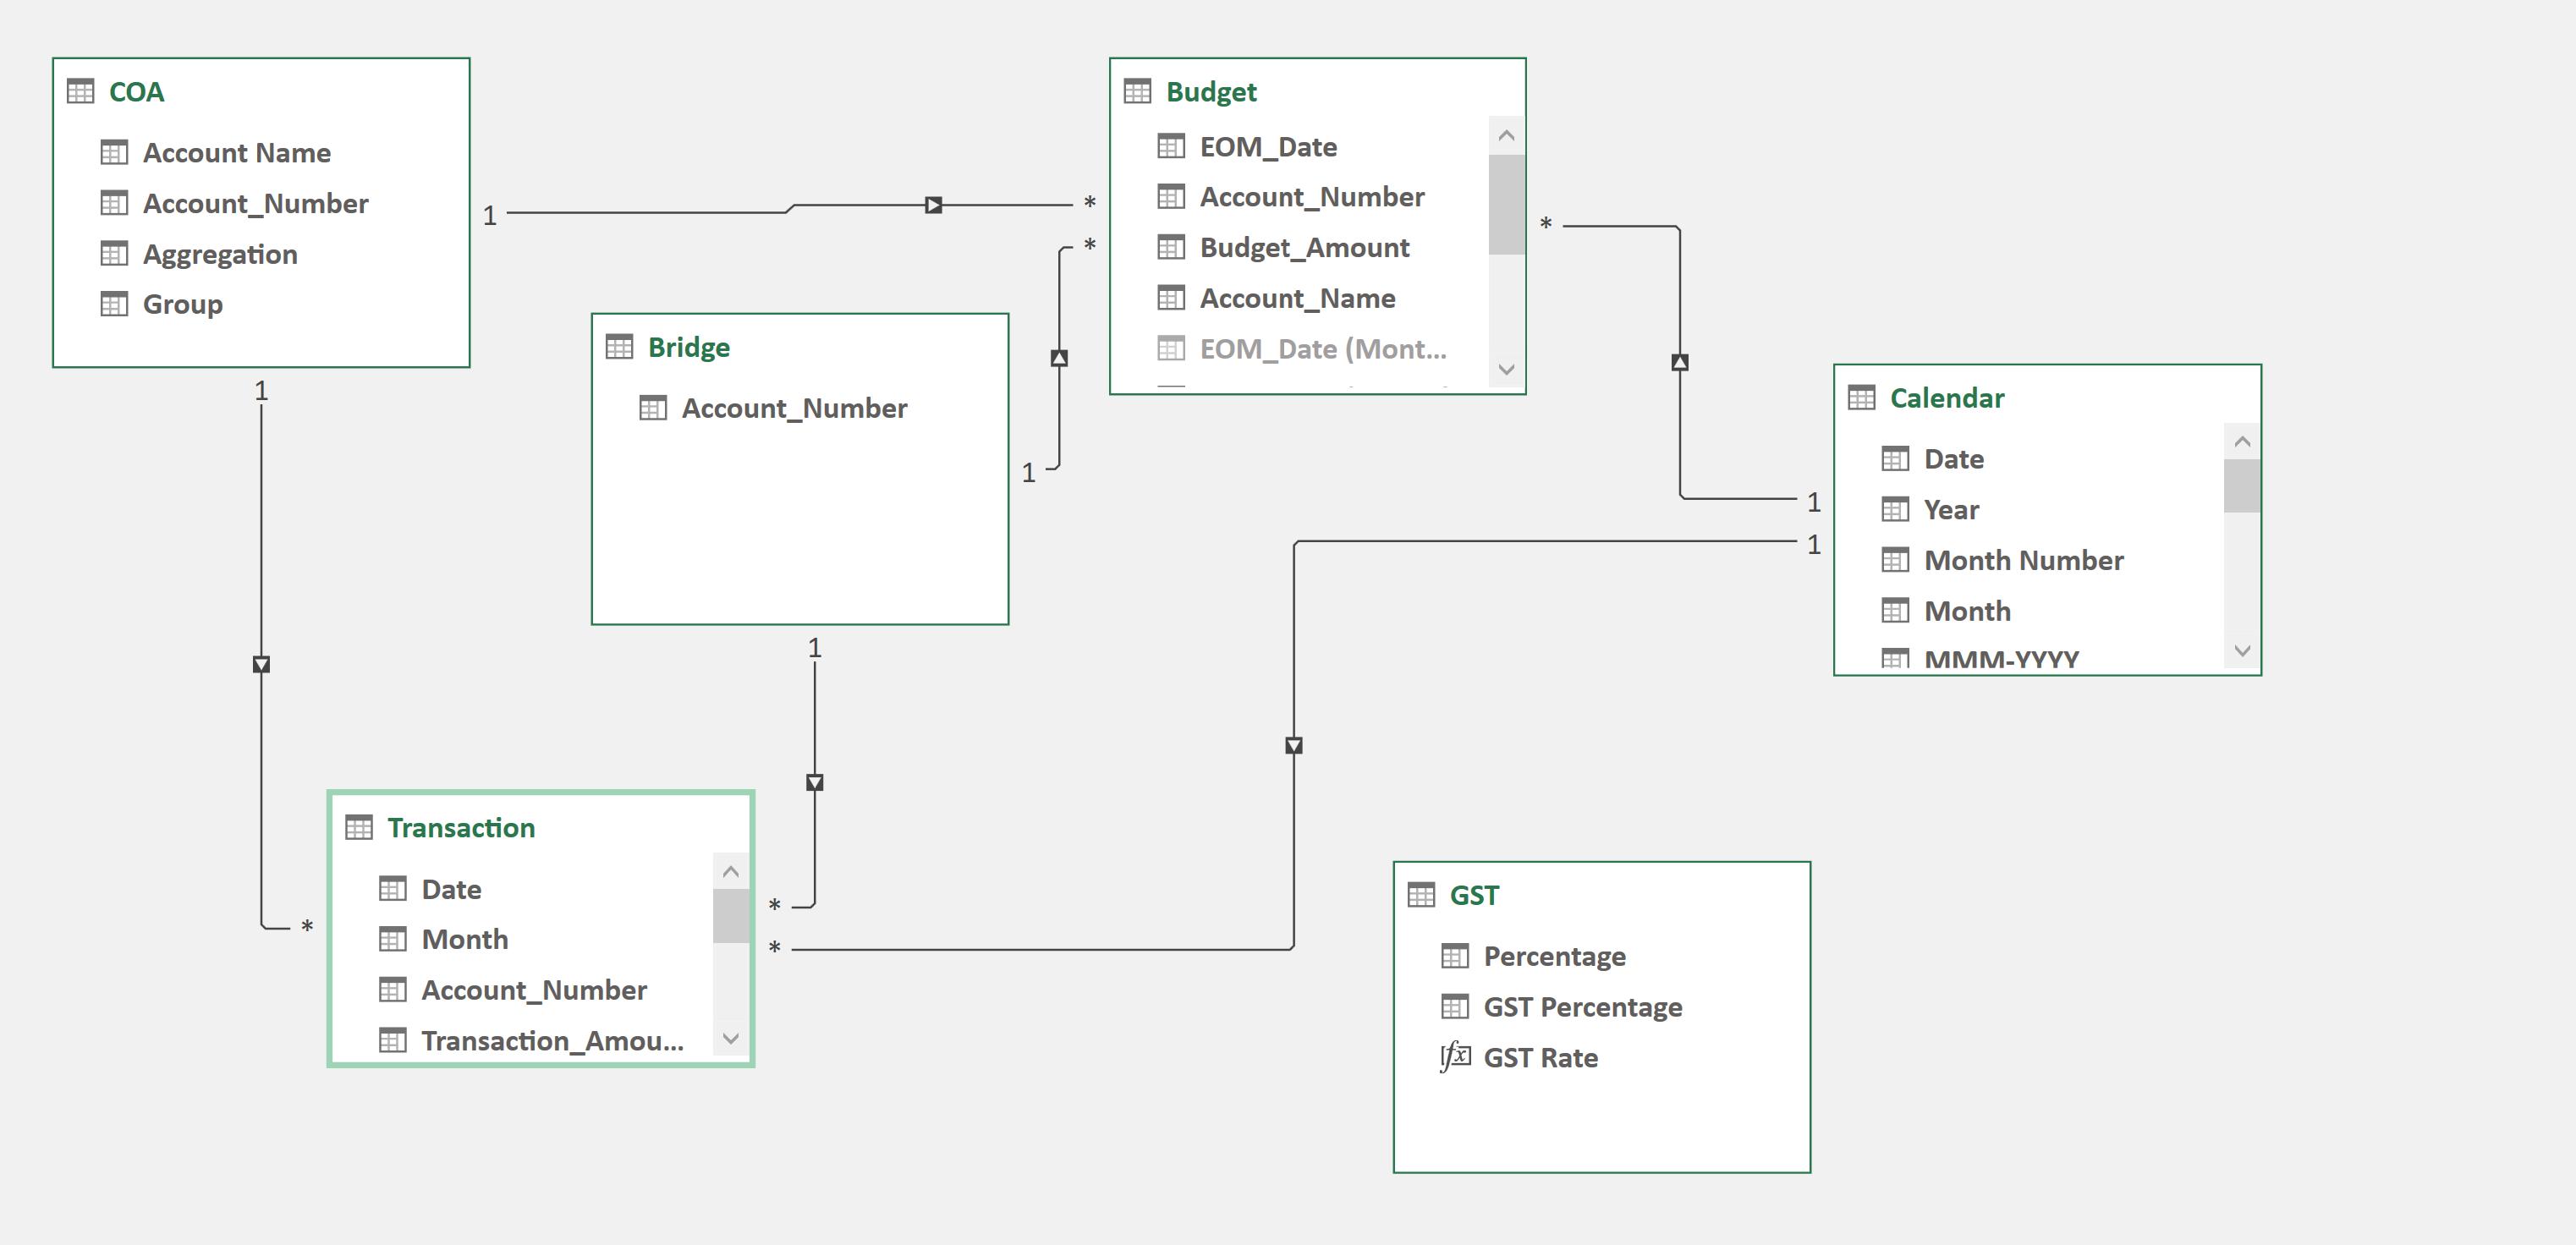
Last week, I showed you the creation of a bridging table to join two queries with non-unique values. The result from last week is shown below:
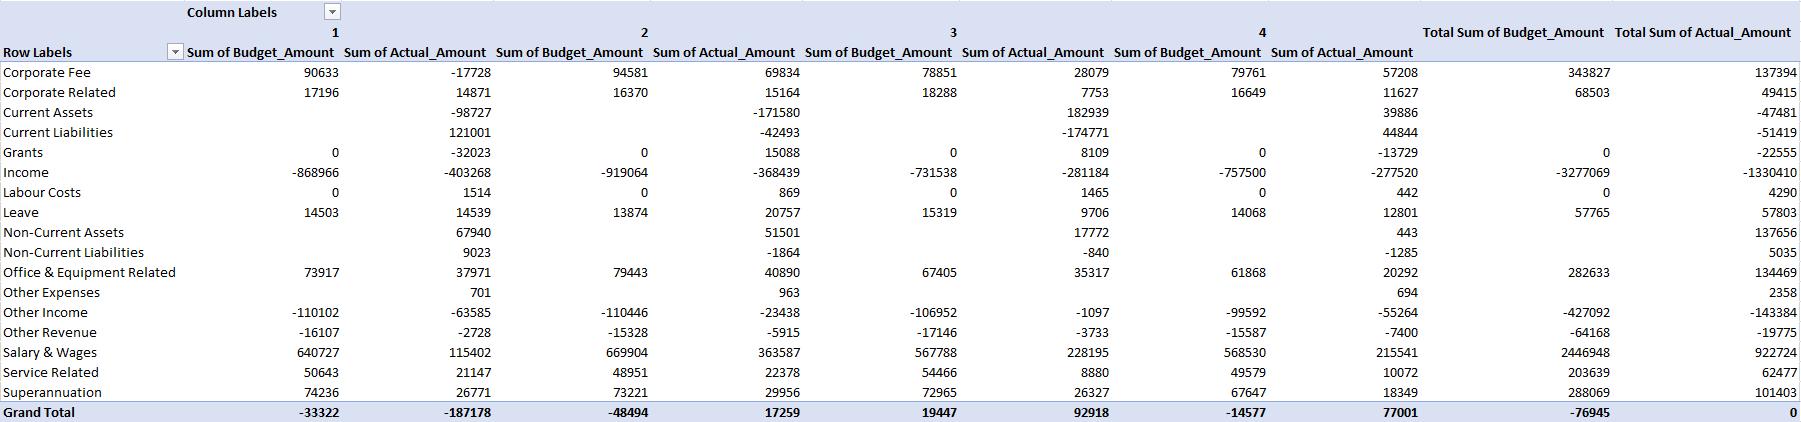
This week, I will create a slicer for the ‘Account_Number’ column, to filter selected Budget and Actuals data. The summary table currently looks like this:
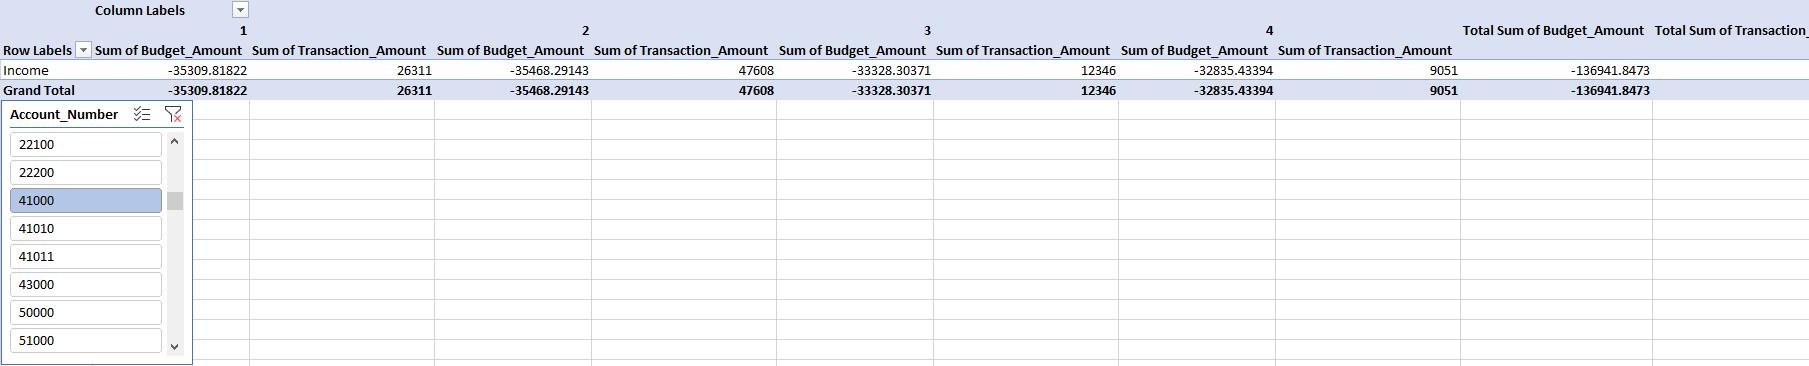
I thought it best to show you first what NOT to do. Here, I have inserted a slicer using the Budget table and then chose an ‘Account_Number’:

When I select one of the fields from the slicer, my table looks like the following:
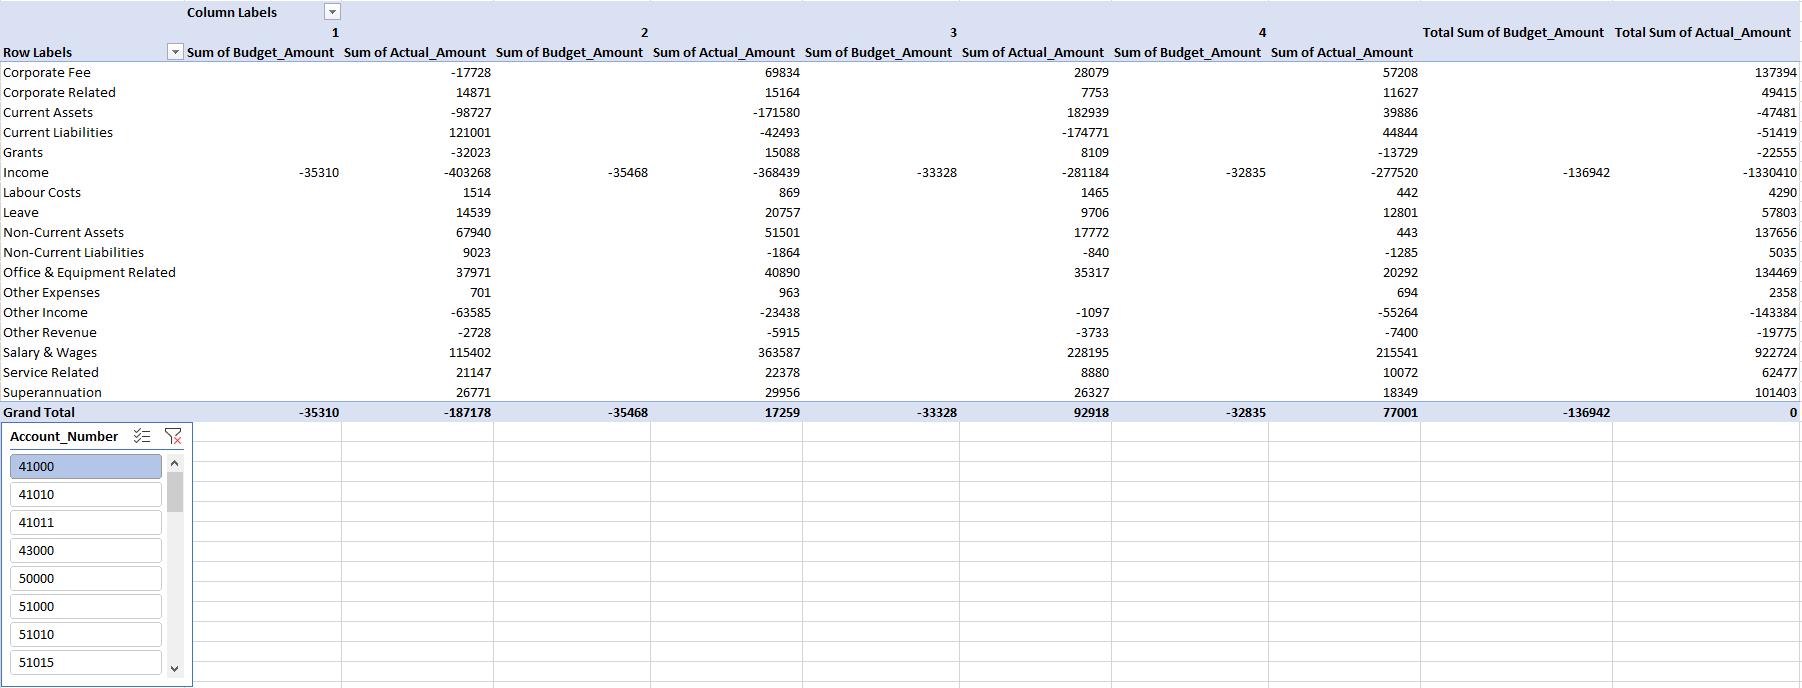
Notice how only the Budget columns are filtered! If I use the Actuals query to create my slicer, my summary table would look like this instead:
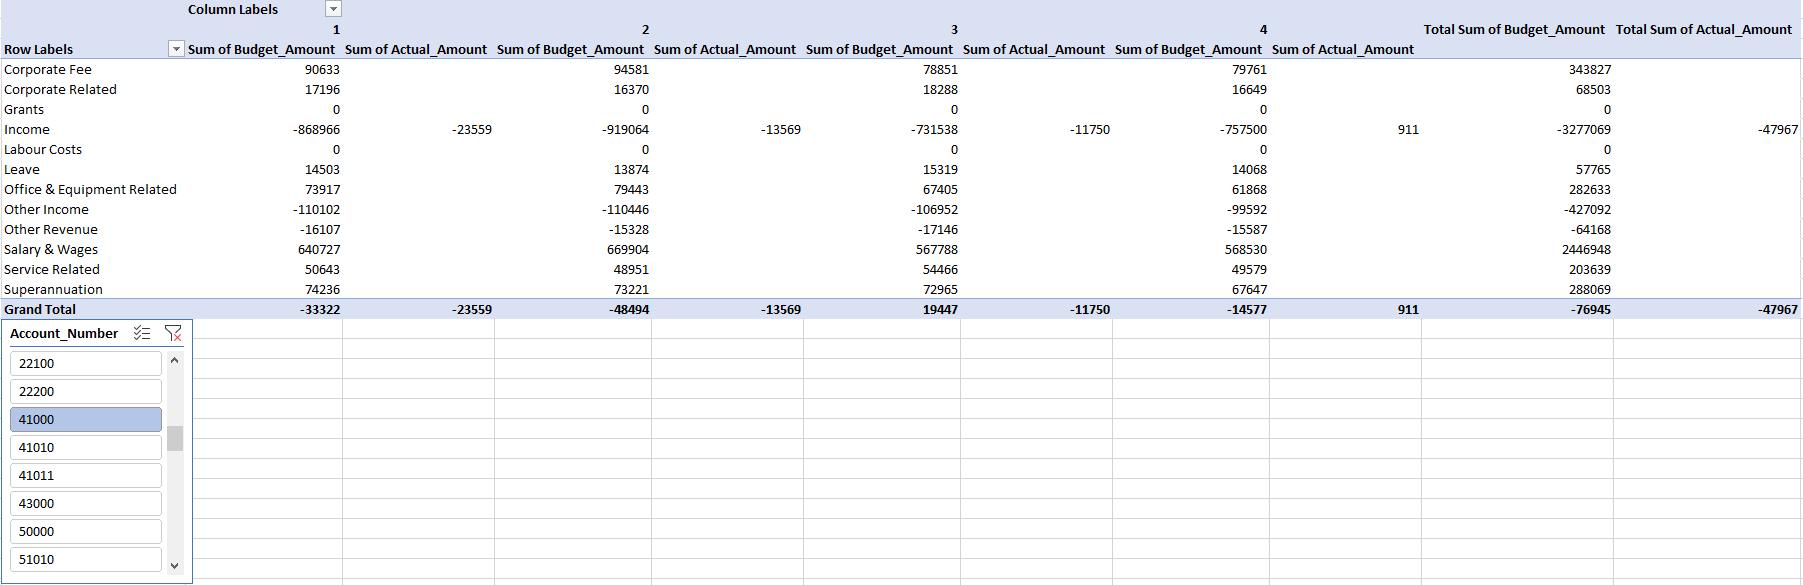
Again! But this time only the Actuals columns have been filtered. I know this seems confusing, but the solution is straightforward. In order, to filter both Budget and Actuals, my slicer needs to use the ‘Account_Number’ field only from the Bridge table created. This will then cascade filters into both dependent tables:
There it is problem solved! Notice how the Bridge has multiple uses and advantages. In a nutshell, to filter fields with non-unique values in more than one table, one must link the slicer to the bridging table only. This ensures data filtering works perfectly!
That’s it for this week!
Come back next week to see how we use the disconnected table for performing a sensitivity analysis by staying tuned for our next post on Power Pivot in the Blog section. In the meantime, please remember we have training in Power Pivot which you can find out more about here. If you wish to catch up on past articles in the meantime, you can find all of our Past Power Pivot blogs here.