Power Pivot Principles: The A to Z of DAX Functions – DATEADD
24 January 2023
In our long-established Power Pivot Principles articles, we continue our series on the A to Z of Data Analysis eXpression (DAX) functions. This week, we look at DATEADD.
The DATEADD function
The DATEADD function is a time intelligence function that returns a table containing a column of dates, shifted either forwards or backwards in time by the specified number of intervals from the dates in the current context(s). It uses the following syntax:
DATEADD(dates, number_of_intervals, interval)
There are three [3] arguments in the syntax:
- dates: this argument is required and is a column that contains dates. This can be any of the following:
- a reference to a date/time column
- a table expression that returns a single column of date/time values
- a BOOLEAN expression that defines a single-column table of date/time values
- number_of_intervals: this argument is required and is an integer that specifies the number of intervals to add or subtract from the dates. If the number_of_intervals is positive, the dates are moved forward in time, and vice versa for negative number
- interval: this argument is required, and it is the interval by which to shift the dates. The value for interval can be one of the following: YEAR, QUARTER, MONTH, or DAY.
Please have a look at the following example:

Using the above Start Dates in the Date_Table, we will demonstrate three DATEADD functions, one to add one [1] day, one to add one [1] month and one to add one [1] year:
Adding one [1] day to the dates:
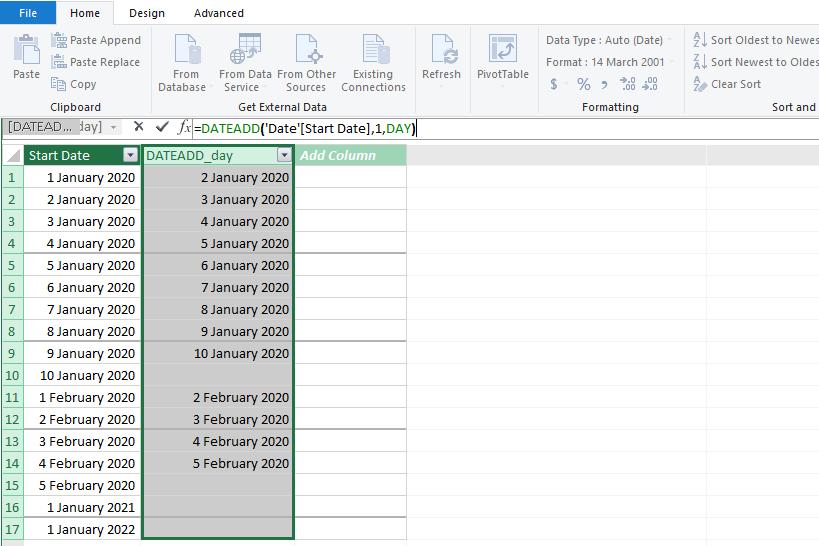
There are some empty cells on the DATEADD_day column this is because there is no data for the new date in the Start Date column. For example, we add one [1] day to 10
January 2020 which equals to 11 January 2020. Because there is no 11 January 2020 in the Start
Date column, the function returns a blank.
Adding one [1] month to the dates:
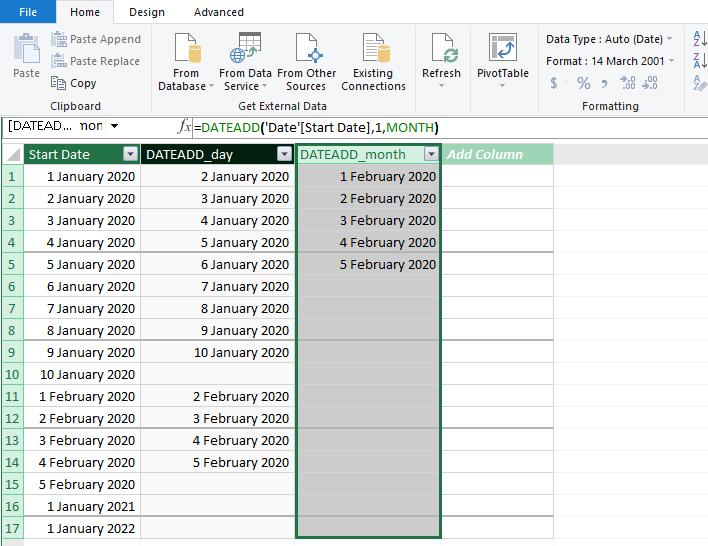
Similar to the DATEADD_day column, there are some empty cells in the DATEADD_month column. This is also because the resulting dates are not present in the Start Date column.
Adding one [1] year to the dates:
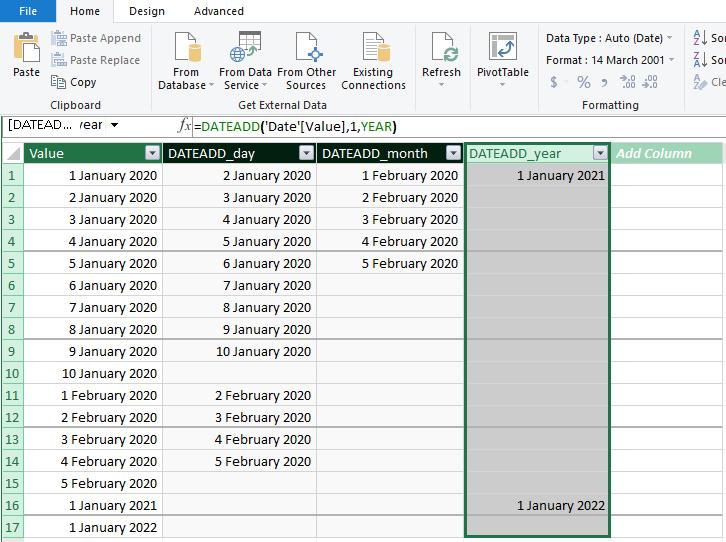
Again, there are some empty cells in the resulting column due to the results not being present in the Start Date column.
There are few key notes you should follow when using any time intelligence function:
- all dates need to be present for the years required. All the days in this span, from January 1 to December 31, must be included in the Date table. The date table must include all dates from commencement to the last day of a fiscal year if the report solely refers to fiscal years
- a column with a DateTime or Date data type and unique values is required. Typically, this column is known as Date. Although it's common practice, this is not necessary when defining associations with other tables. However, the ‘mark as Date Table’ feature should relate to the Date column, which must have distinct values
- the Date table must be designated as a date table in the model in case the relationship between the Date table and any other table is not dependent on the Date.
Now let’s start with a new example where we have the following Date_Table, containing dates ranging from 1 January 2020 to 1 January 2023:
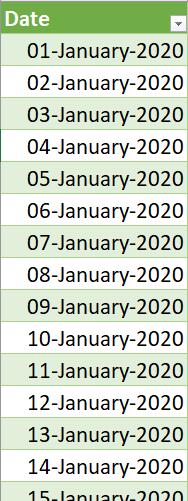
Firstly, we declare in our query code our StartDate and EndDate which will be 1 May 2021 and 10 May 2021 respectively in this example:
EVALUATE
VAR StartDate = DATE ( 2021, 05, 1 )
VAR EndDate = DATE ( 2021, 05, 10 )
RETURN
{StartDate,EndDate}
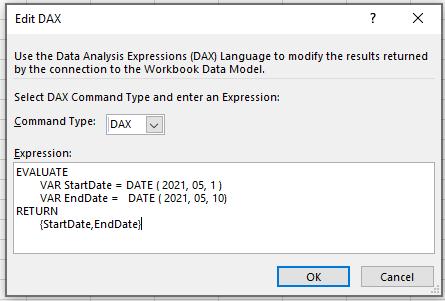

Then we will add some query code to the original code to get the date one year later:
EVALUATE
VAR StartDate = DATE ( 2021, 05, 1 )
VAR EndDate = DATE ( 2021, 05, 10)
RETURN
CALCULATETABLE (
DATEADD ( Date_Table[Date], 1, YEAR ),
Date_Table[Date] >= StartDate &&
Date_Table[Date] <= EndDate
)
ORDER BY [Date]
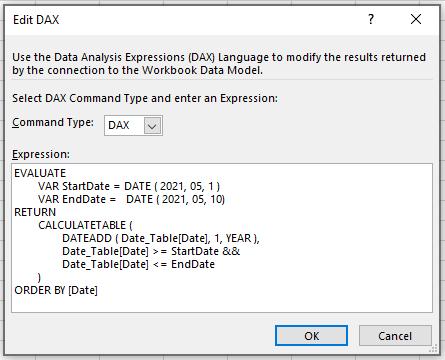
This code will allow us to see the dates one year after all dates between our StartDate and EndDate (From 1 May 2021 to 10 May 2021). The result will be as follows:
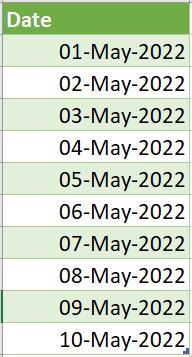
As we can see from the table above, one year has been added to each date in our date range. We can continue to test this function with negative values to subtract using the following DAX code:
EVALUATE
VAR StartDate = DATE ( 2021, 05, 1 )
VAR EndDate = DATE ( 2021, 05, 10)
RETURN
CALCULATETABLE (
DATEADD ( Date_Table[Date], -5.5, MONTH ),
Date_Table[Date] >= StartDate &&
Date_Table[Date] <= EndDate
)
ORDER BY [Date]
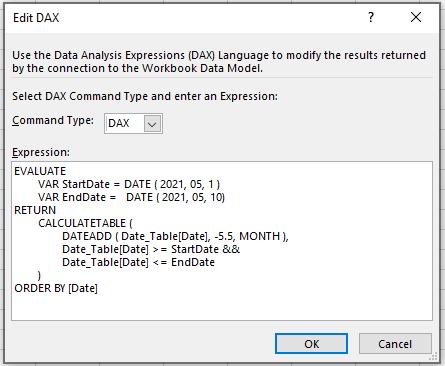
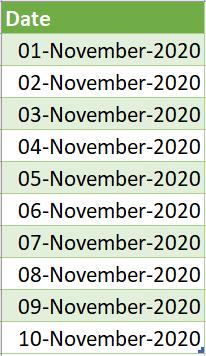
As we put -5.5 in the number_of_intervals the DATEADD function will automatically round the number to negative six [6] (if the tenths of the number are less than five [5] they will be rounded down to zero [0] and vice versa) and produce the following result:
Besides that, you can also nest the DATEADD function within itself to add or subtract DAY, MONTH, QUARTER and YEAR at the same time. Consider the following DAX code:
EVALUATE
VAR StartDate = DATE ( 2021, 05, 1 )
VAR EndDate = DATE ( 2021, 05, 10)
RETURN
CALCULATETABLE (
DATEADD(
DATEADD(
DATEADD(
DATEADD(
Date_Table[Date],
10, DAY ),
-2,MONTH),
2,QUARTER),
-1,YEAR),
Date_Table[Date] >= StartDate &&
Date_Table[Date] <= EndDate
)
ORDER BY [Date]
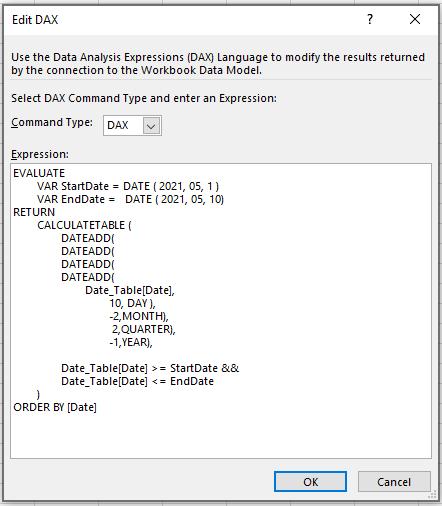
which will give you the following dates:
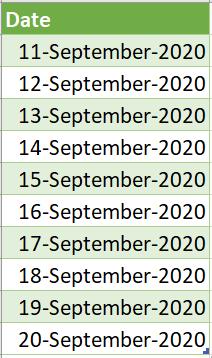
This is the result after adding ten [10] days, subtracting two months [-2], adding two quarters [+2], and subtracting one year [-1] to the range between StartDate and EndDate.
Come back next week for our next post on Power Pivot in the Blog section. In the meantime, please remember we have training in Power Pivot which you can find out more about here. If you wish to catch up on past articles in the meantime, you can find all of our Past Power Pivot blogs here.

