
Power Query: Grouping to the Max
25 September 2019
Welcome to our Power Query blog. Today, I look at groups and how to interrogate them.
I have some financial information which I plan to group:
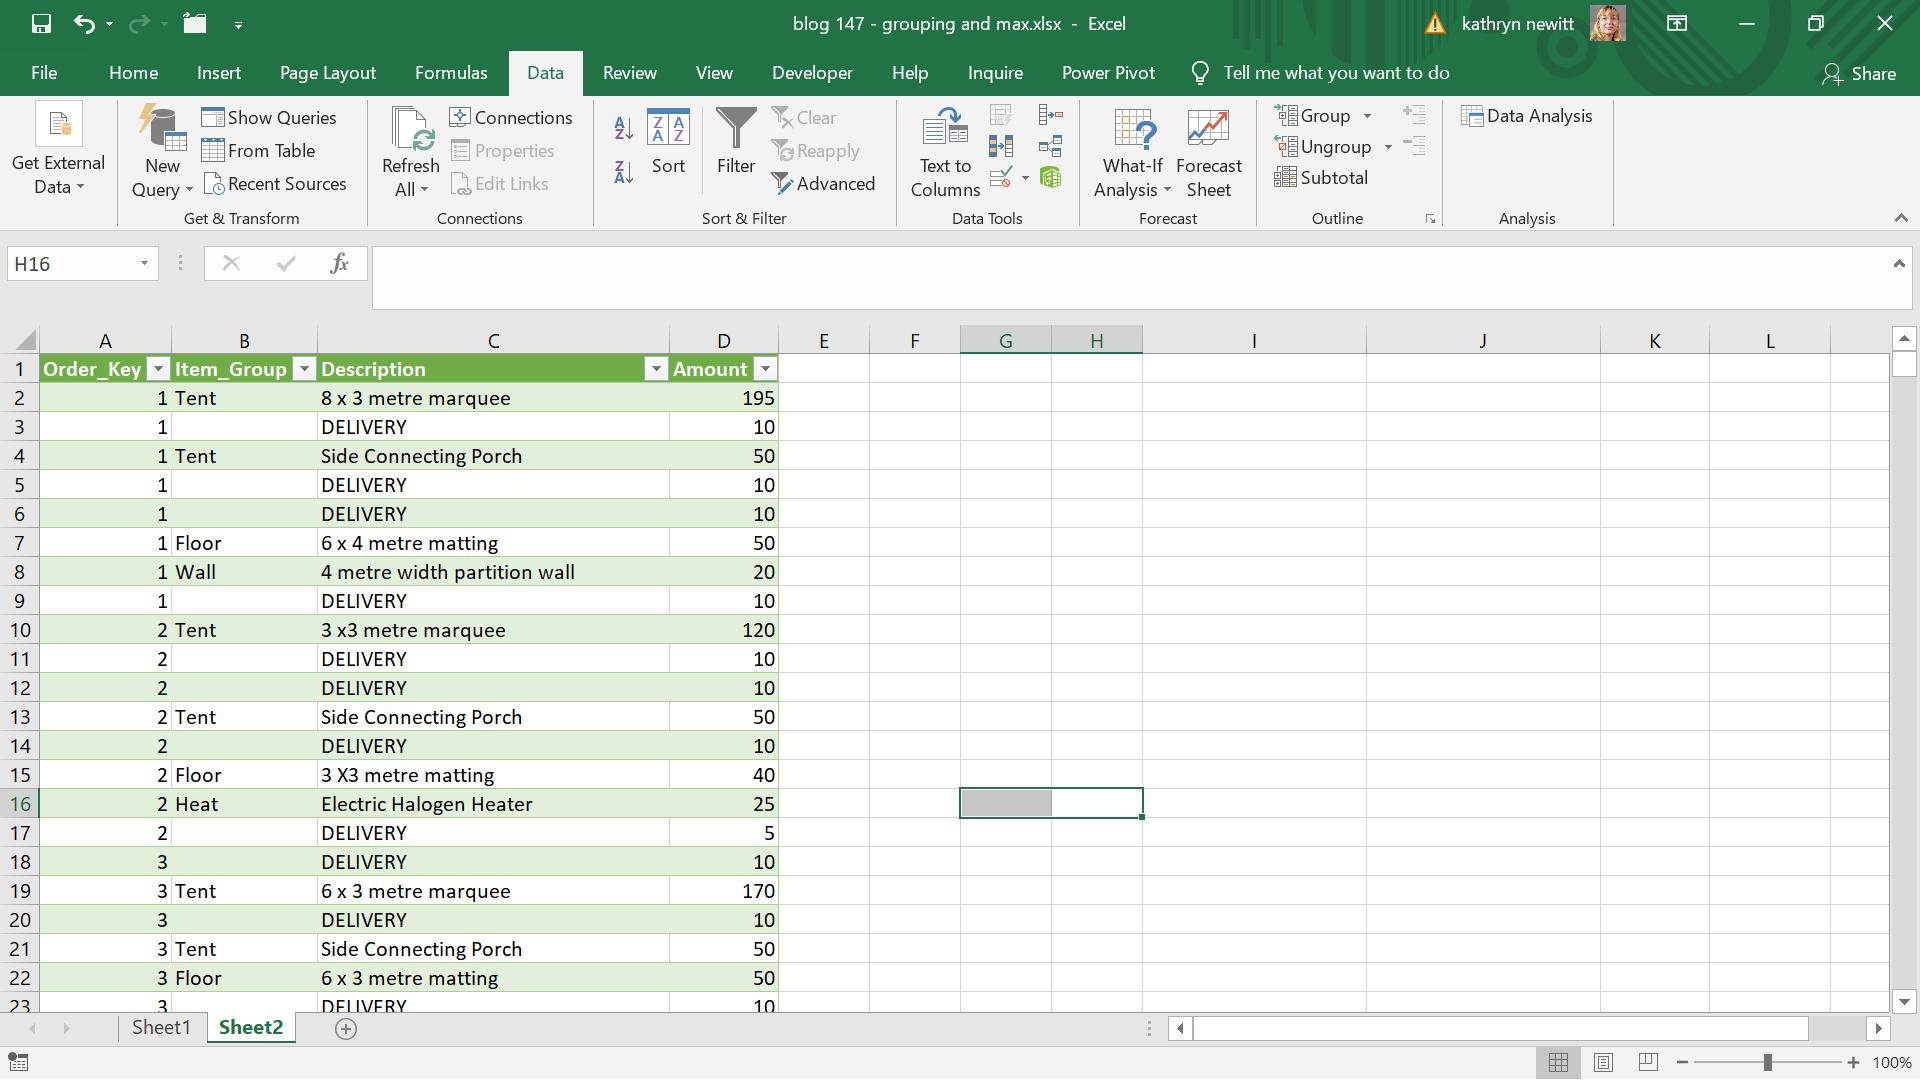
I want to summarise this information by item group. To do this, I can create a query using ‘From Table’ from the ‘Get & Transform’ section of the ‘Data’ tab.
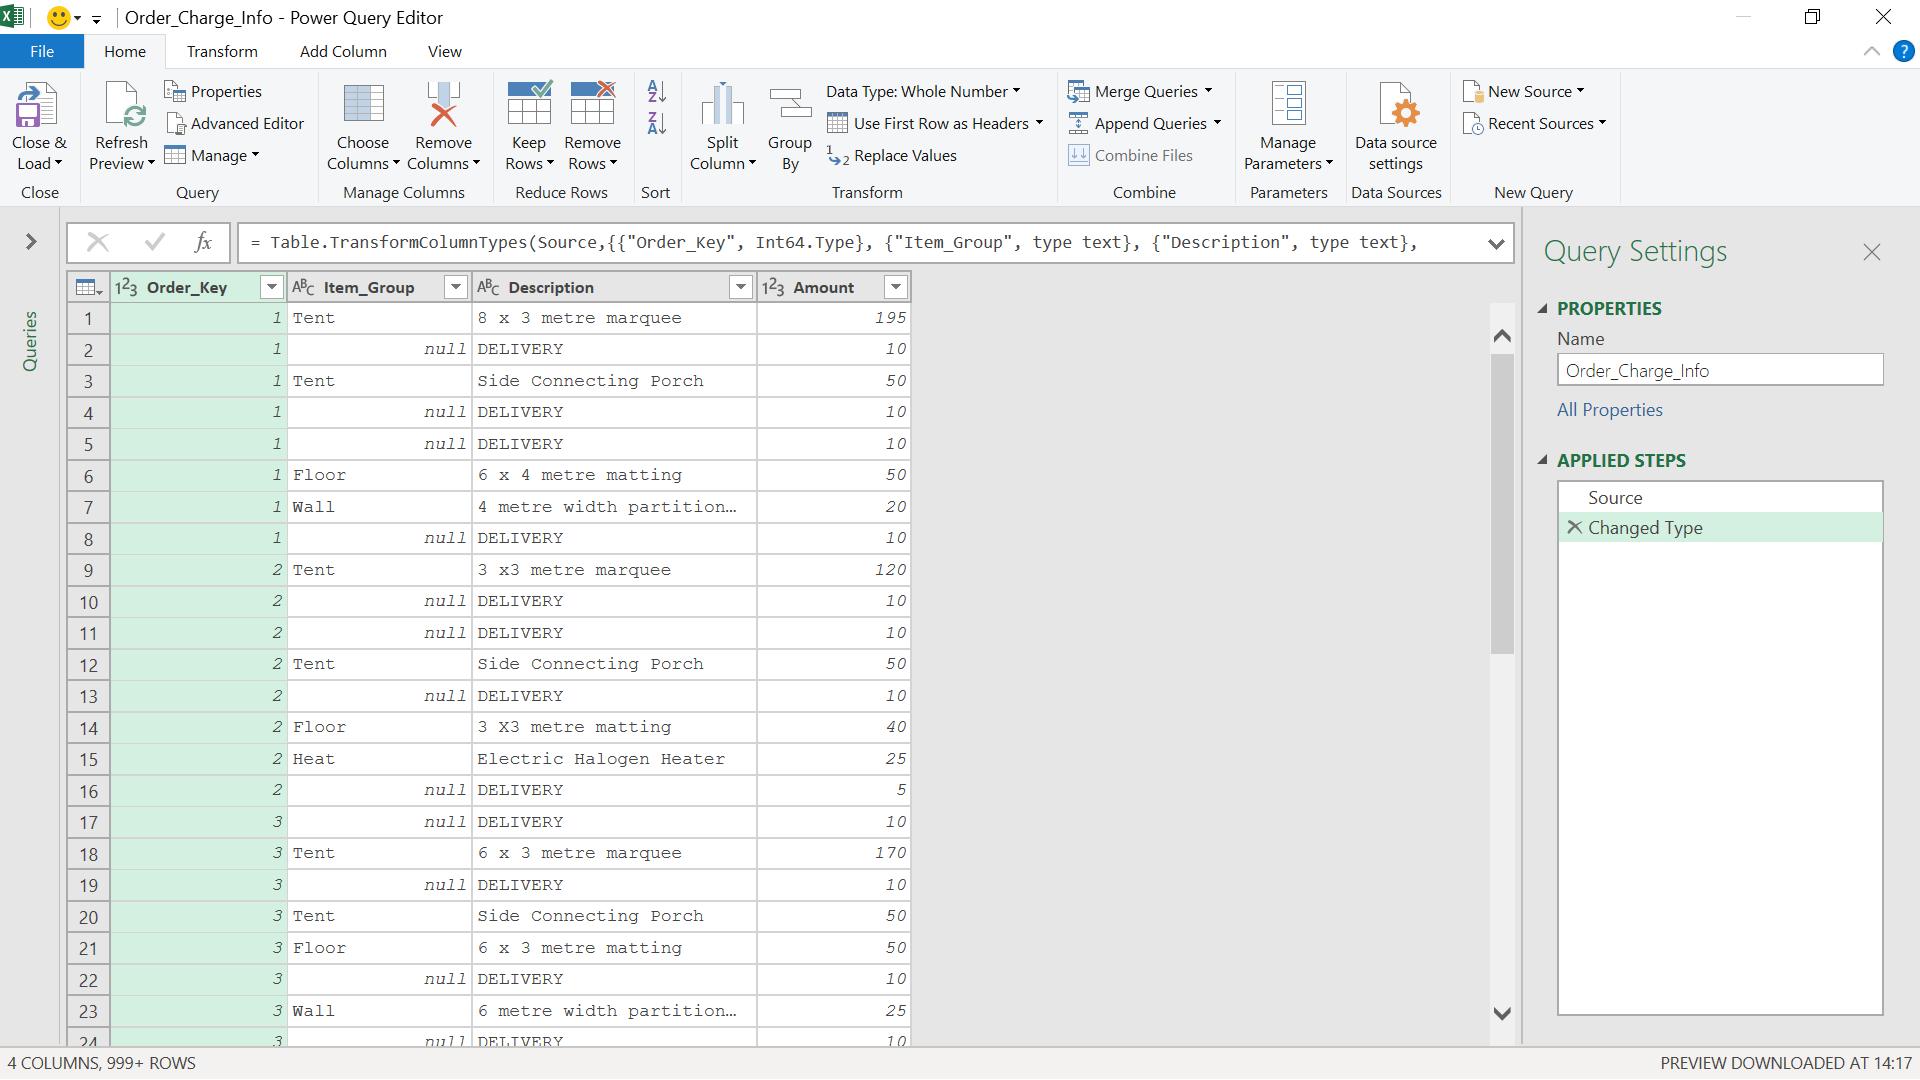
In order to summarise my data, I use the ‘Group by’ option, which is on both the ‘Home’ and ‘Transform’ tabs.
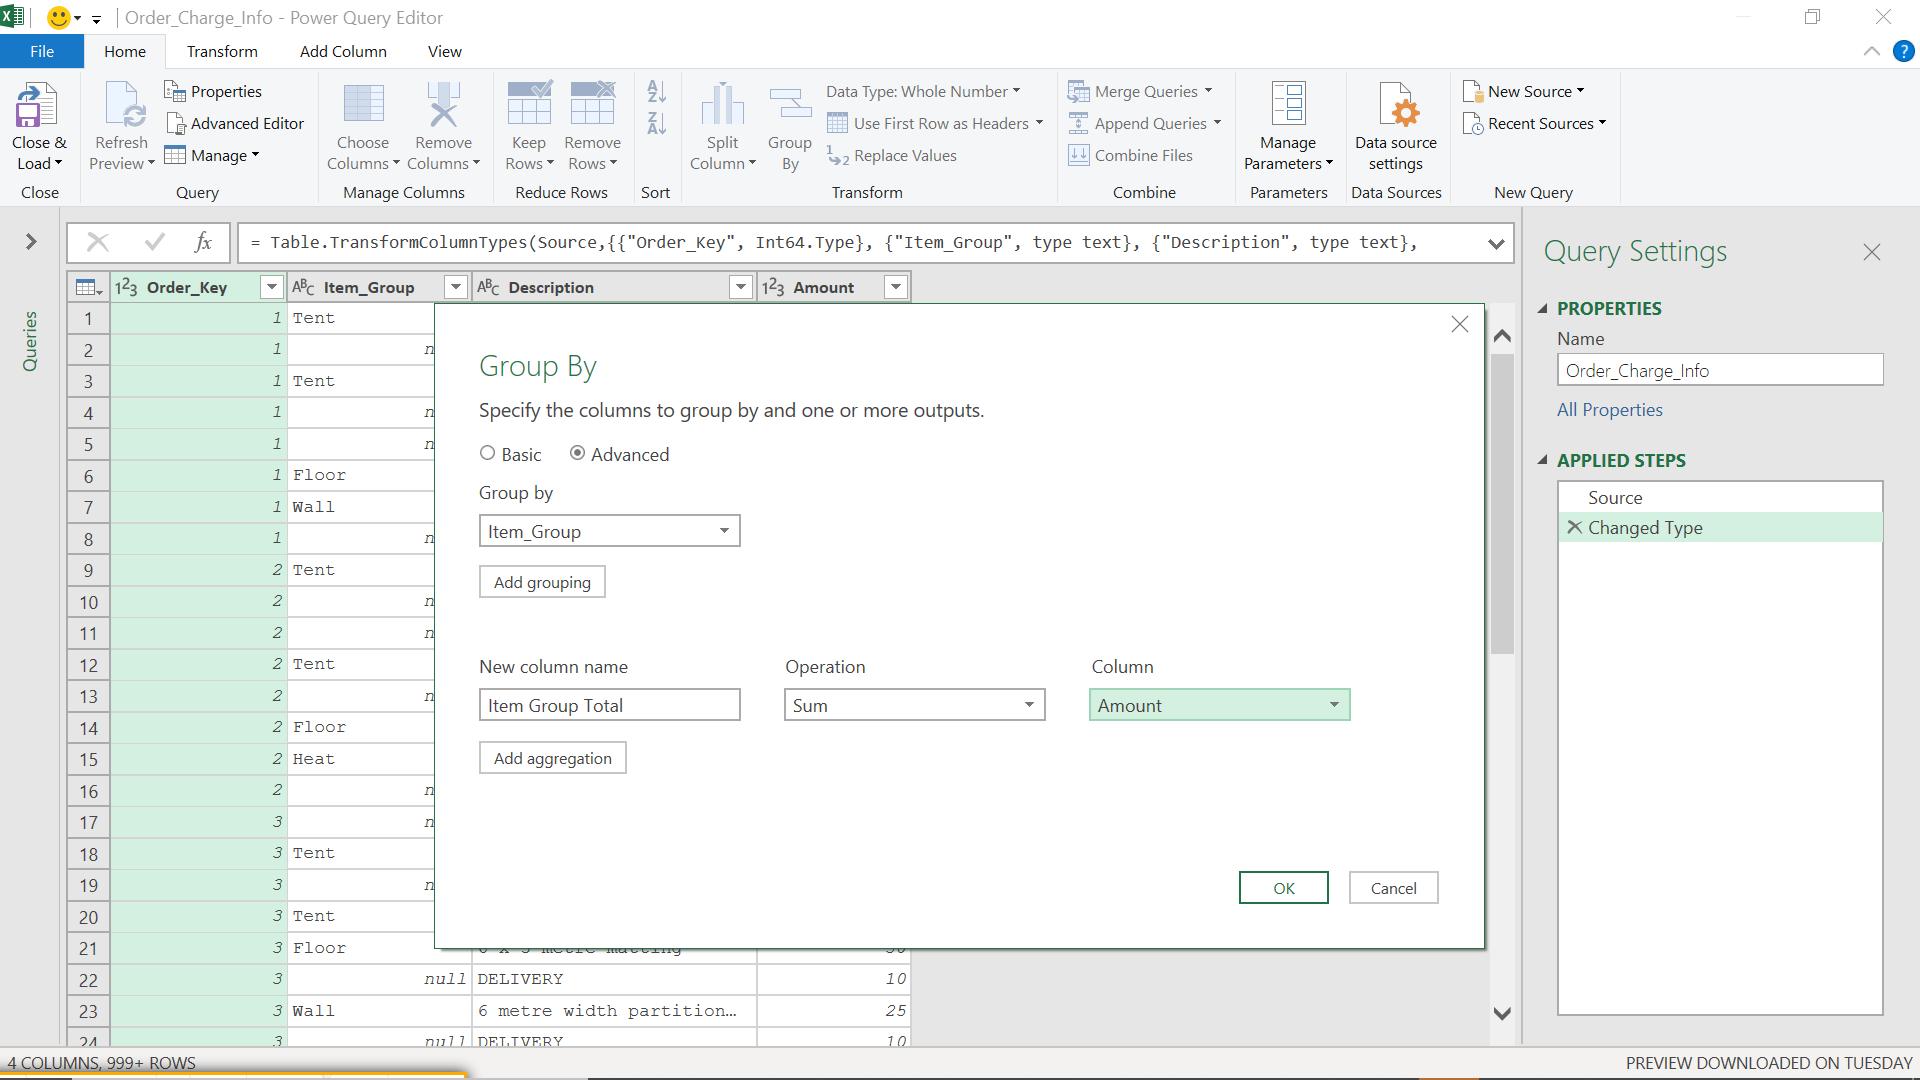
I use the ‘Advanced’ option as I am going to add together two aggregations.
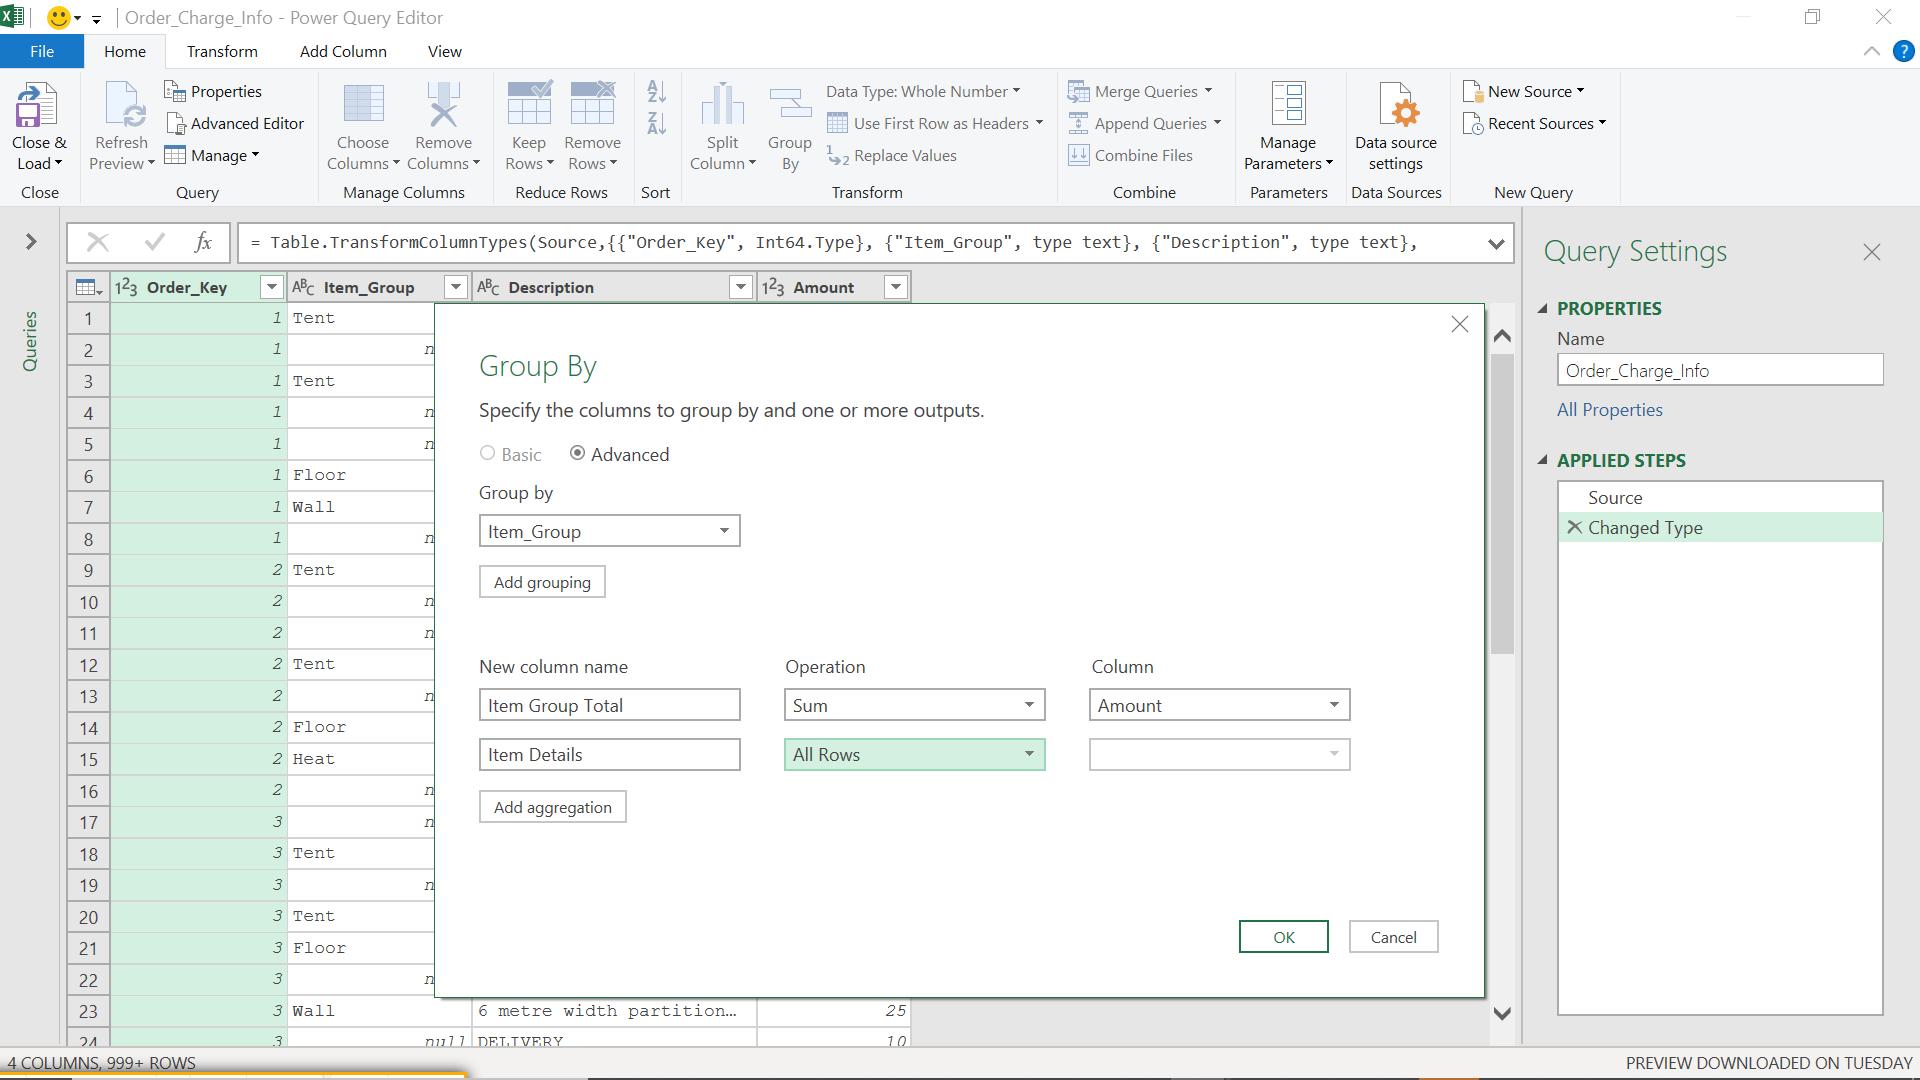
This gives me two new columns and far less rows!
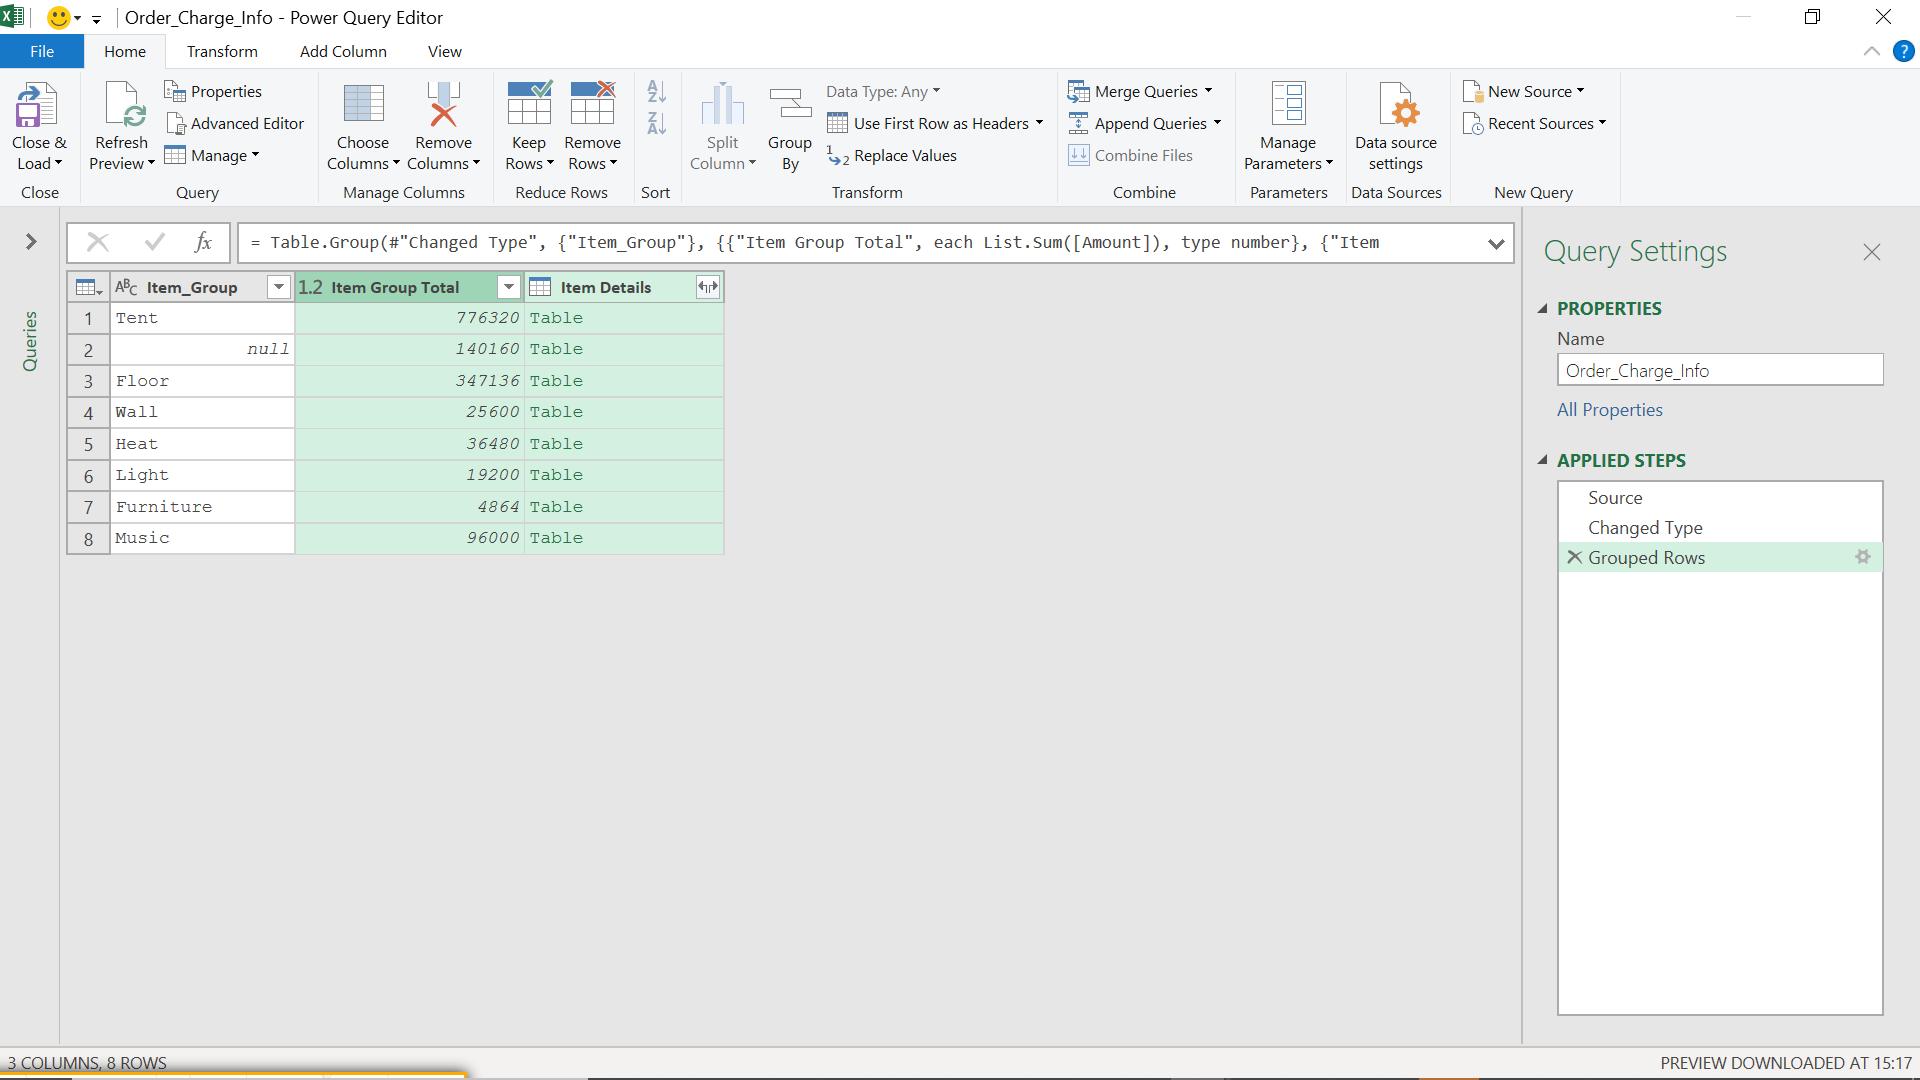
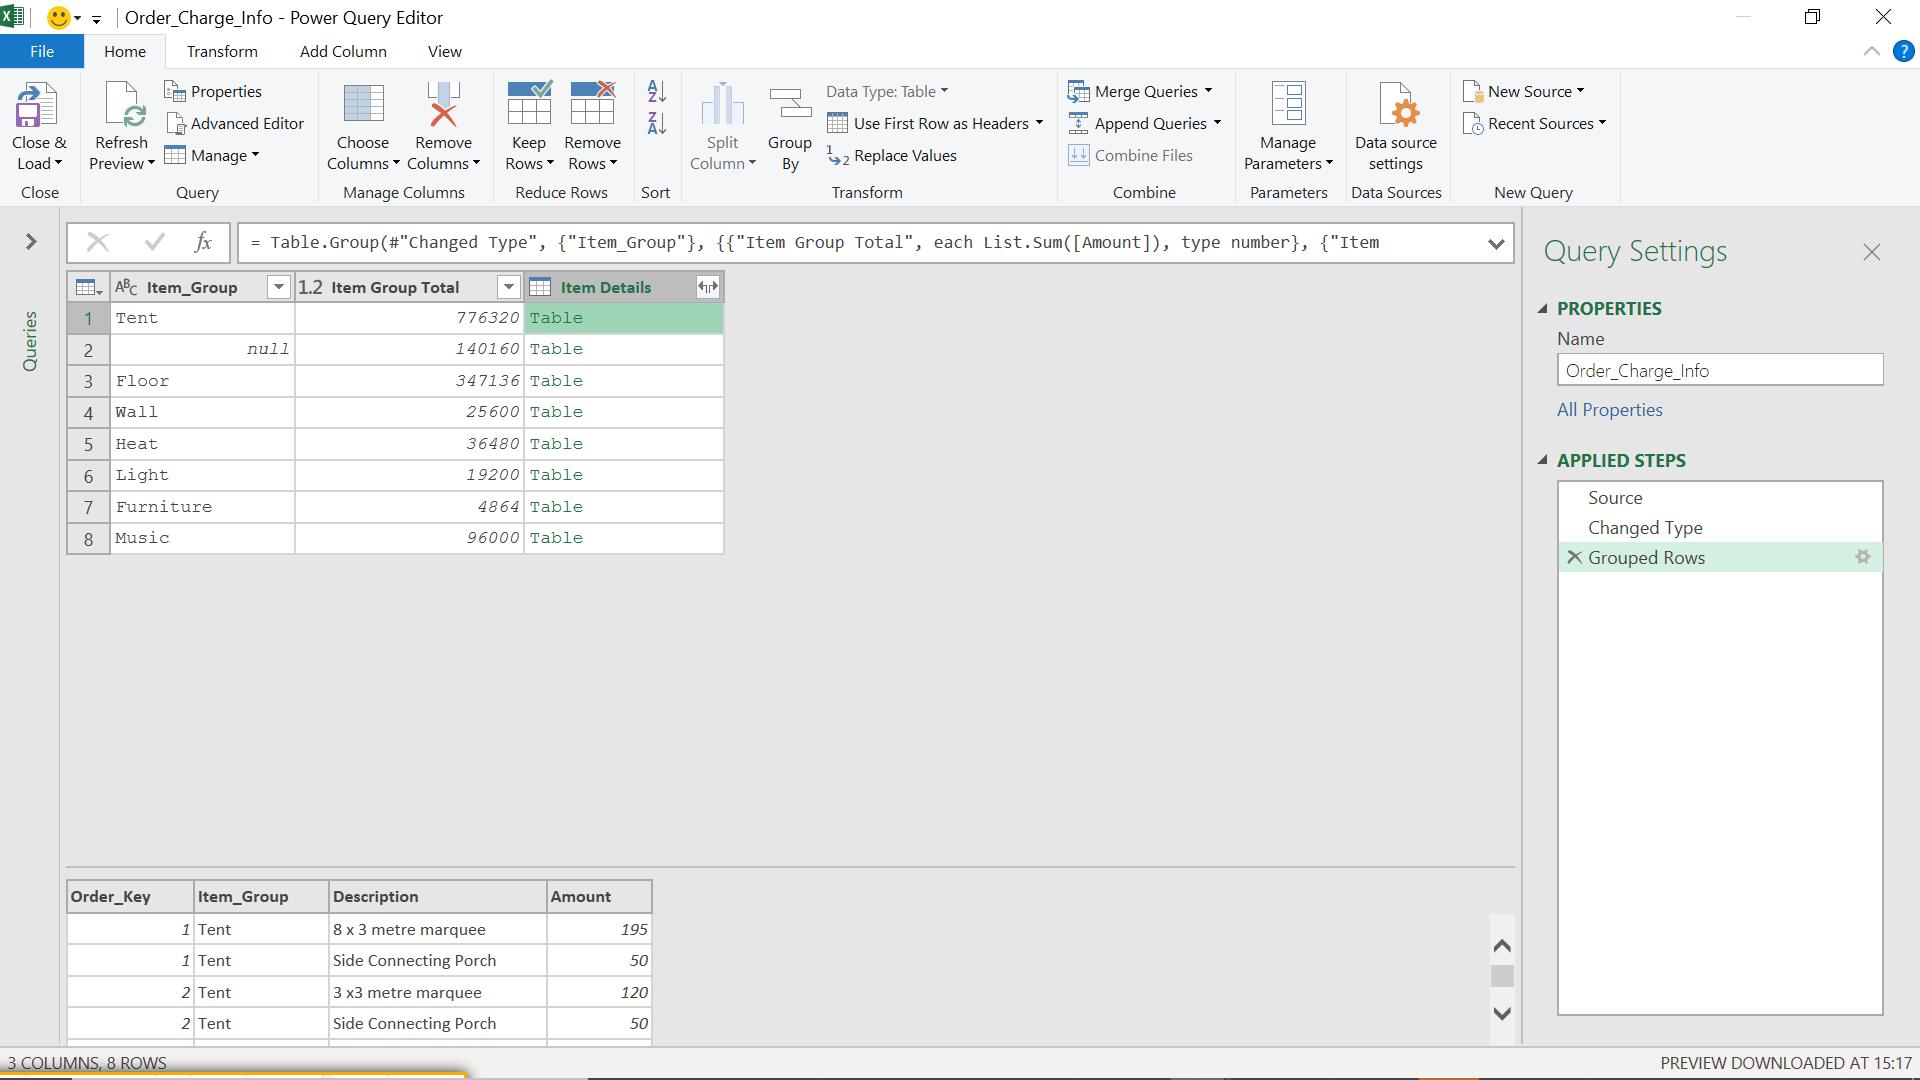
If I click on the icon next to the Item Details column, I can expand the details behind the grouping. I can also click on the white space next to each ‘Table’ to view the contents.
This is one way to see the data behind the grouping; another method is to use the M function Table.Max():
Table.Max(table as table, comparisonCriteria as any, optional default as any) as any
This returns the largest row in the table, given the comparisonCriteria. If the table is empty, the optional default value is returned.
I decide to find out which is the most expensive item in each group. The table that I will use for the Table.Max() functionality is my Item_Details column. I create a custom column from the ‘Add Column’ tab.
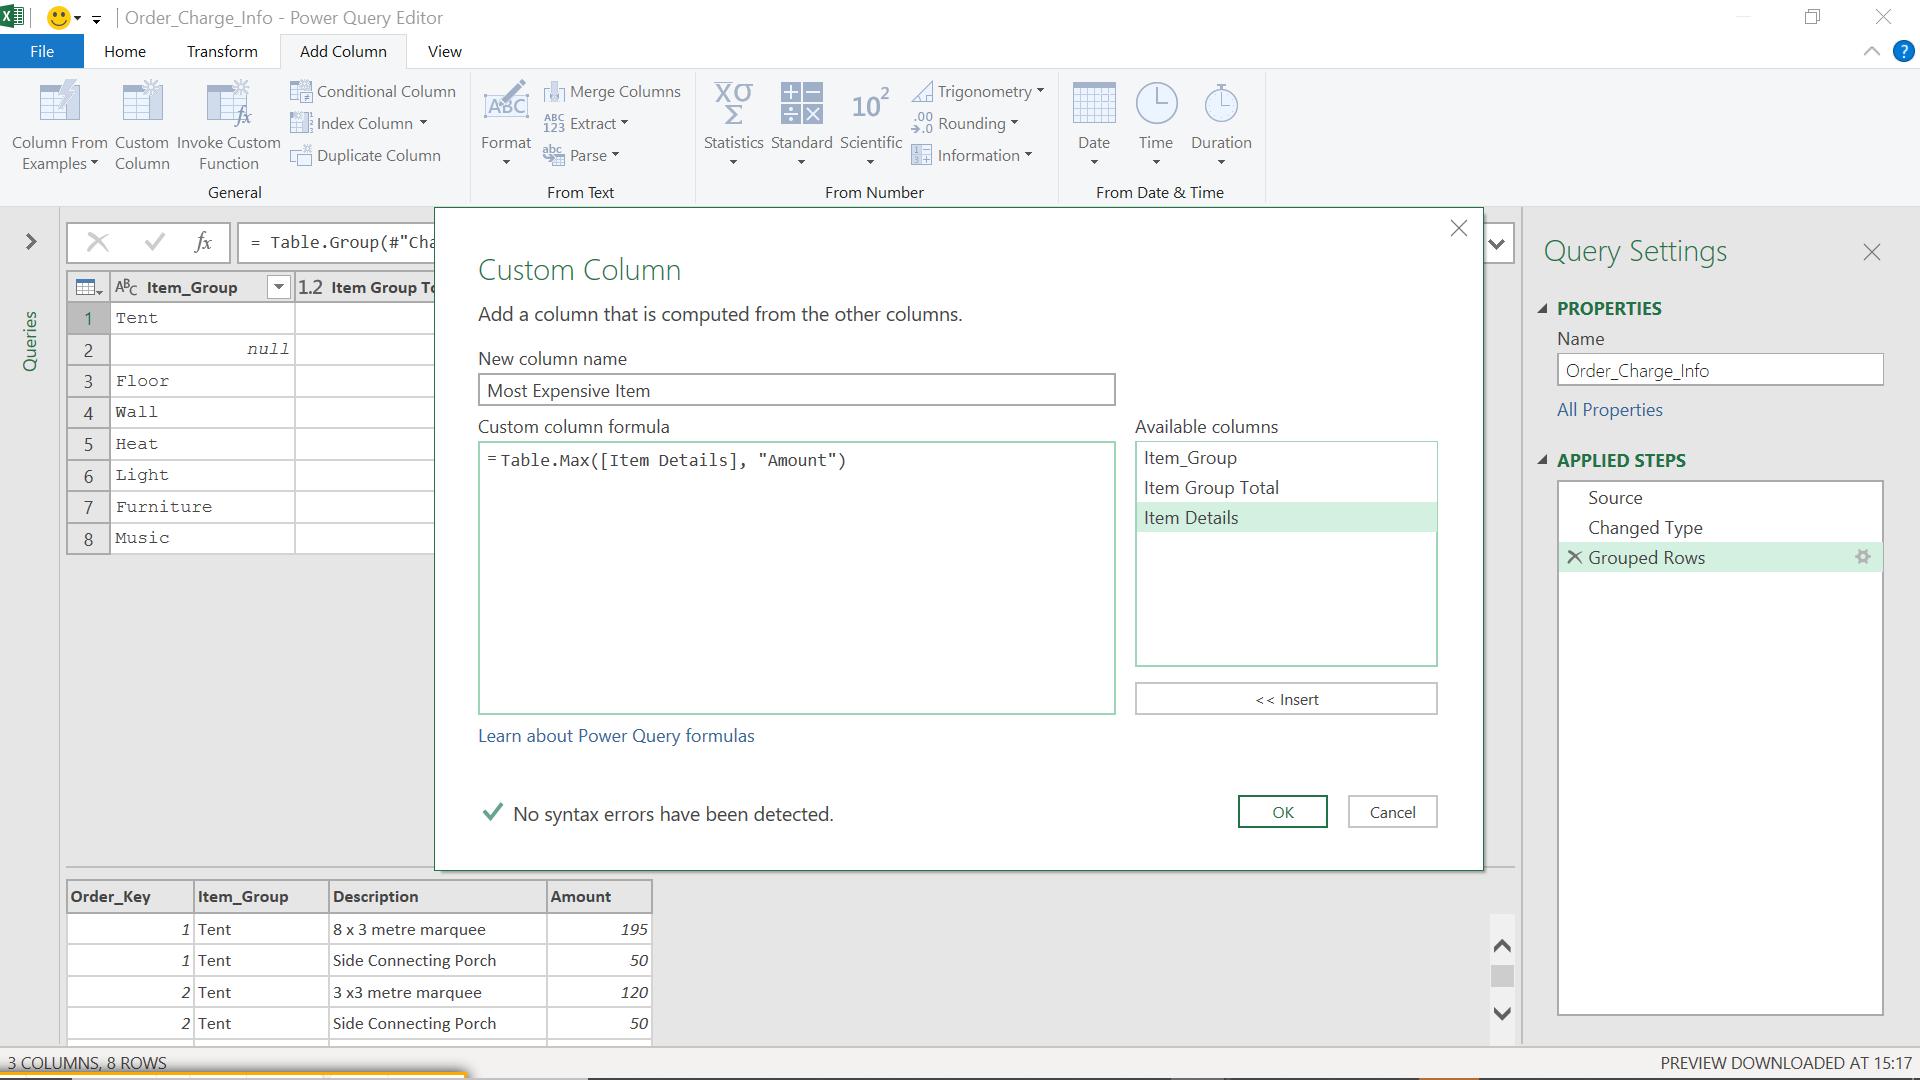
The M code I have entered is:
= Table.Max([Item Details], “Amount”)
This will allow me to find the item in each group with the highest value (Amount). The function returns a record containing the details for the most expensive item. Executing this code creates a new column of records.
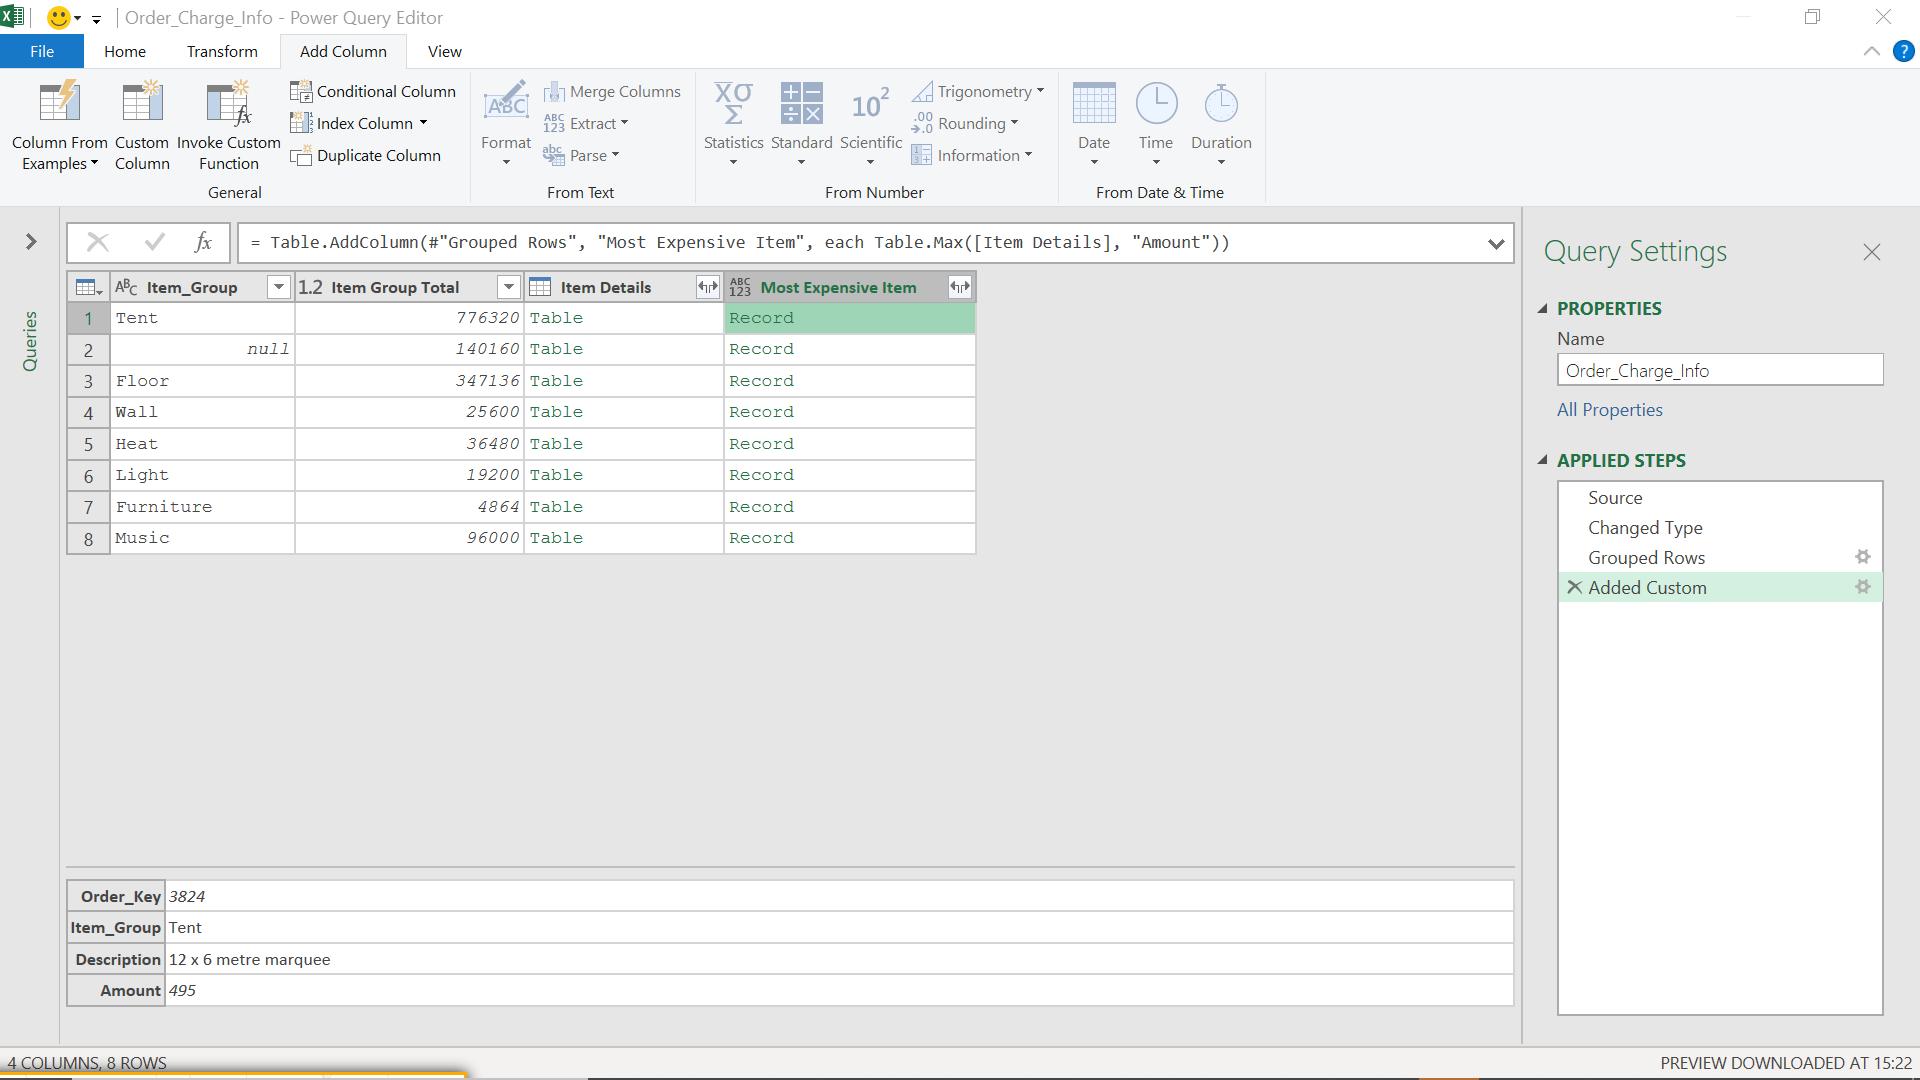
I can view the data for each row by clicking on the white space next to ‘Record’, as shown in the previous screenshot. I can also expand the new column to extract the data I want to see:
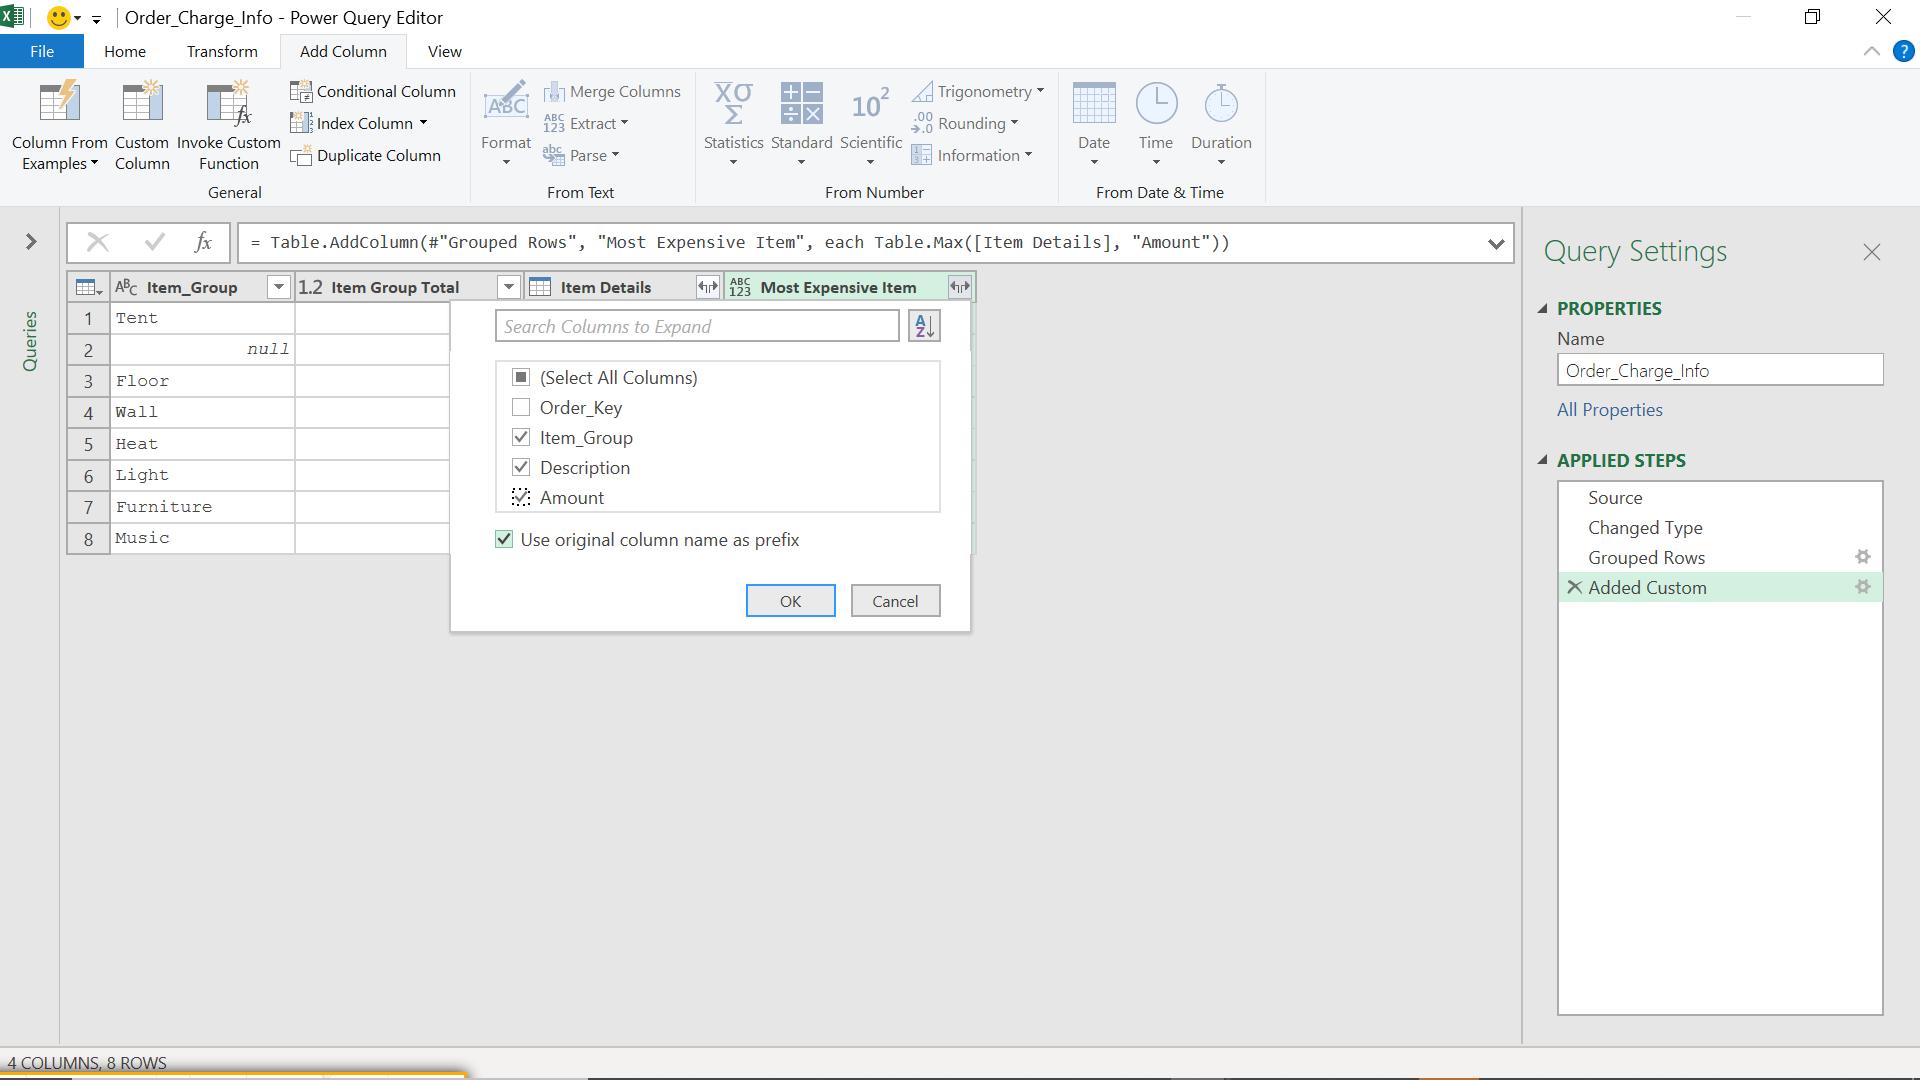
I choose the data I wish to show. In order to prove that this data is from the correct item group, I will expand the item group too, and keep the original column name, so that I may compare my original and expanded columns.
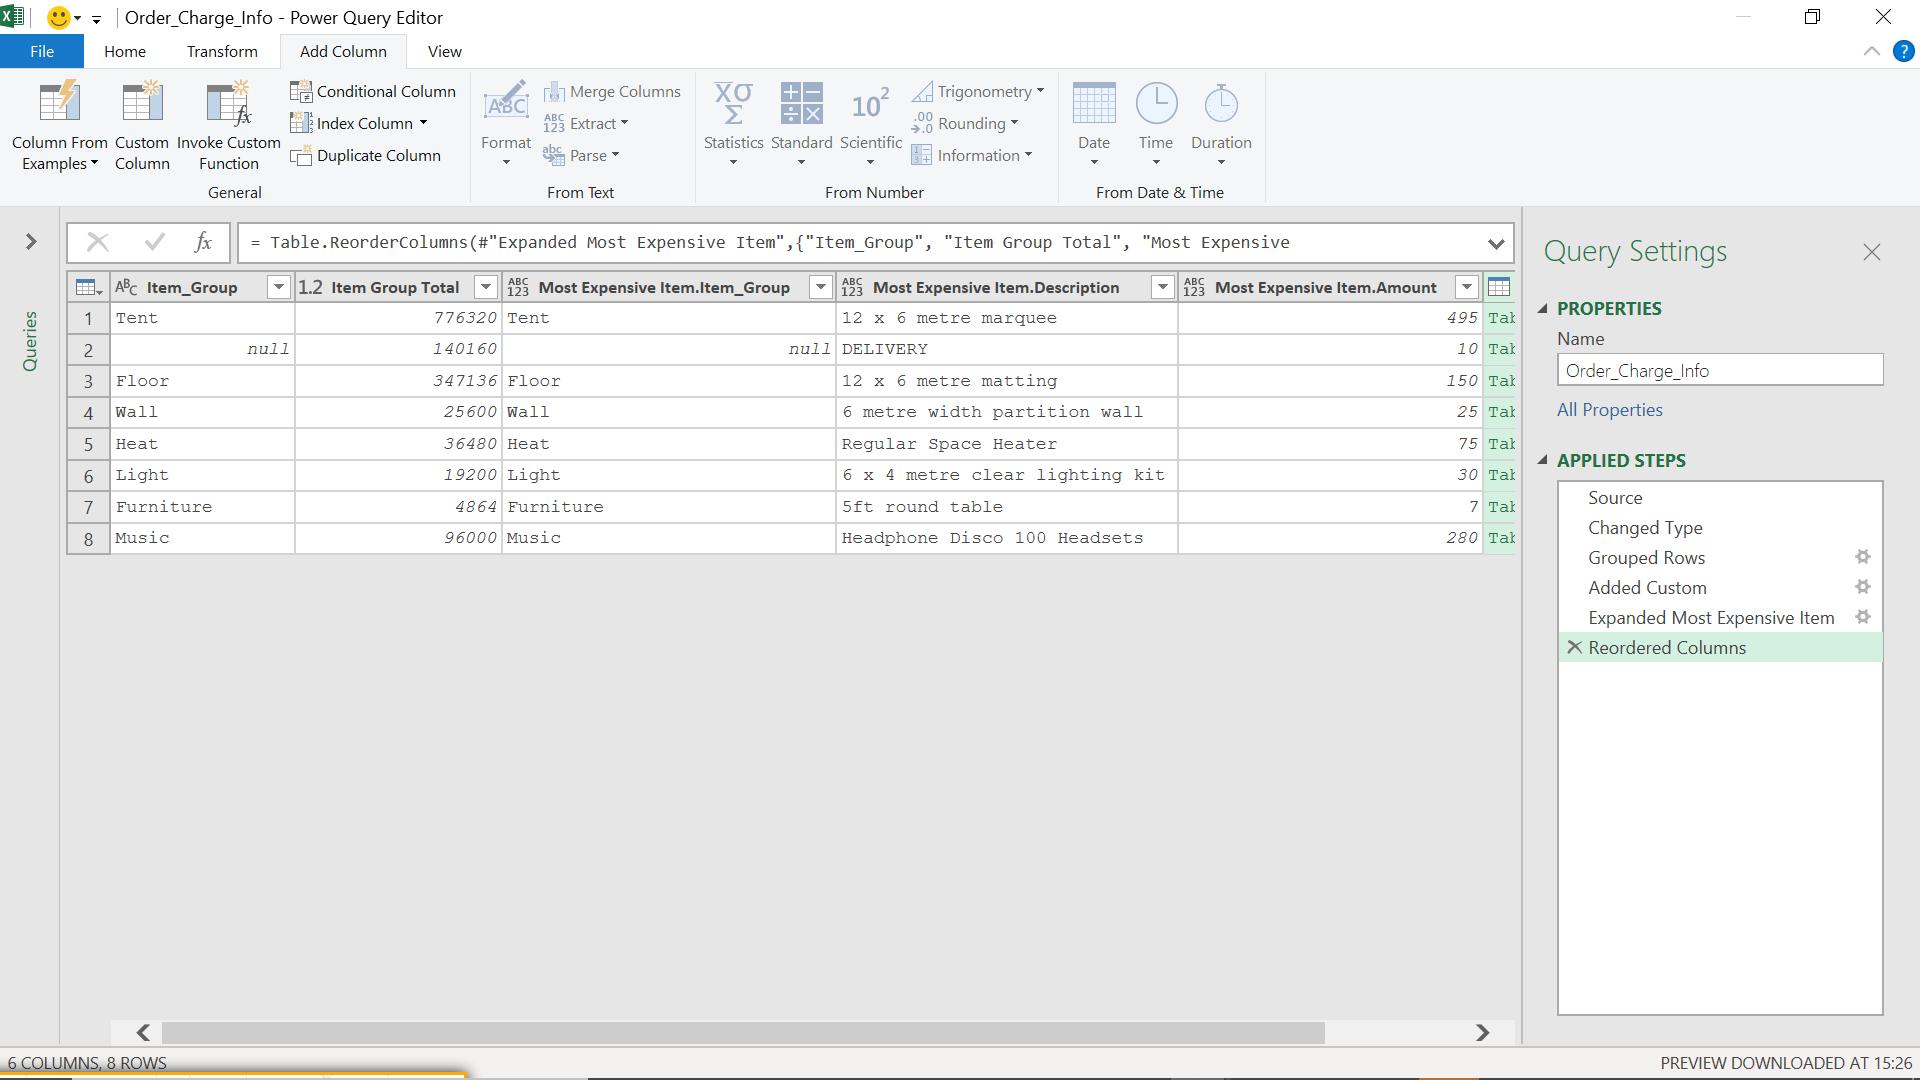
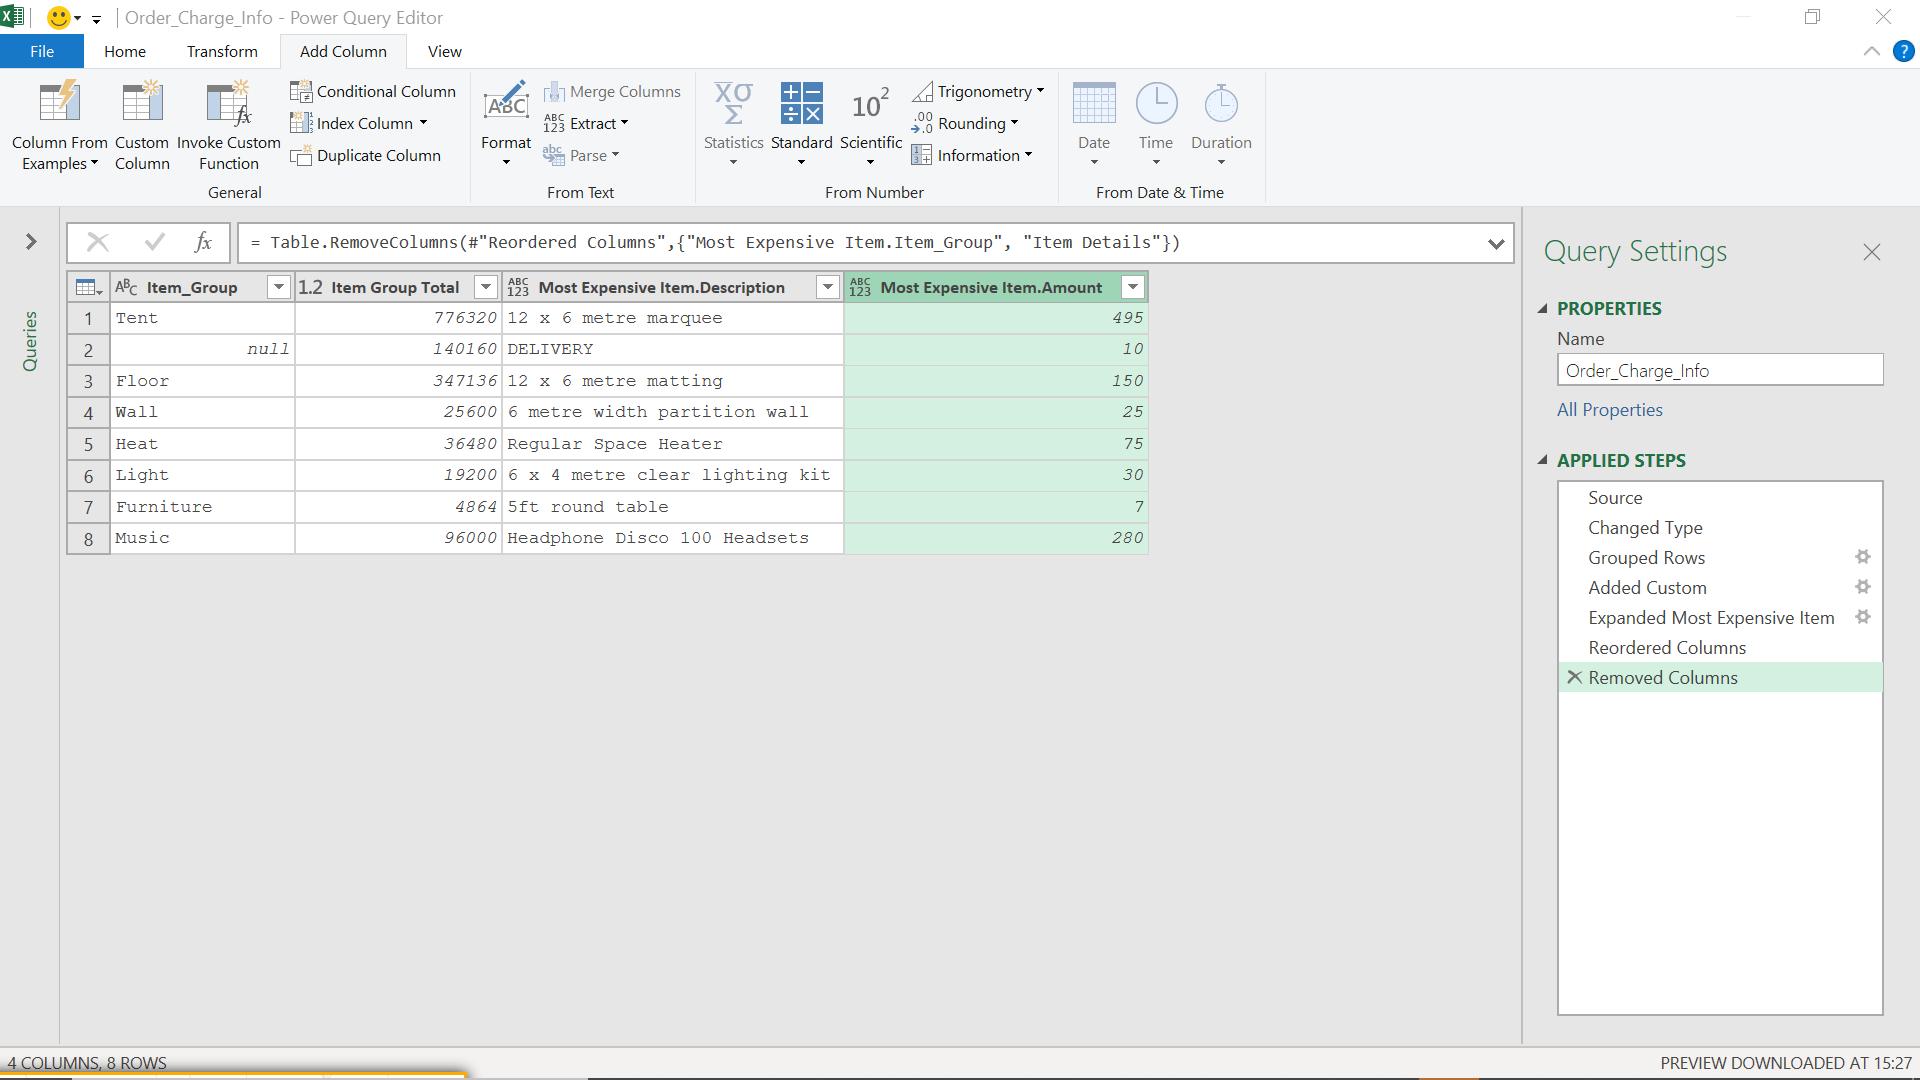
I can see that the item group columns match, so I remove the columns I no longer need.
Come back next time for more ways to use Power Query!