
Power Query: Interactive Query
10 April 2019
Welcome to our Power Query blog. This week, I look at how to make a functional query more interactive.
Last week, I created a query that could receive date parameters.
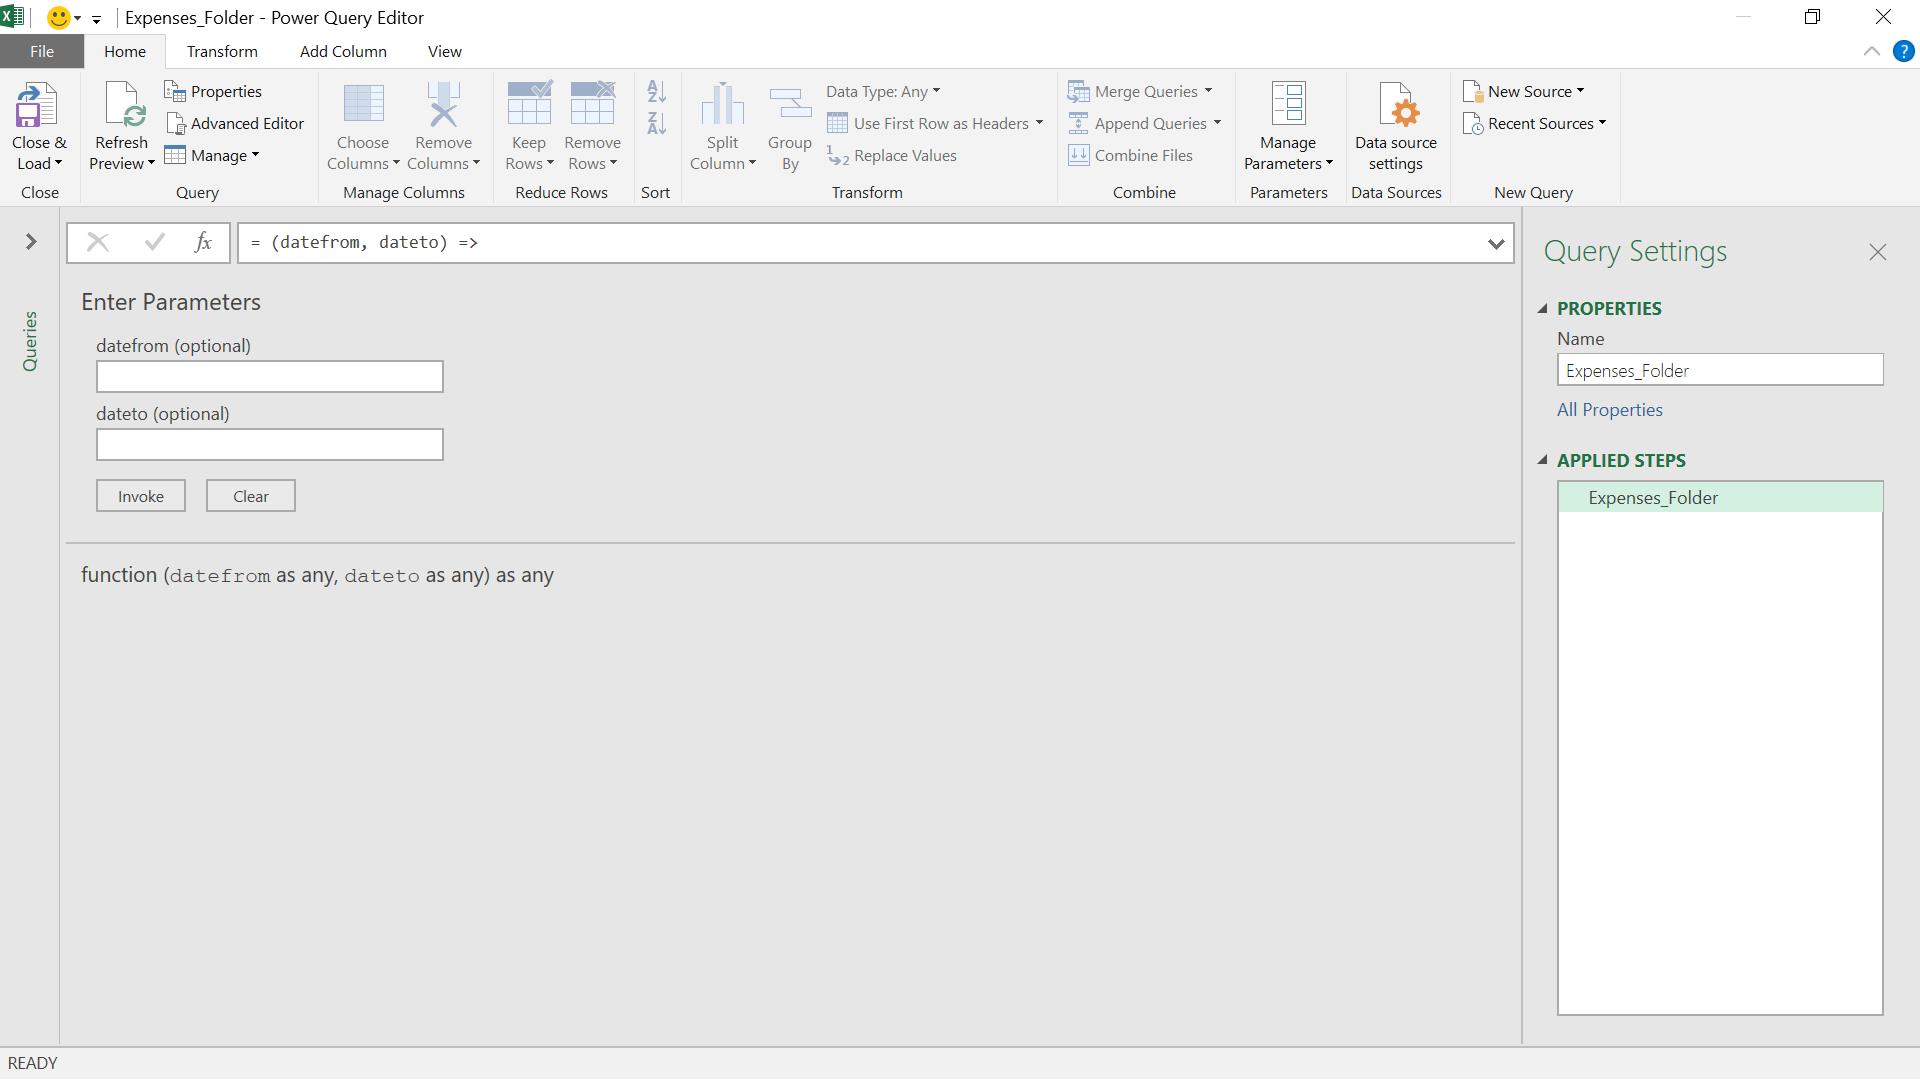
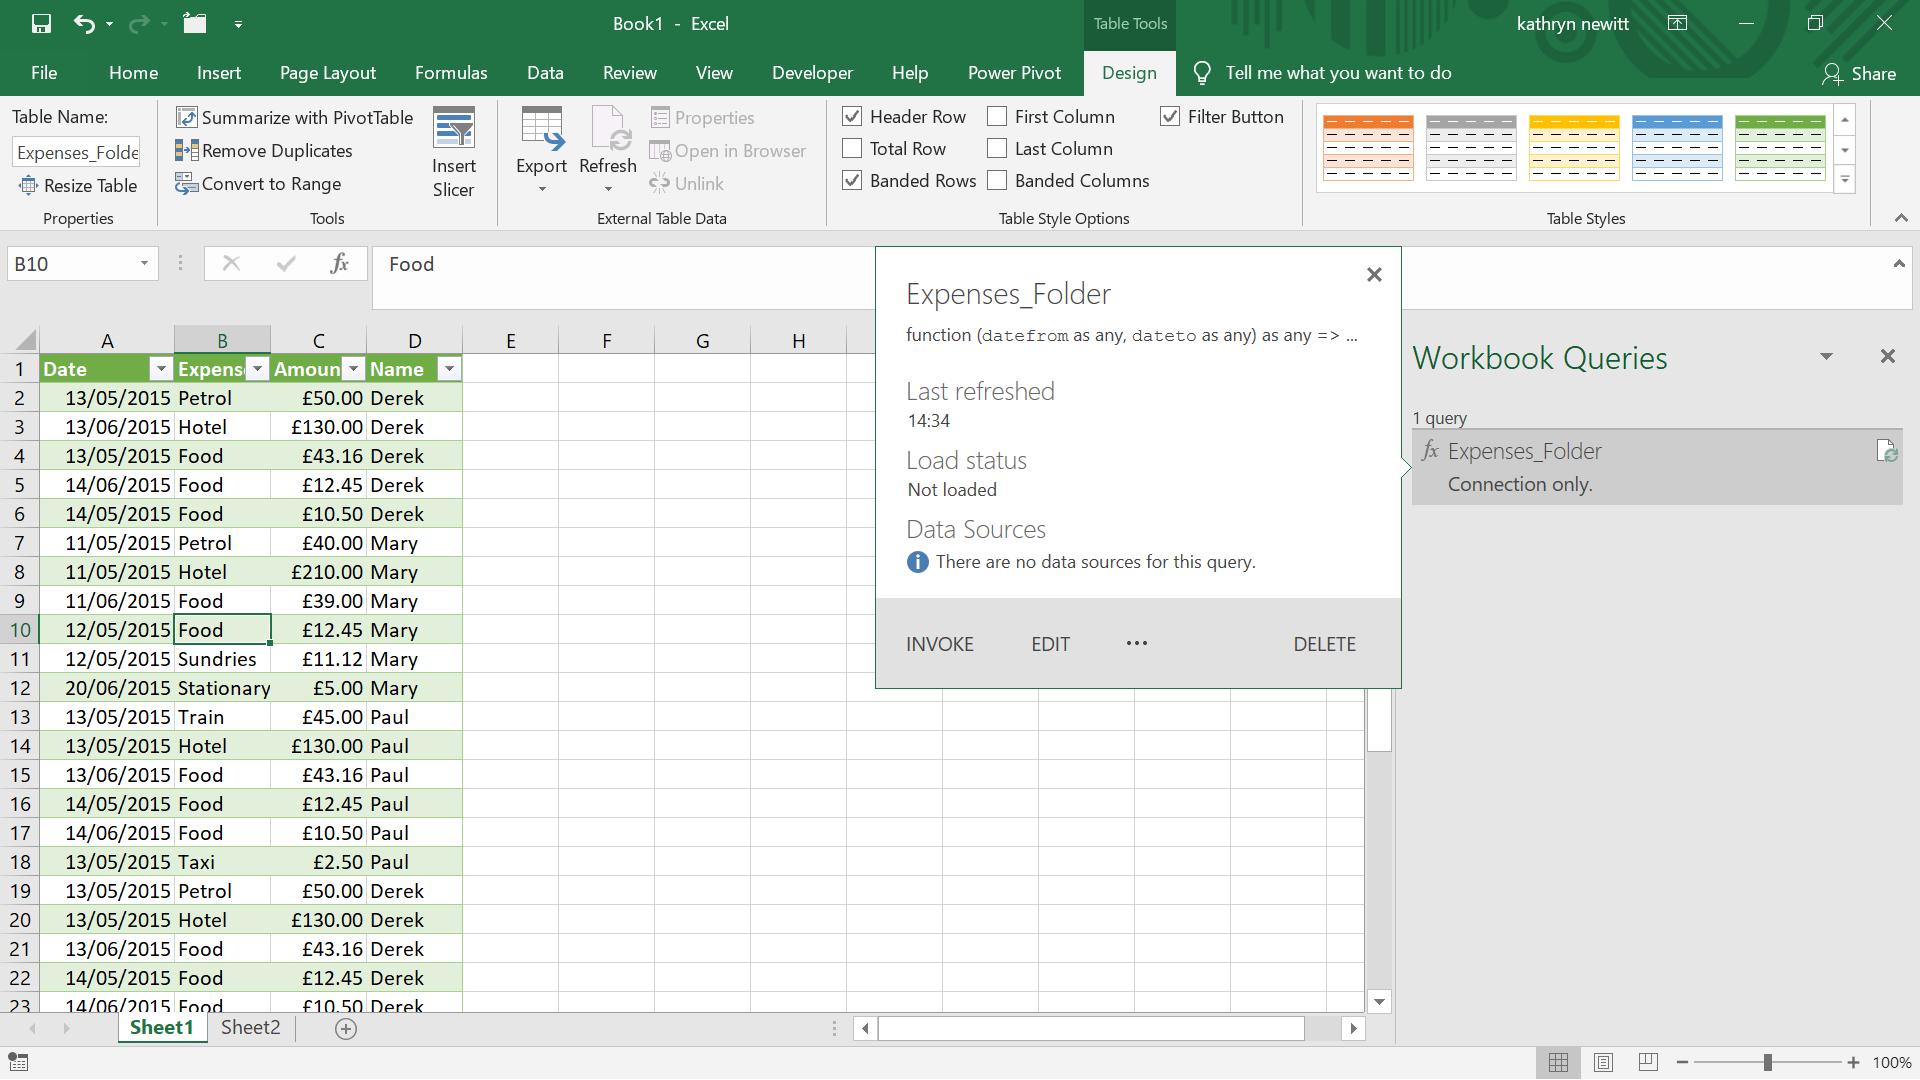
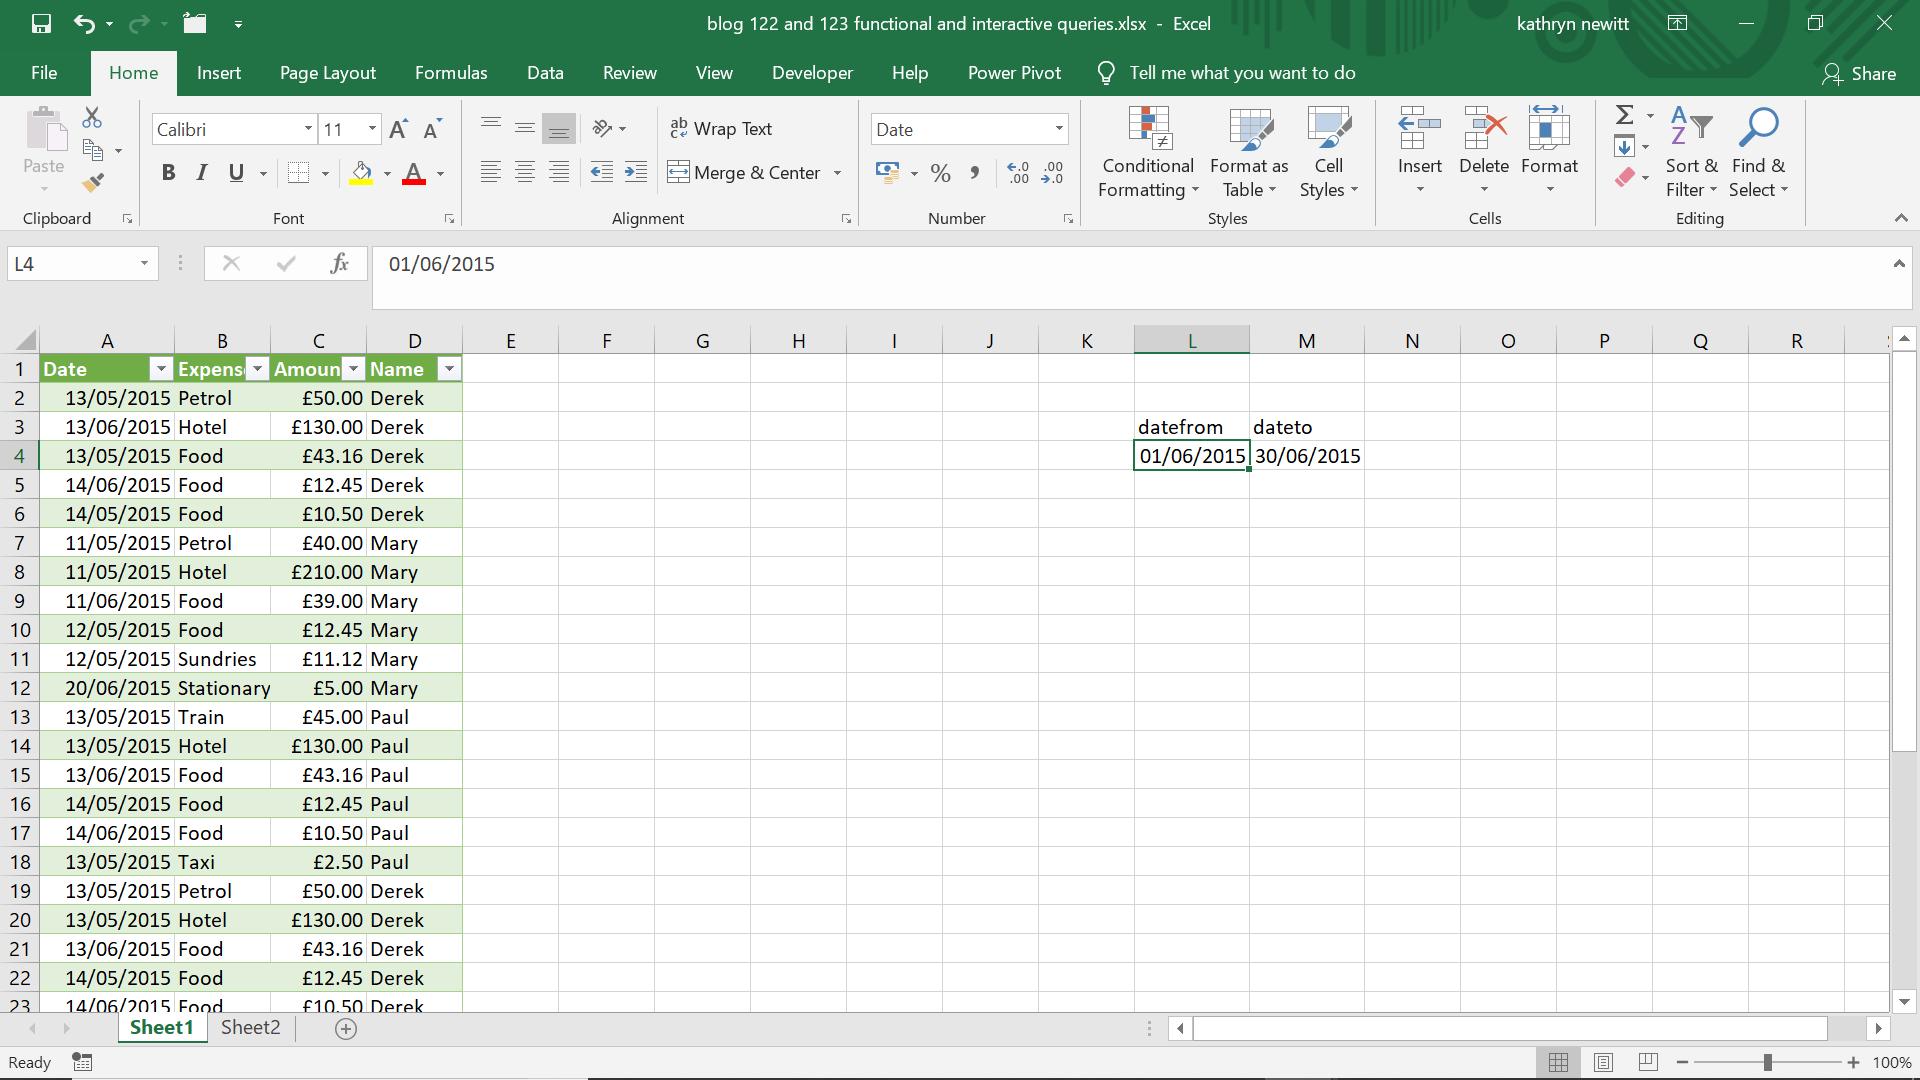
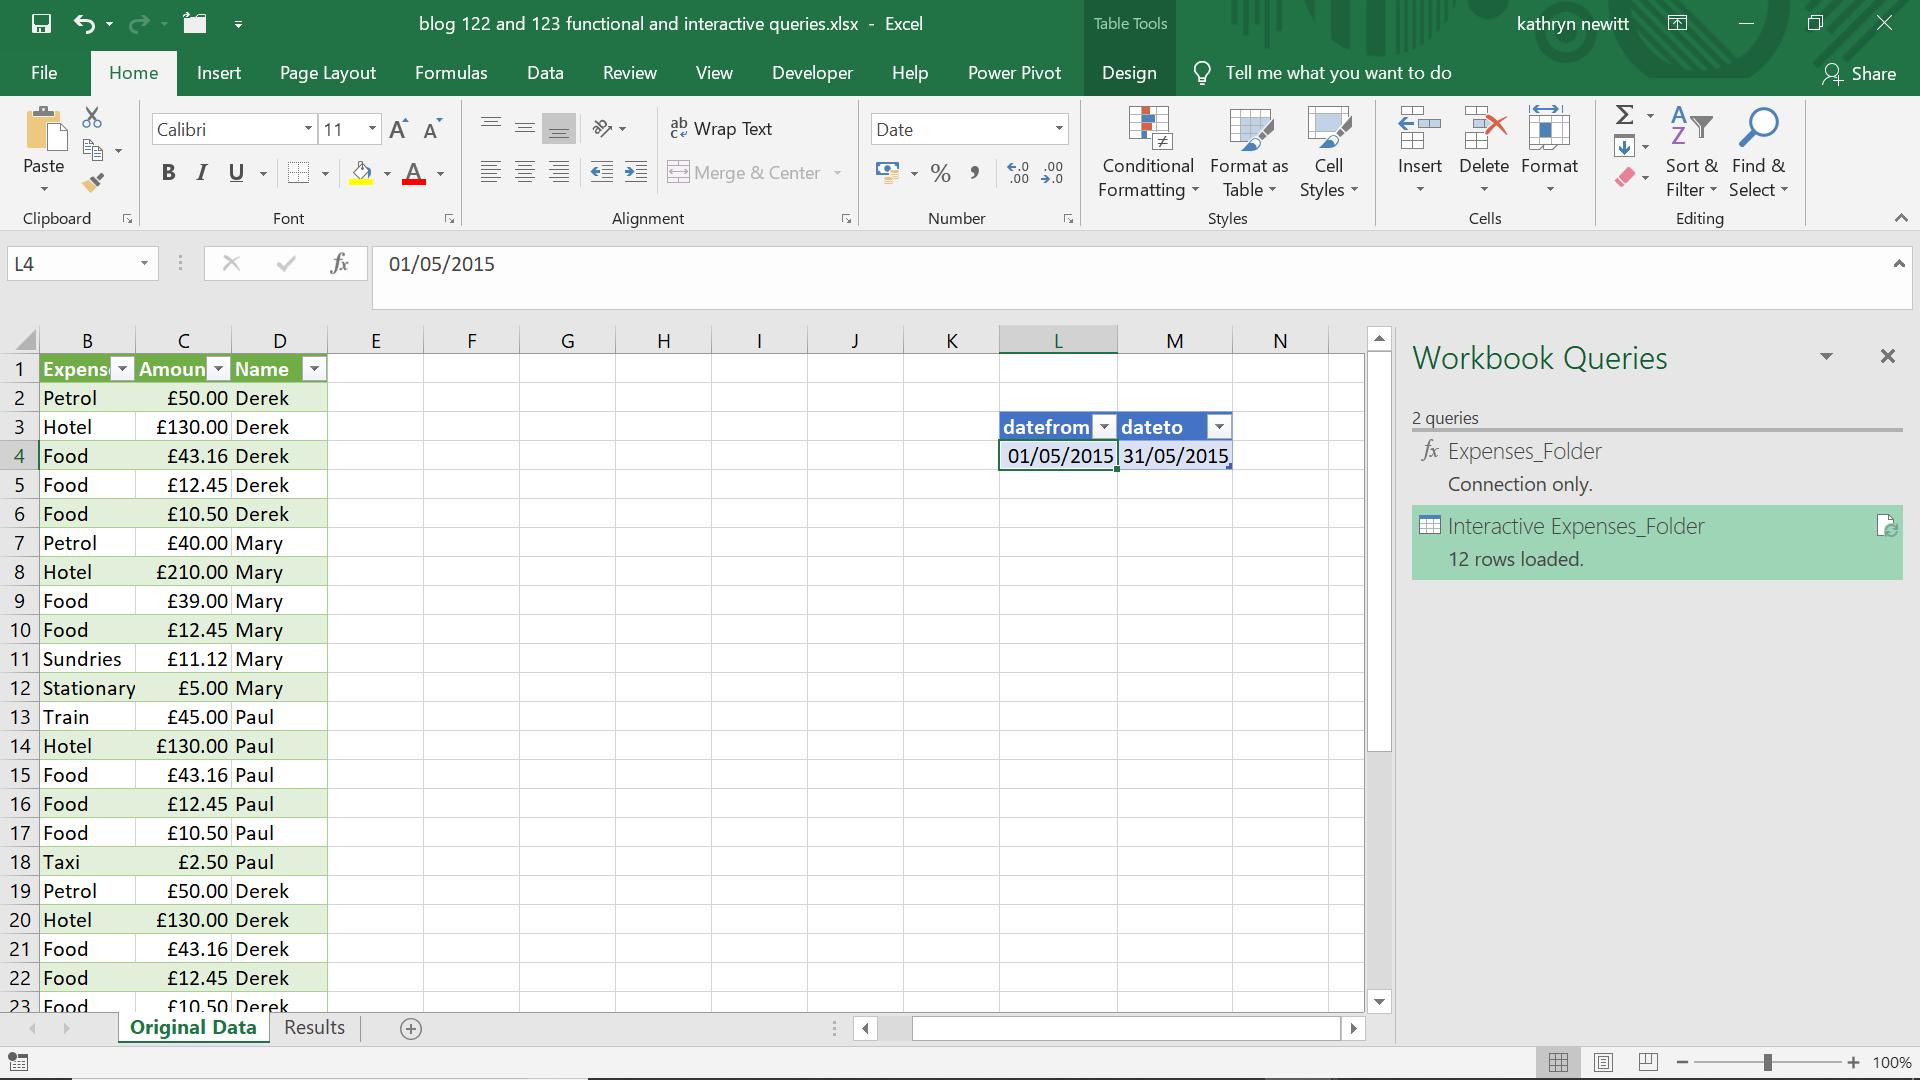
This week, I amend my query so that it’s more flexible for users by allowing the parameters to come from the worksheet. The first step is to put the dates into the worksheet:
I don’t need to worry about making this a Table, as when I extract this information using ‘From Table’ in the ‘Get & Transform’ section on the ‘Data’ tab, Power Query will automatically convert it to a Table. Having said that, it’s a good practice to convert to a Table first, as you get to choose the name of the Table before importing.
Having said that, let’s pretend I ignored my advice:
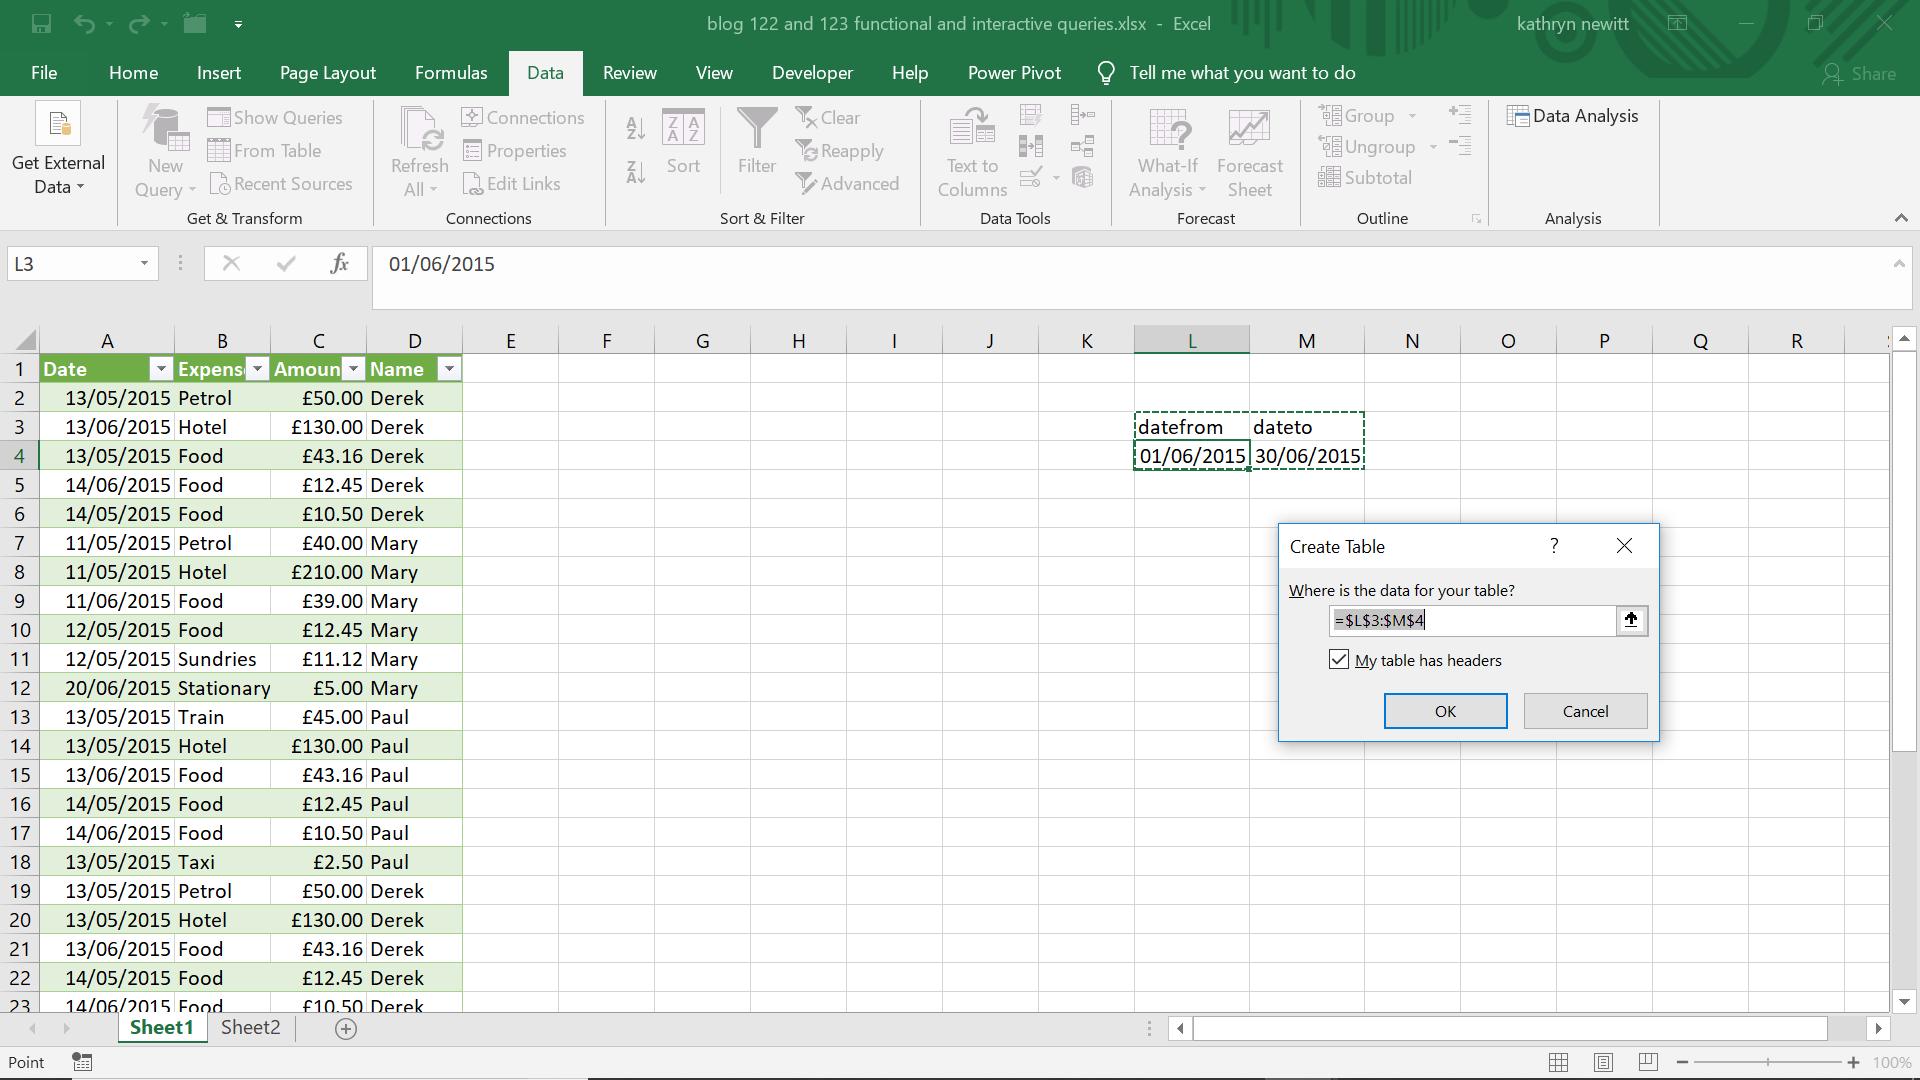
I confirm the defaults to extract the information to Power Query.
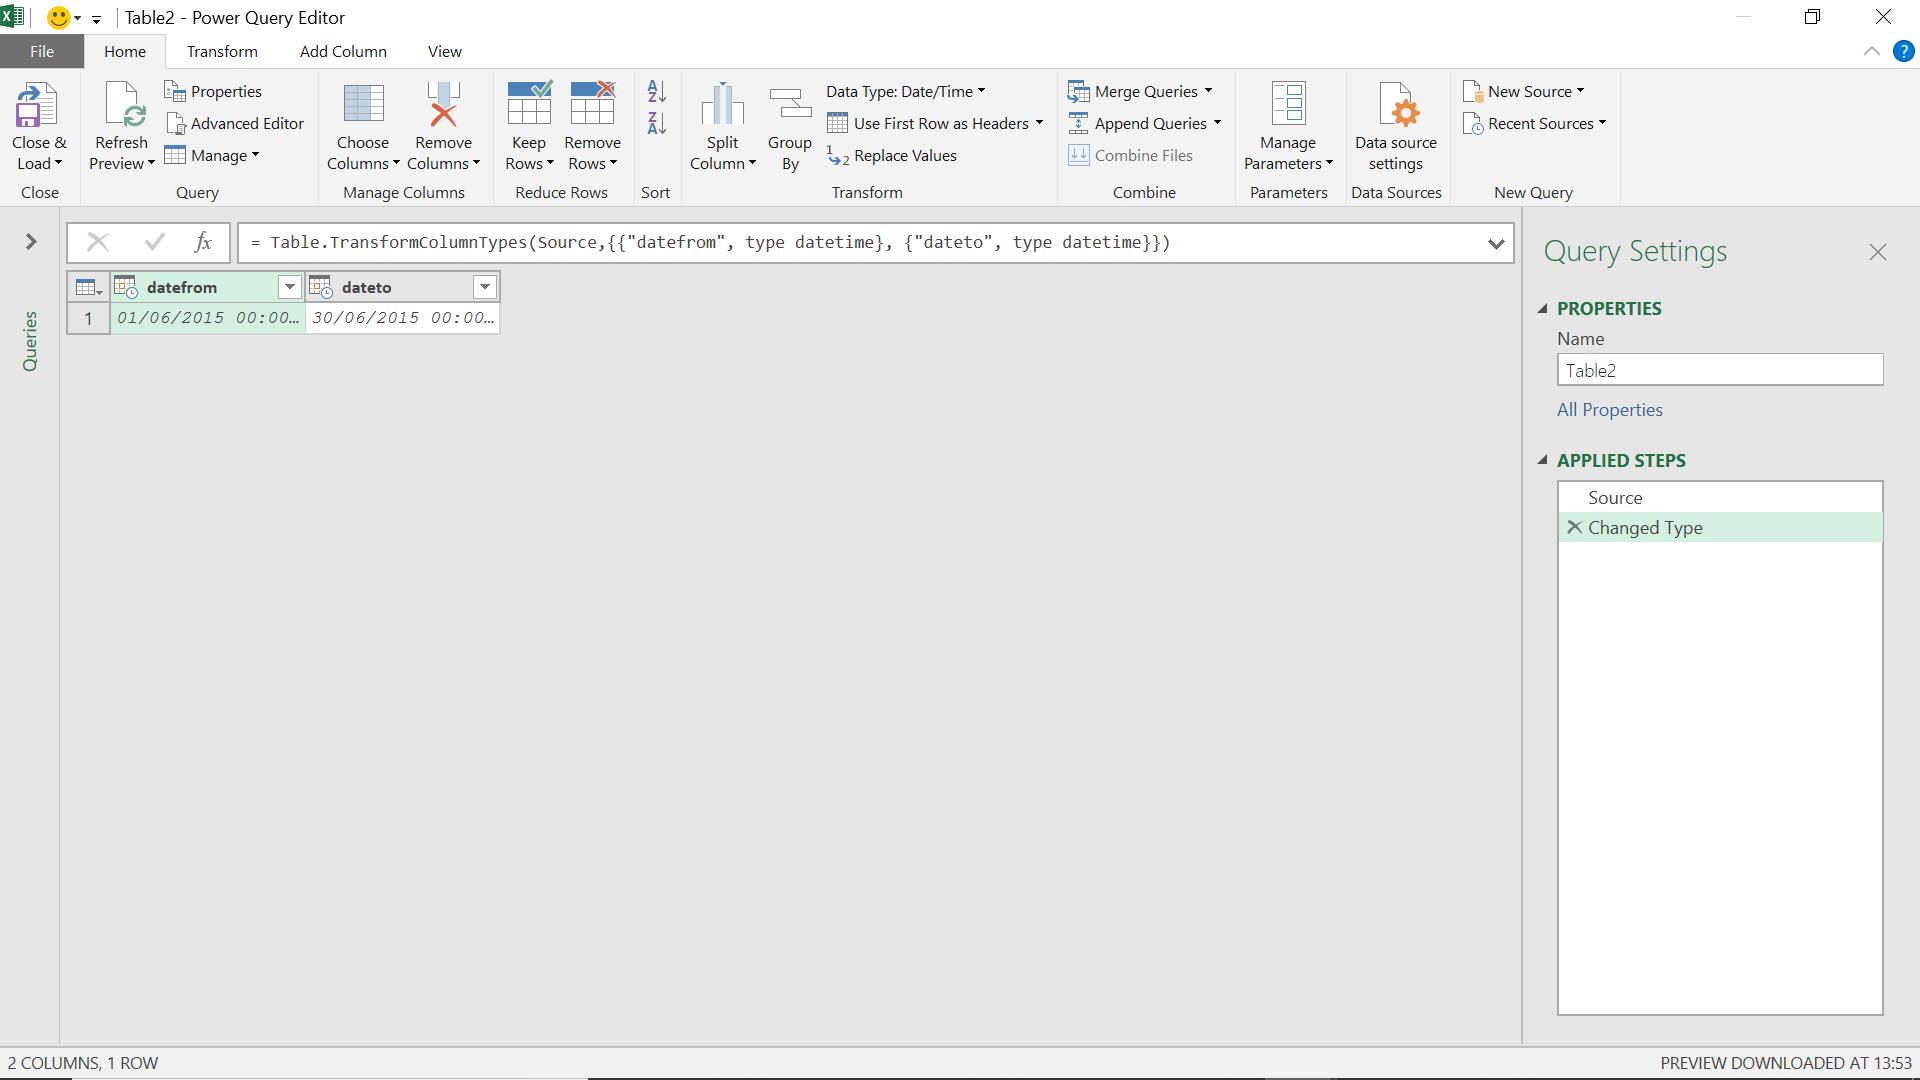
Now I need to connect these parameters to the query I created last week, ‘Expenses_Folder’. To do this, I create a new custom column from the ‘Add Column’ tab:
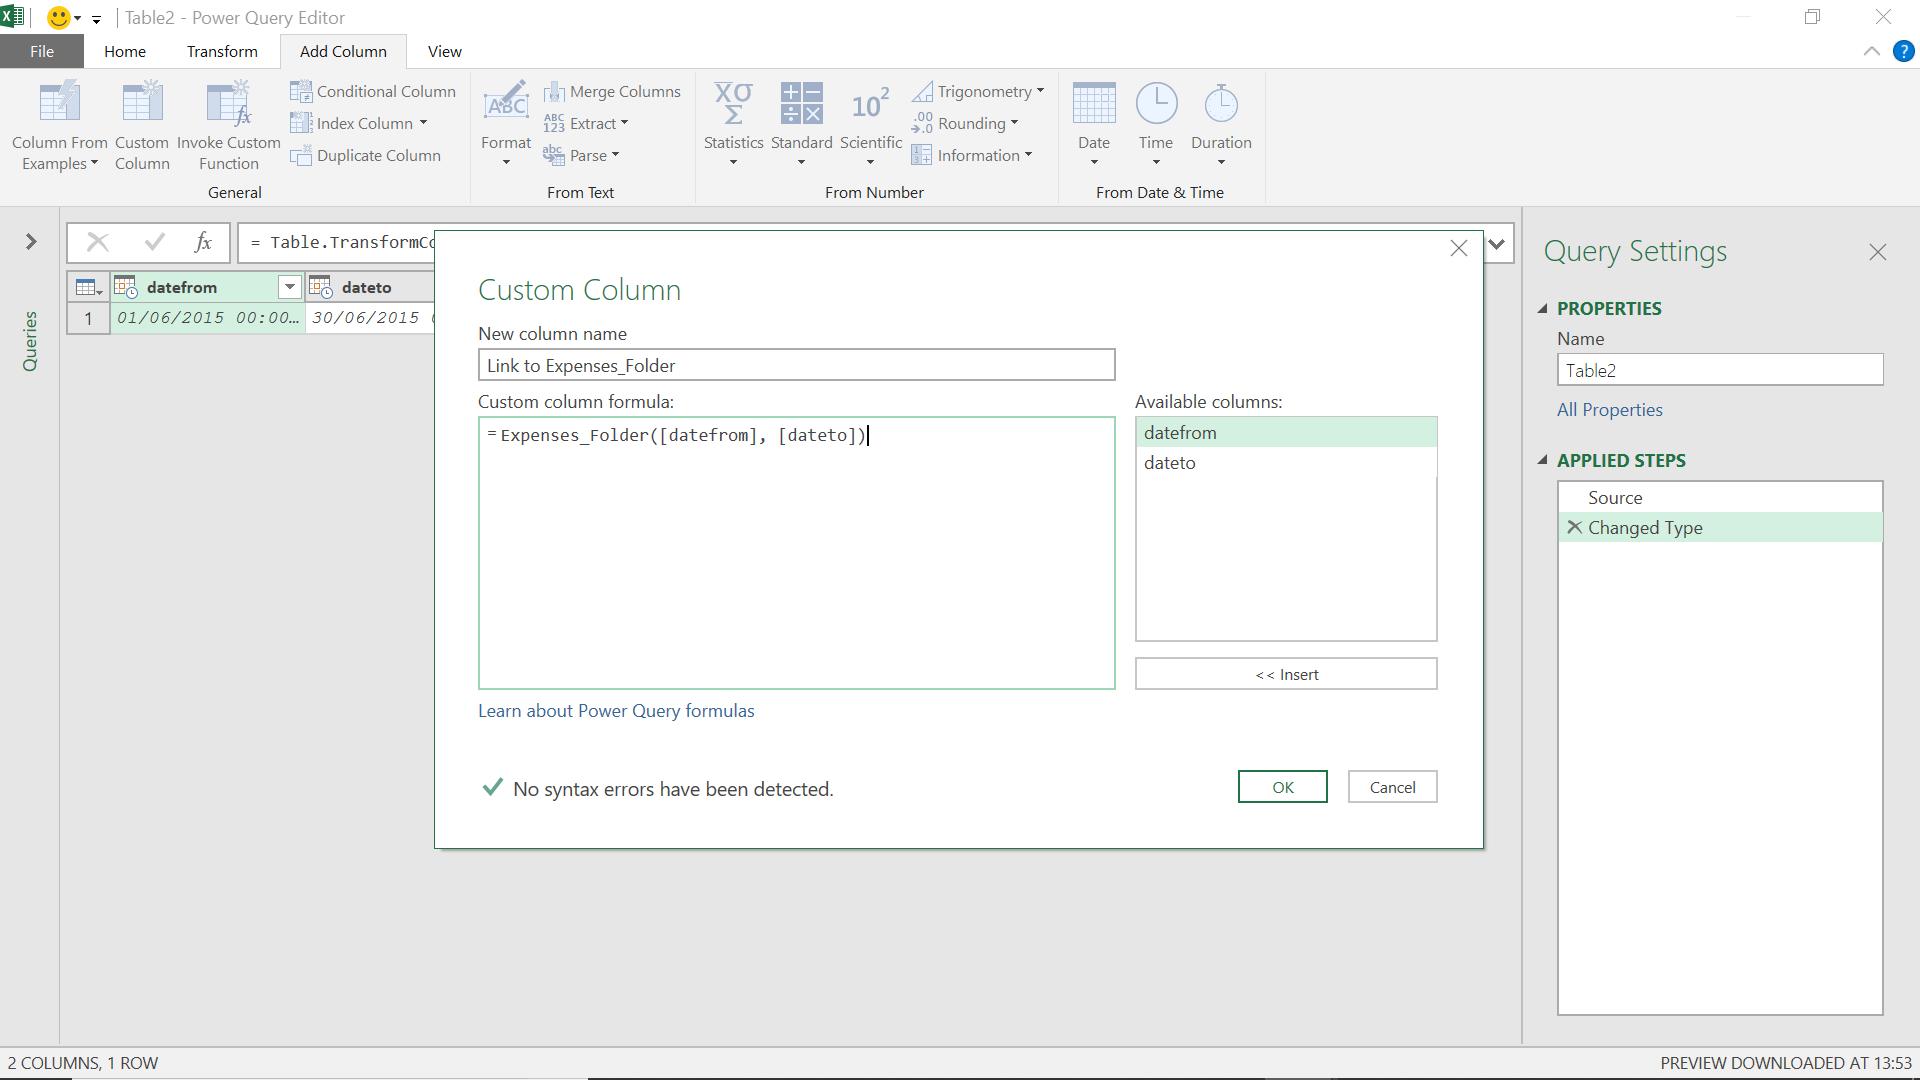
Since ‘Expenses_Folder’ is a function, I can use the M code
= Expenses_Folder([datefrom], [dateto])
which calls my original query as a function, using the dates in the columns in my current query.
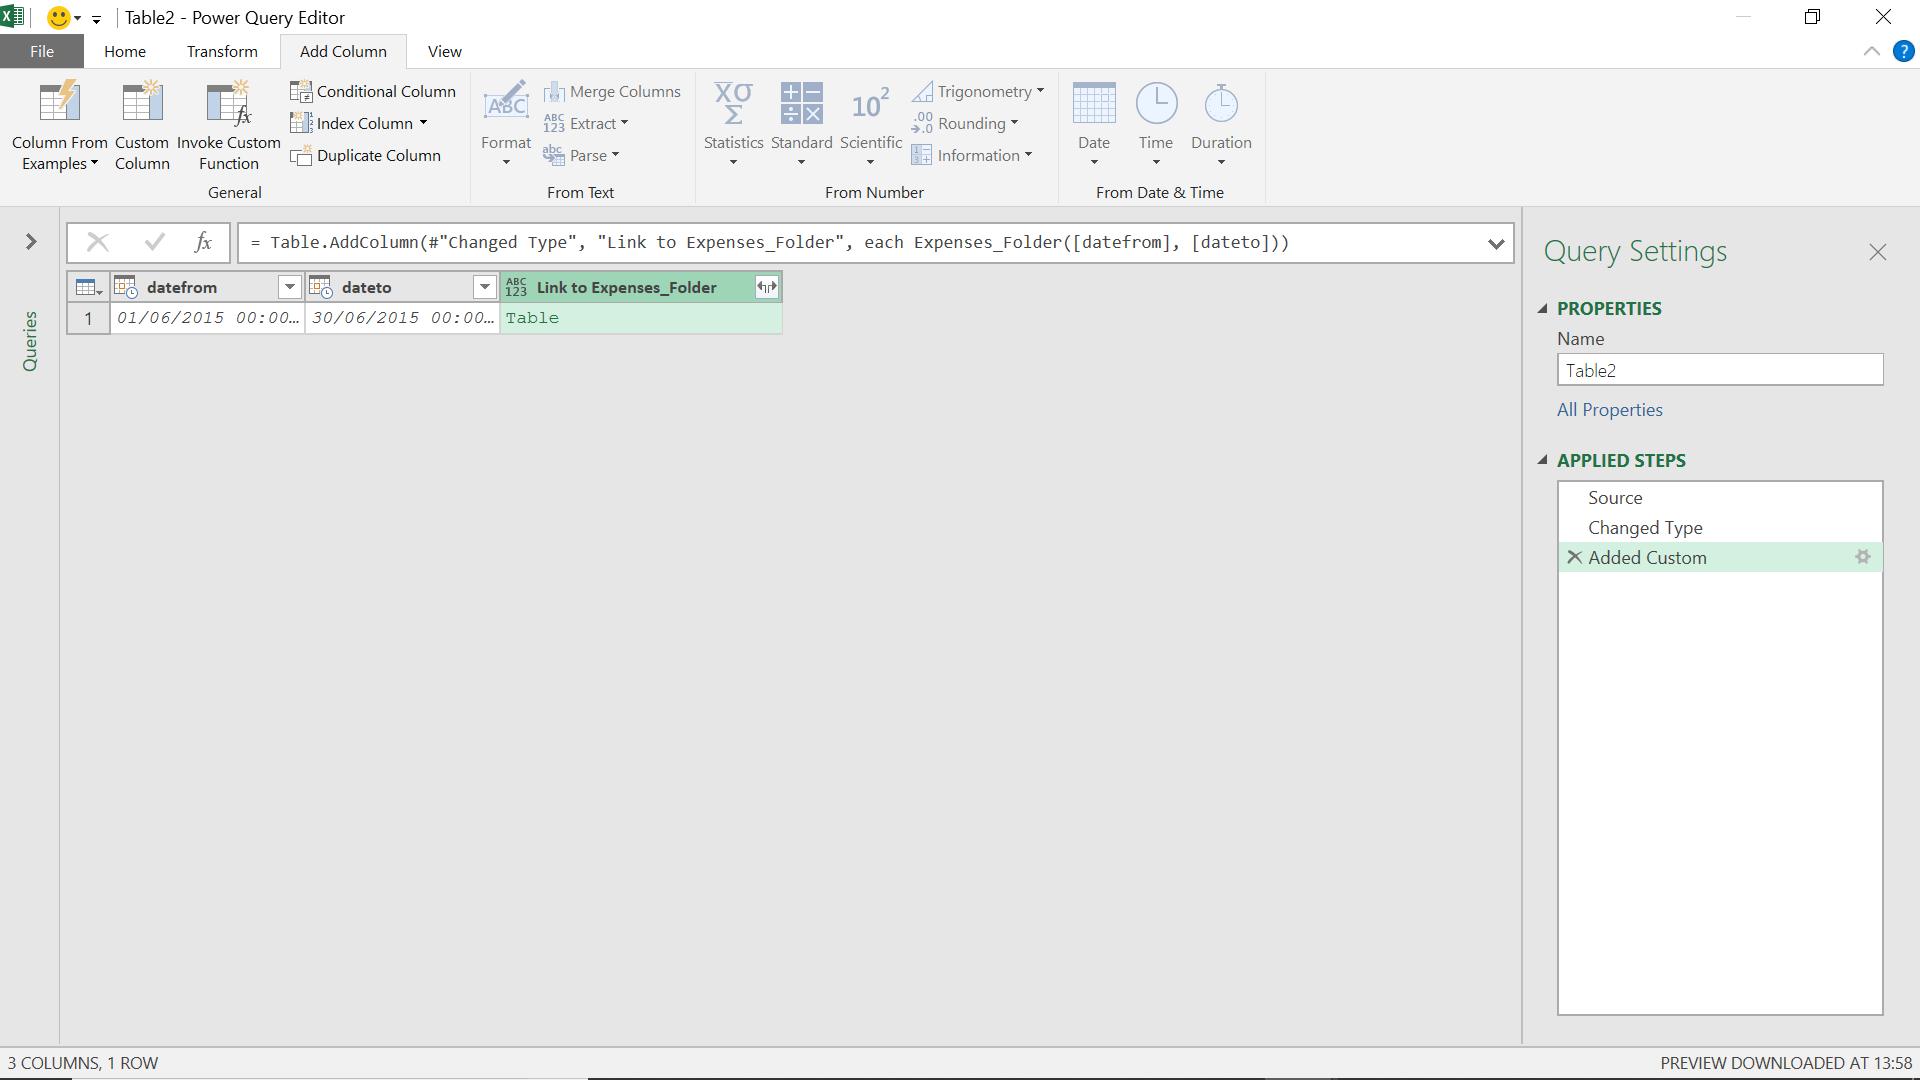
The content of my new column is a Table. I can use the ‘Expand’ icon next to the title of the column to view the contents of that Table.
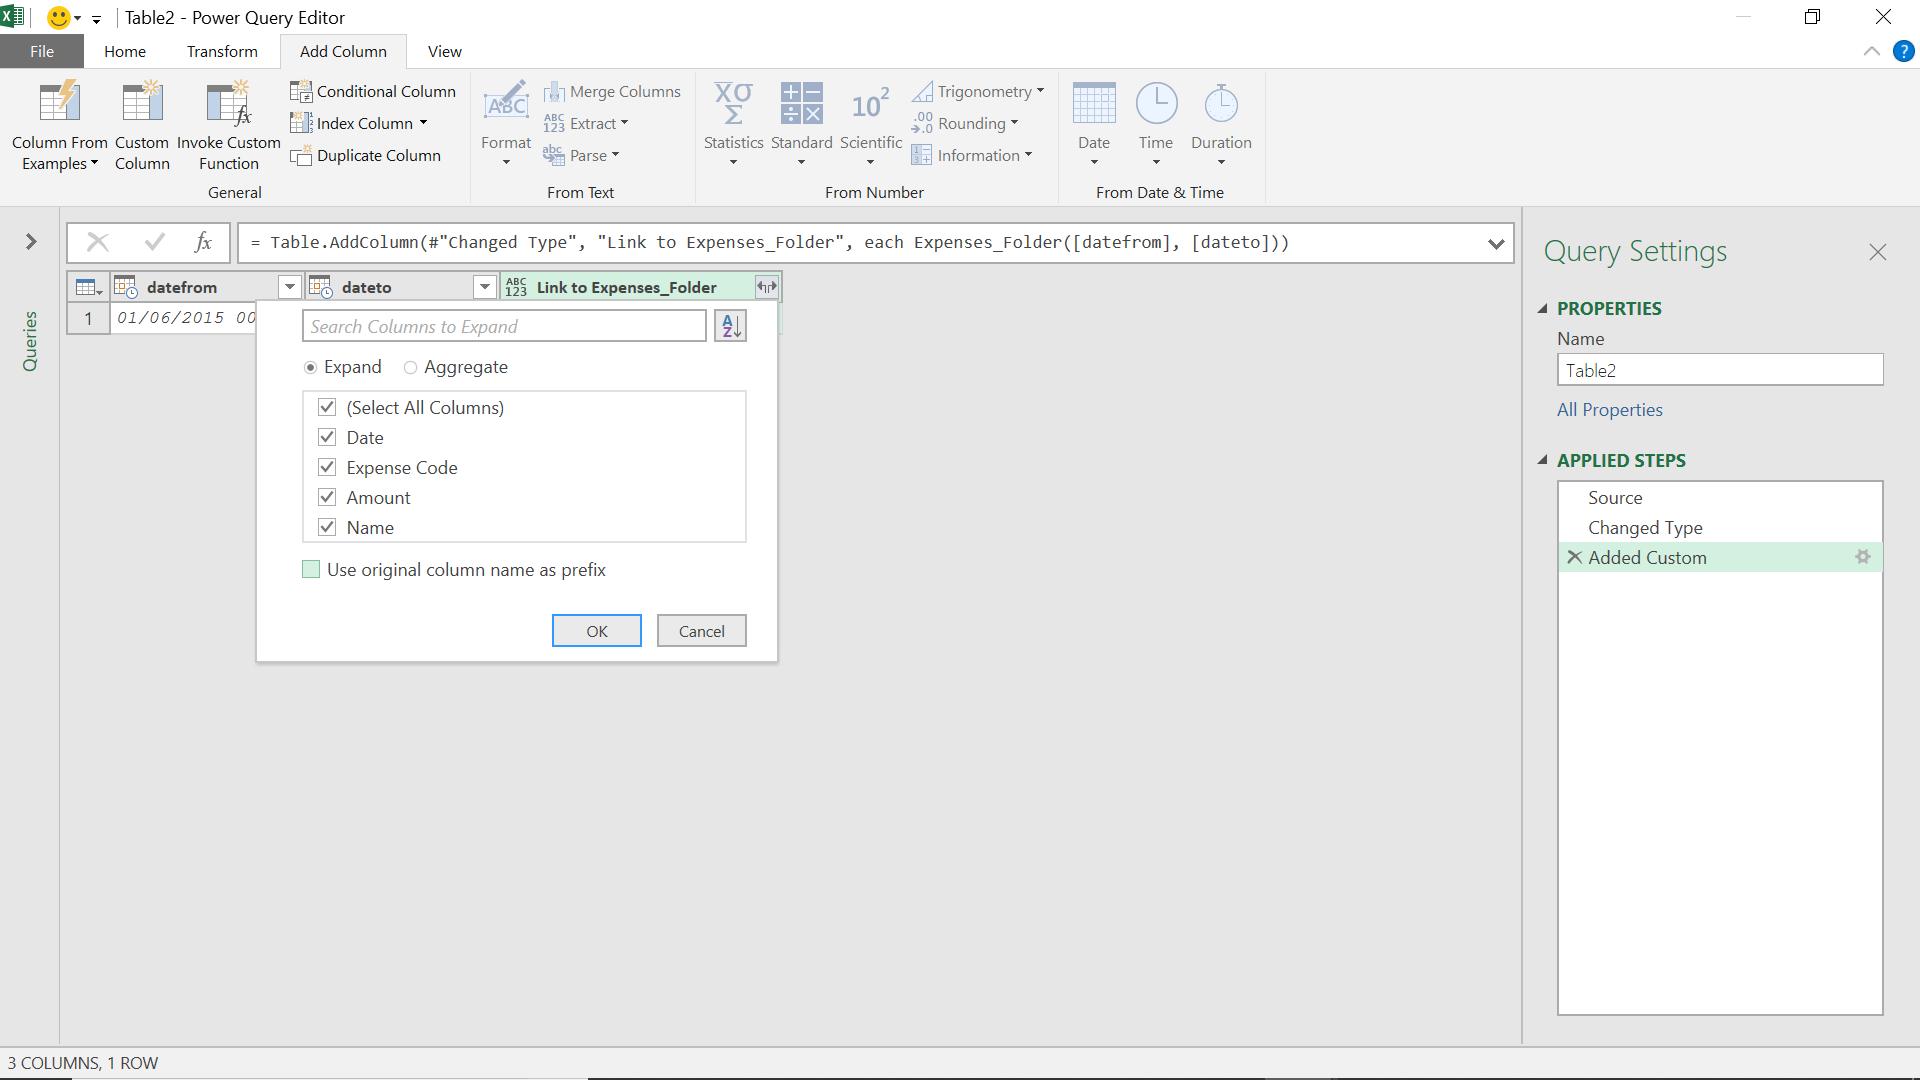
As usual, I don’t want to use the original column name as a prefix (that would make for very long column names!). I select all columns in the Table and choose to expand.
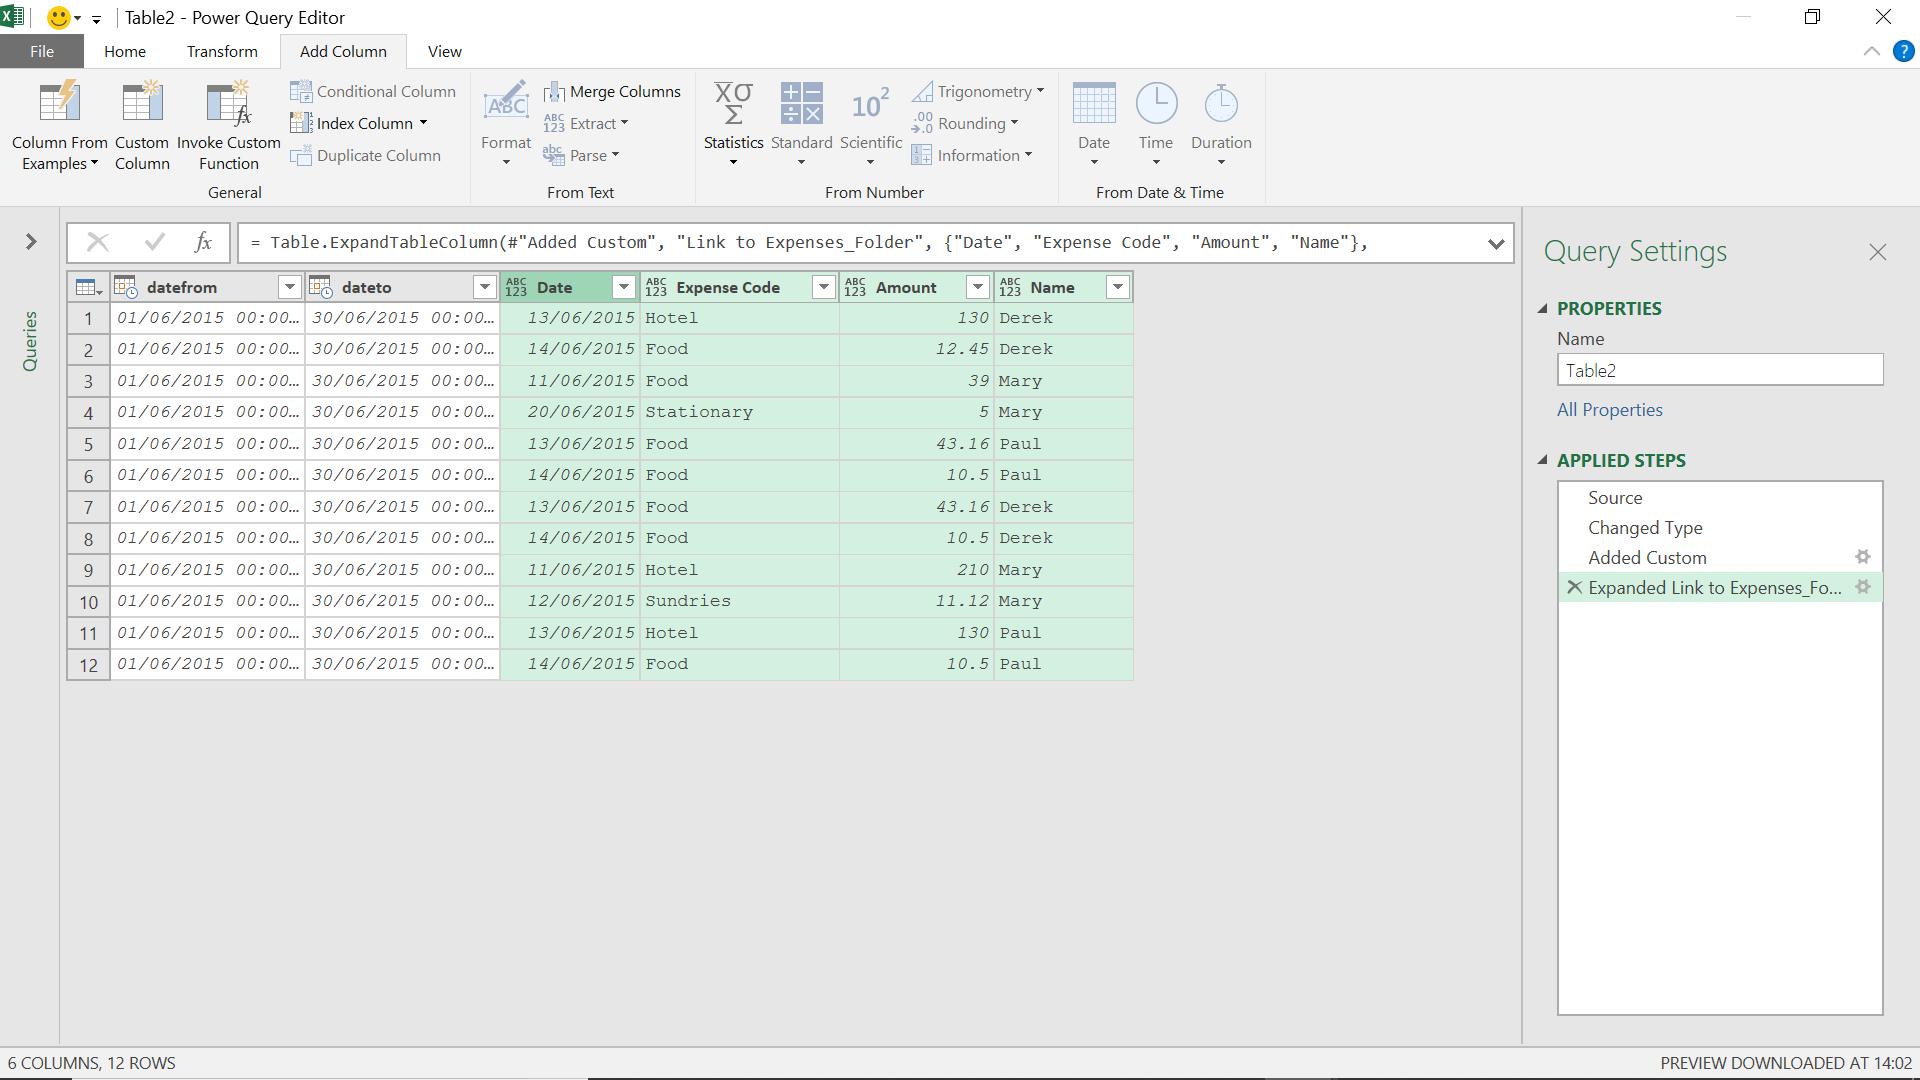
All the data from my original expenses information is shown where the date falls into the range I have specified. I remove the datefrom and dateto columns and save the query by using ‘Close & Load’ from the ‘File’ tab.

I have renamed my new query ‘Interactive Expenses_Folder’.
If I go back to the original data worksheet, I can change the dates and see what happens to my query.
Once ‘Interactive Expense_Folder’ is refreshed, I can see that the expenses from May are displayed.
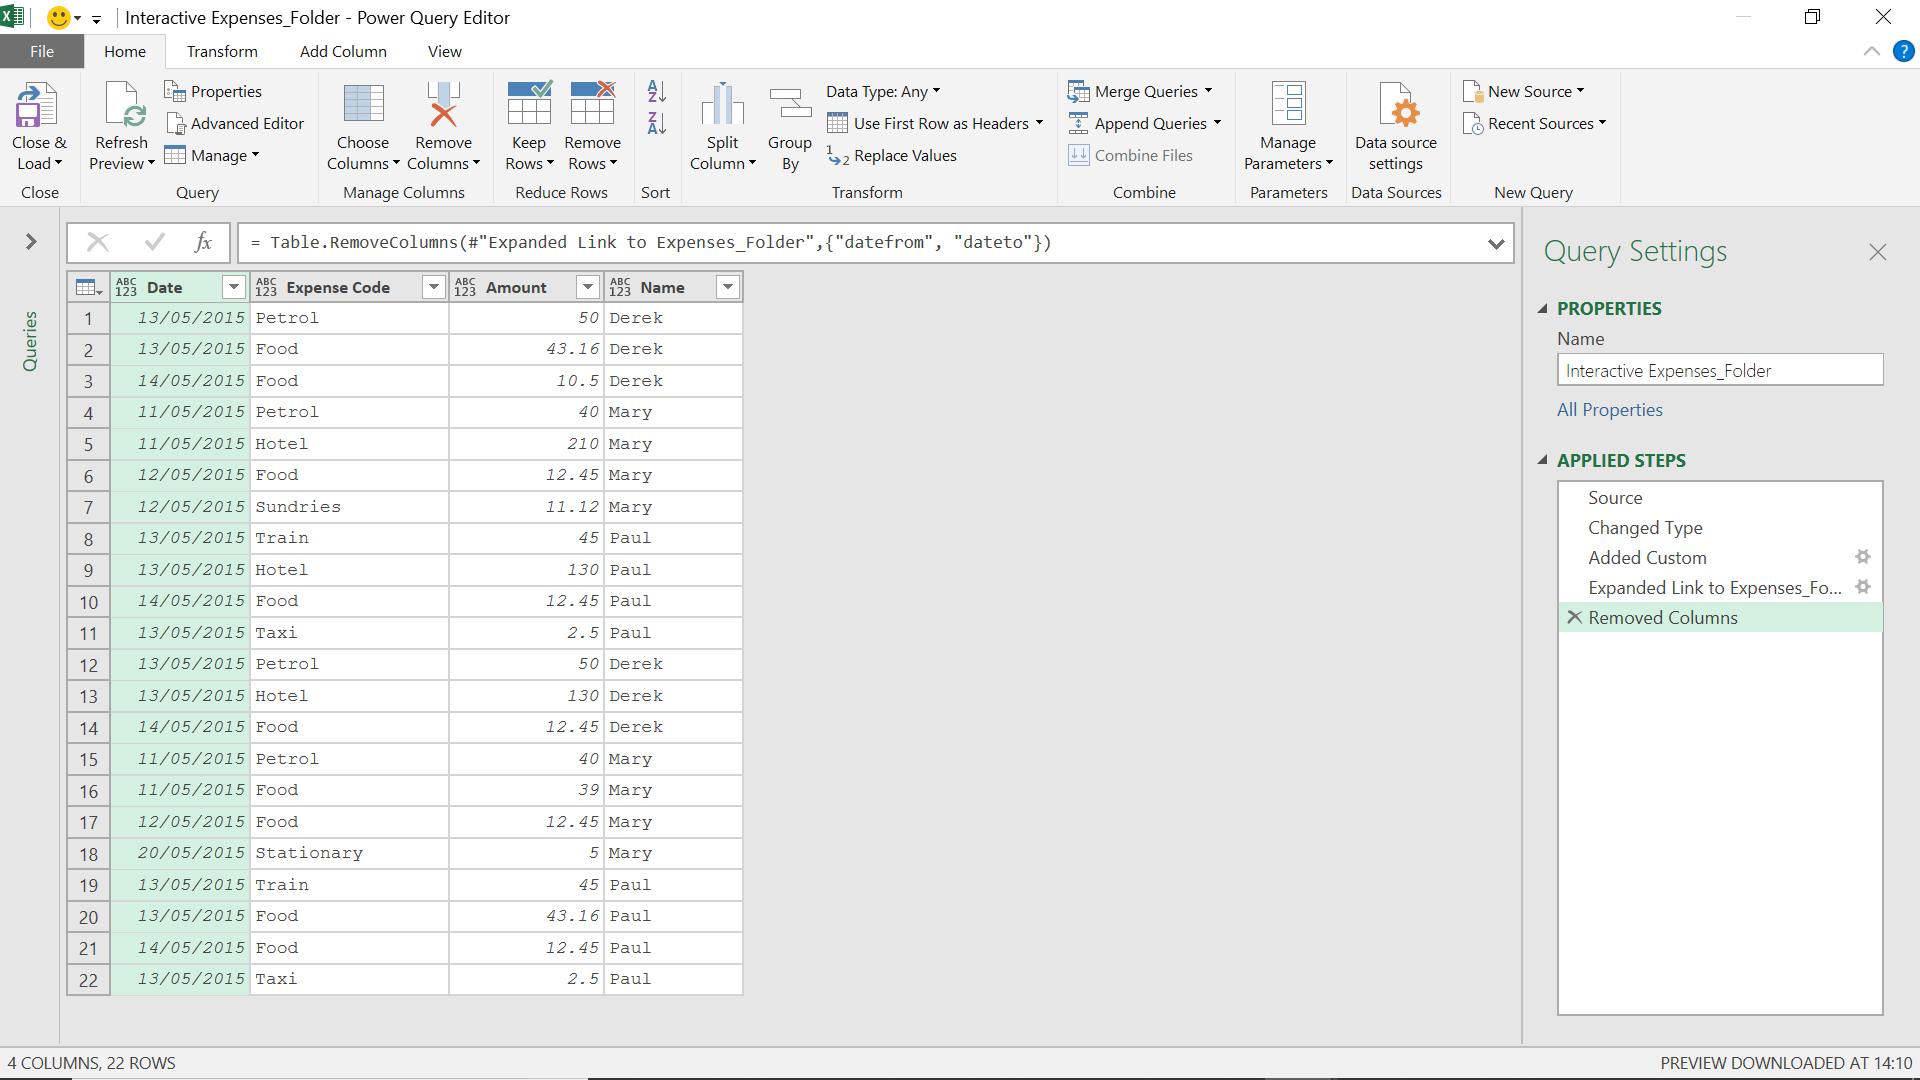
This is a quick and easy way to reduce the amount of data that I have to deal with.
Come back next time for more ways to use Power Query!