
Power Query: Mind the Overlap
17 June 2020
Welcome to our Power Query blog. This week, I look at a method to spot overlapping periods.
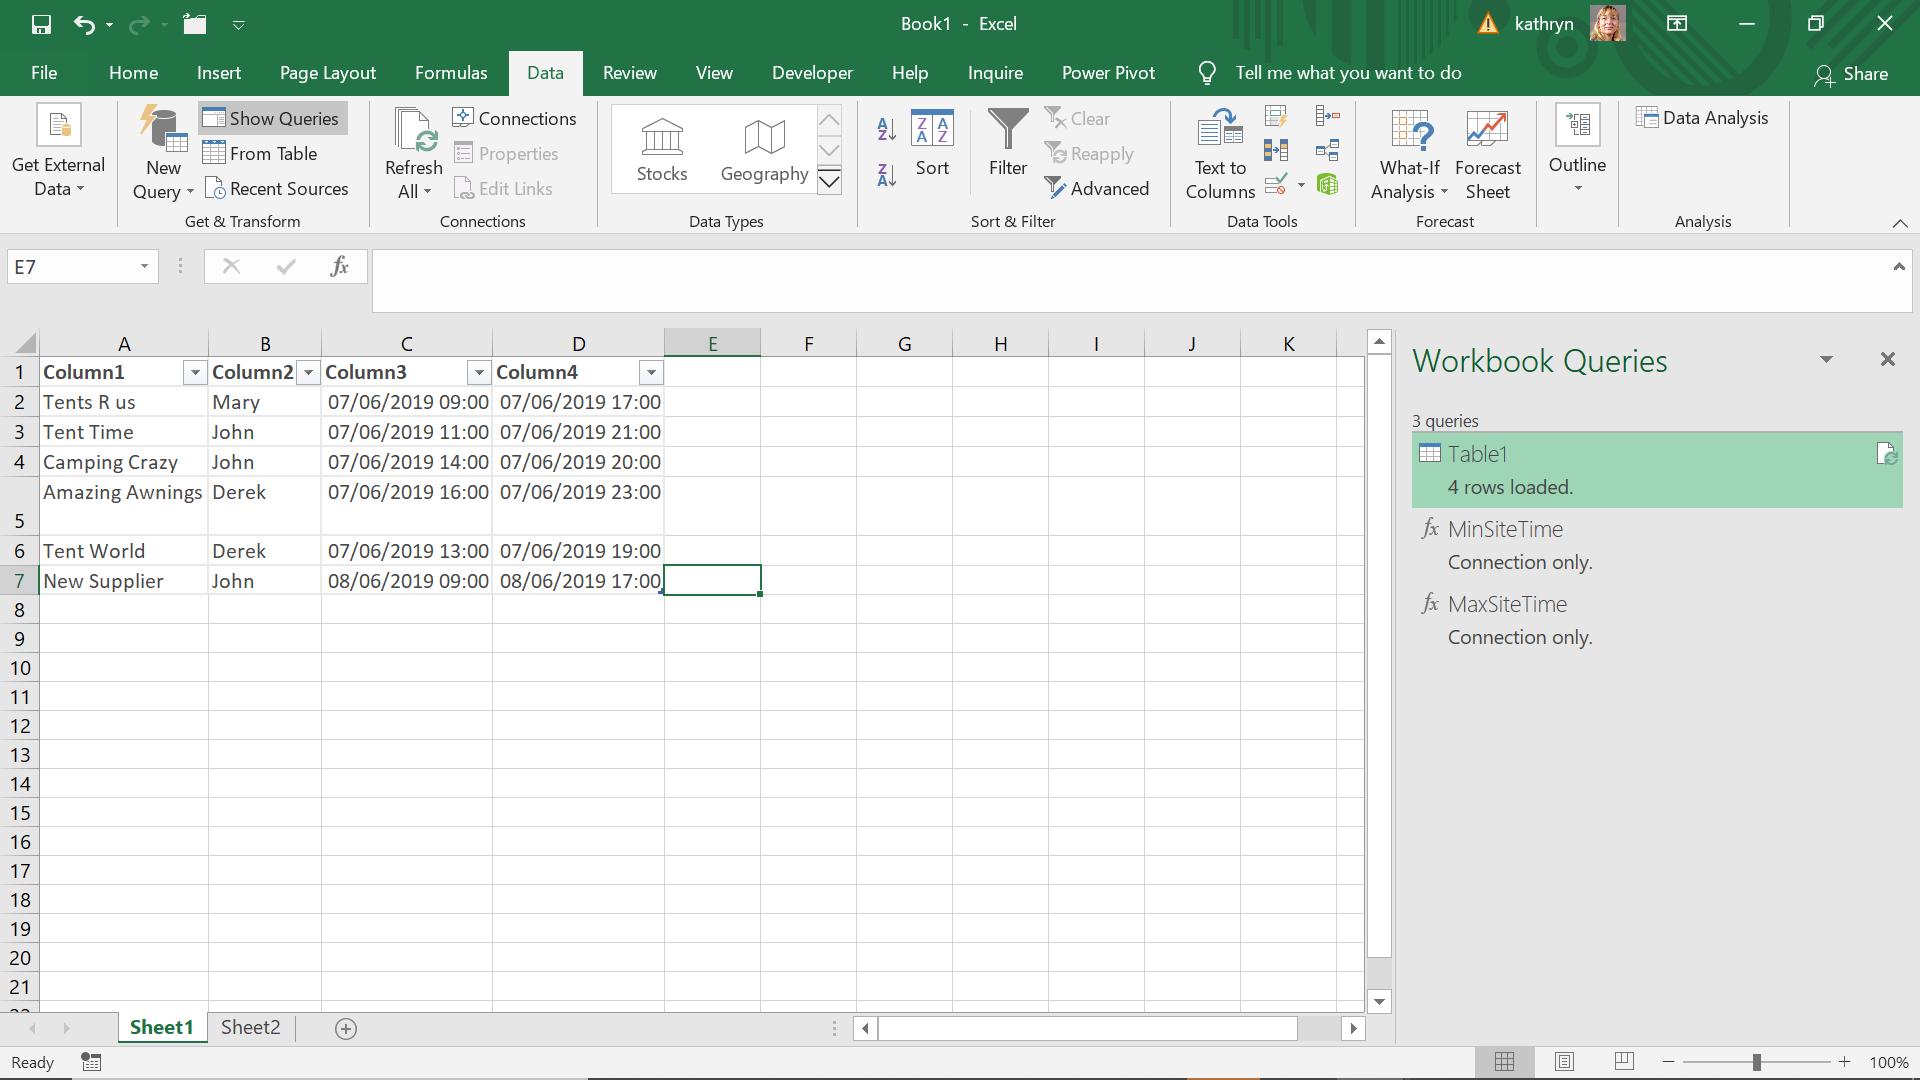
My salespeople have recorded time spent with suppliers, but there seem to be some discrepancies!
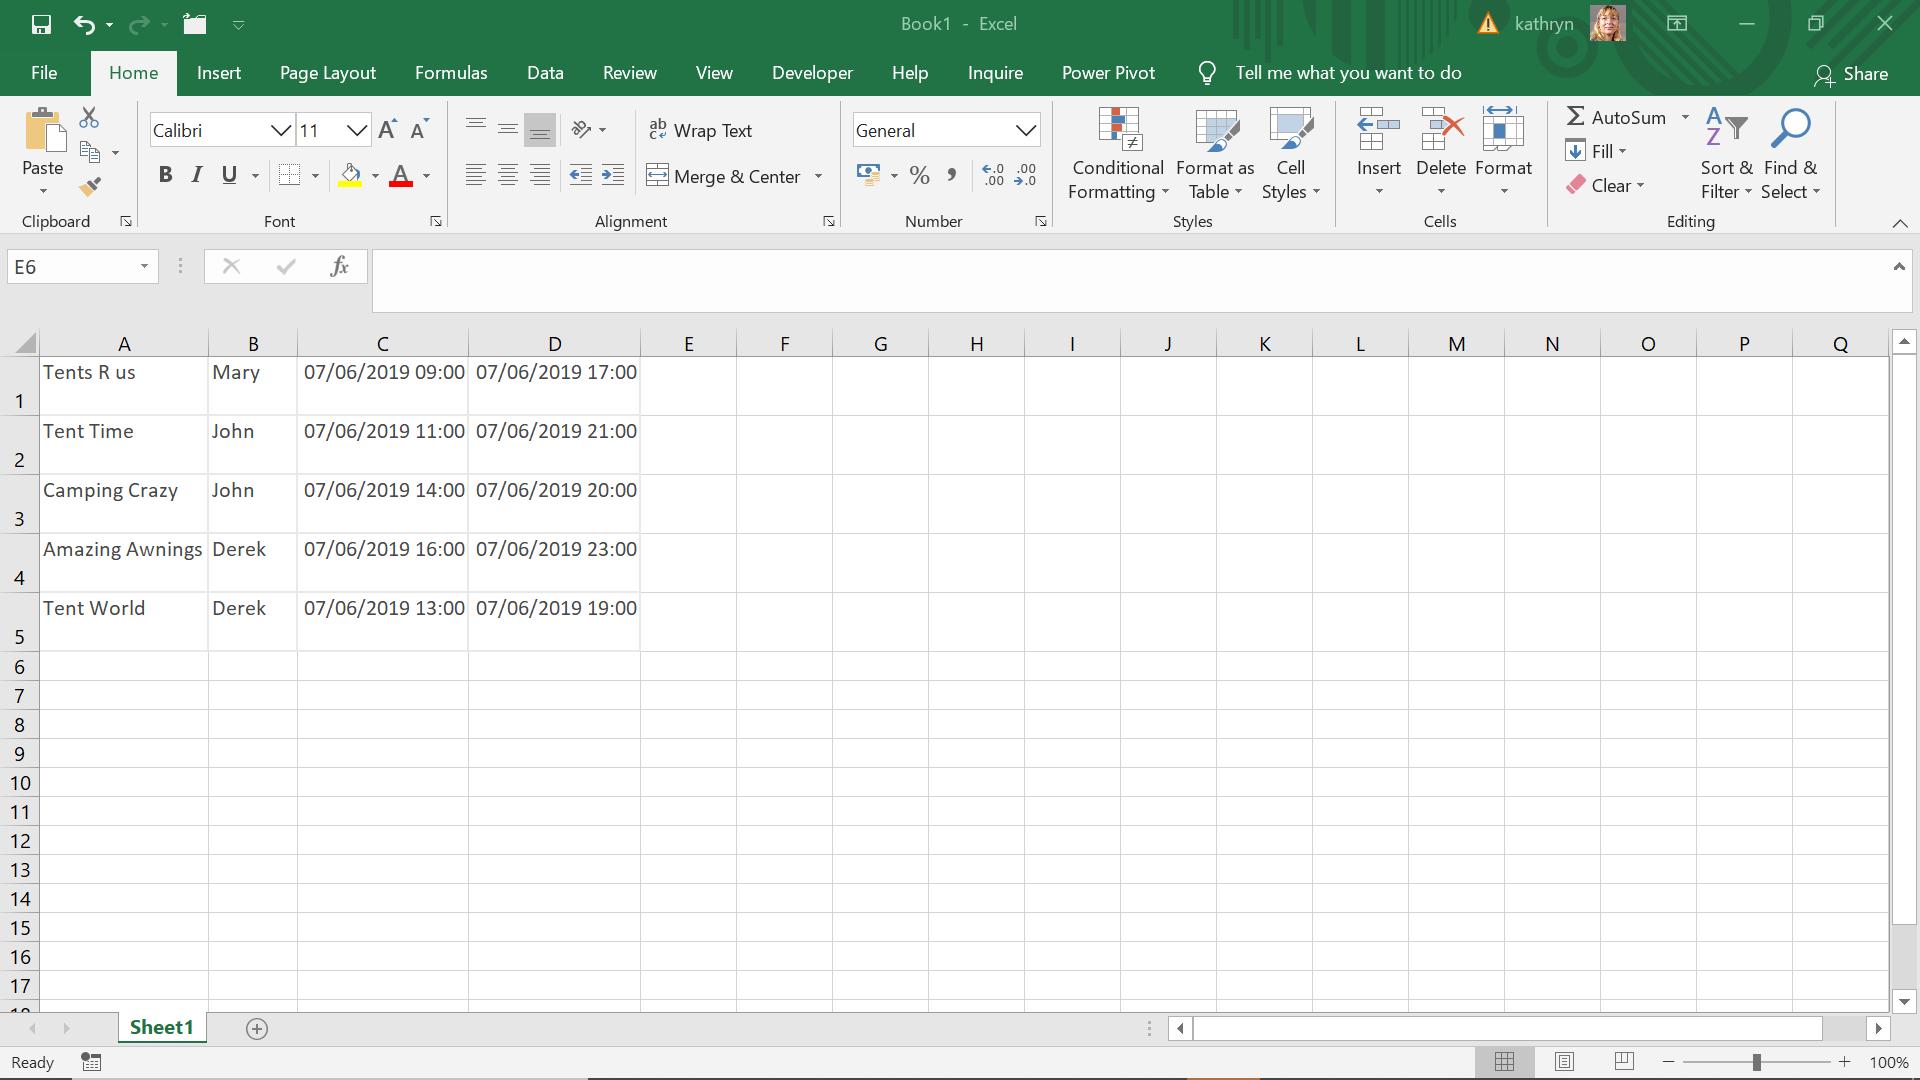
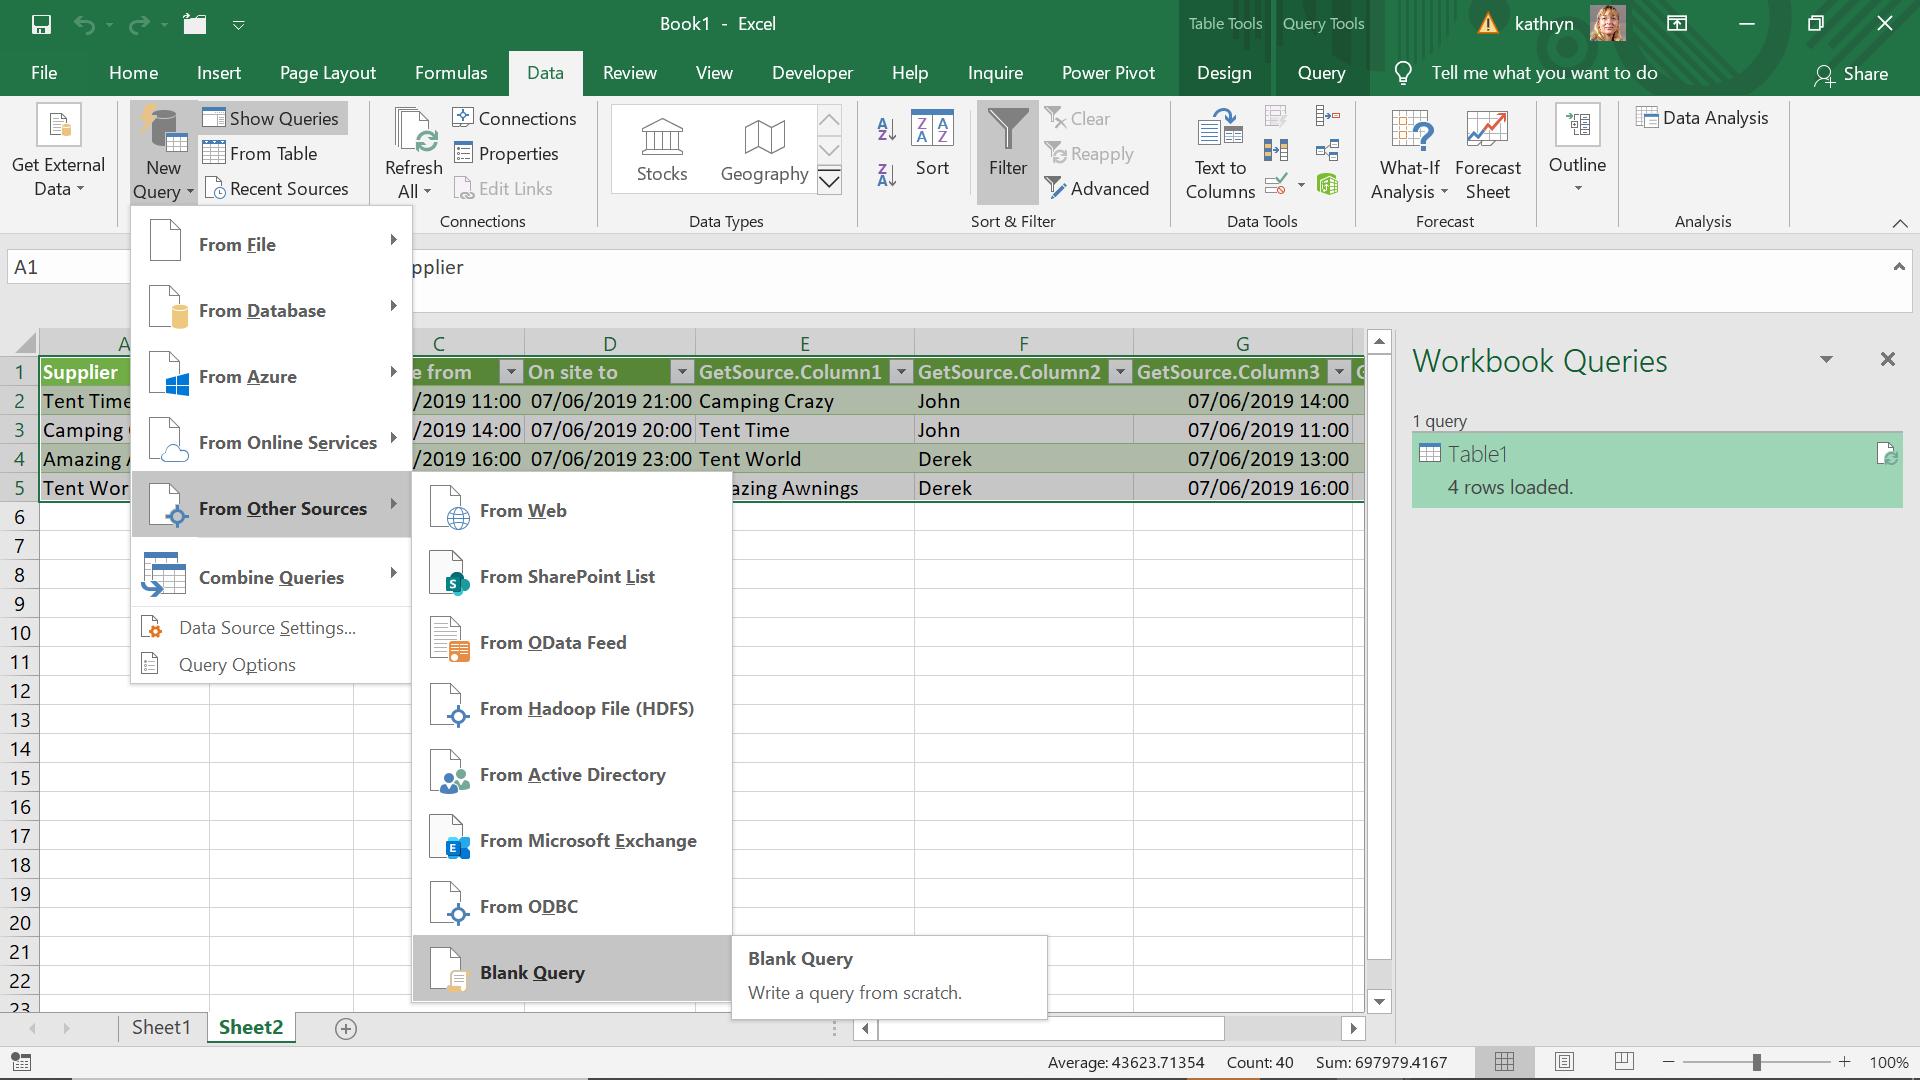
Clearly, there is some overlap, and I intend to show this using Power Query. To begin, I extract my data to Power Query using ‘From Table’ in the ‘Get & Transform’ section of the Data tab.
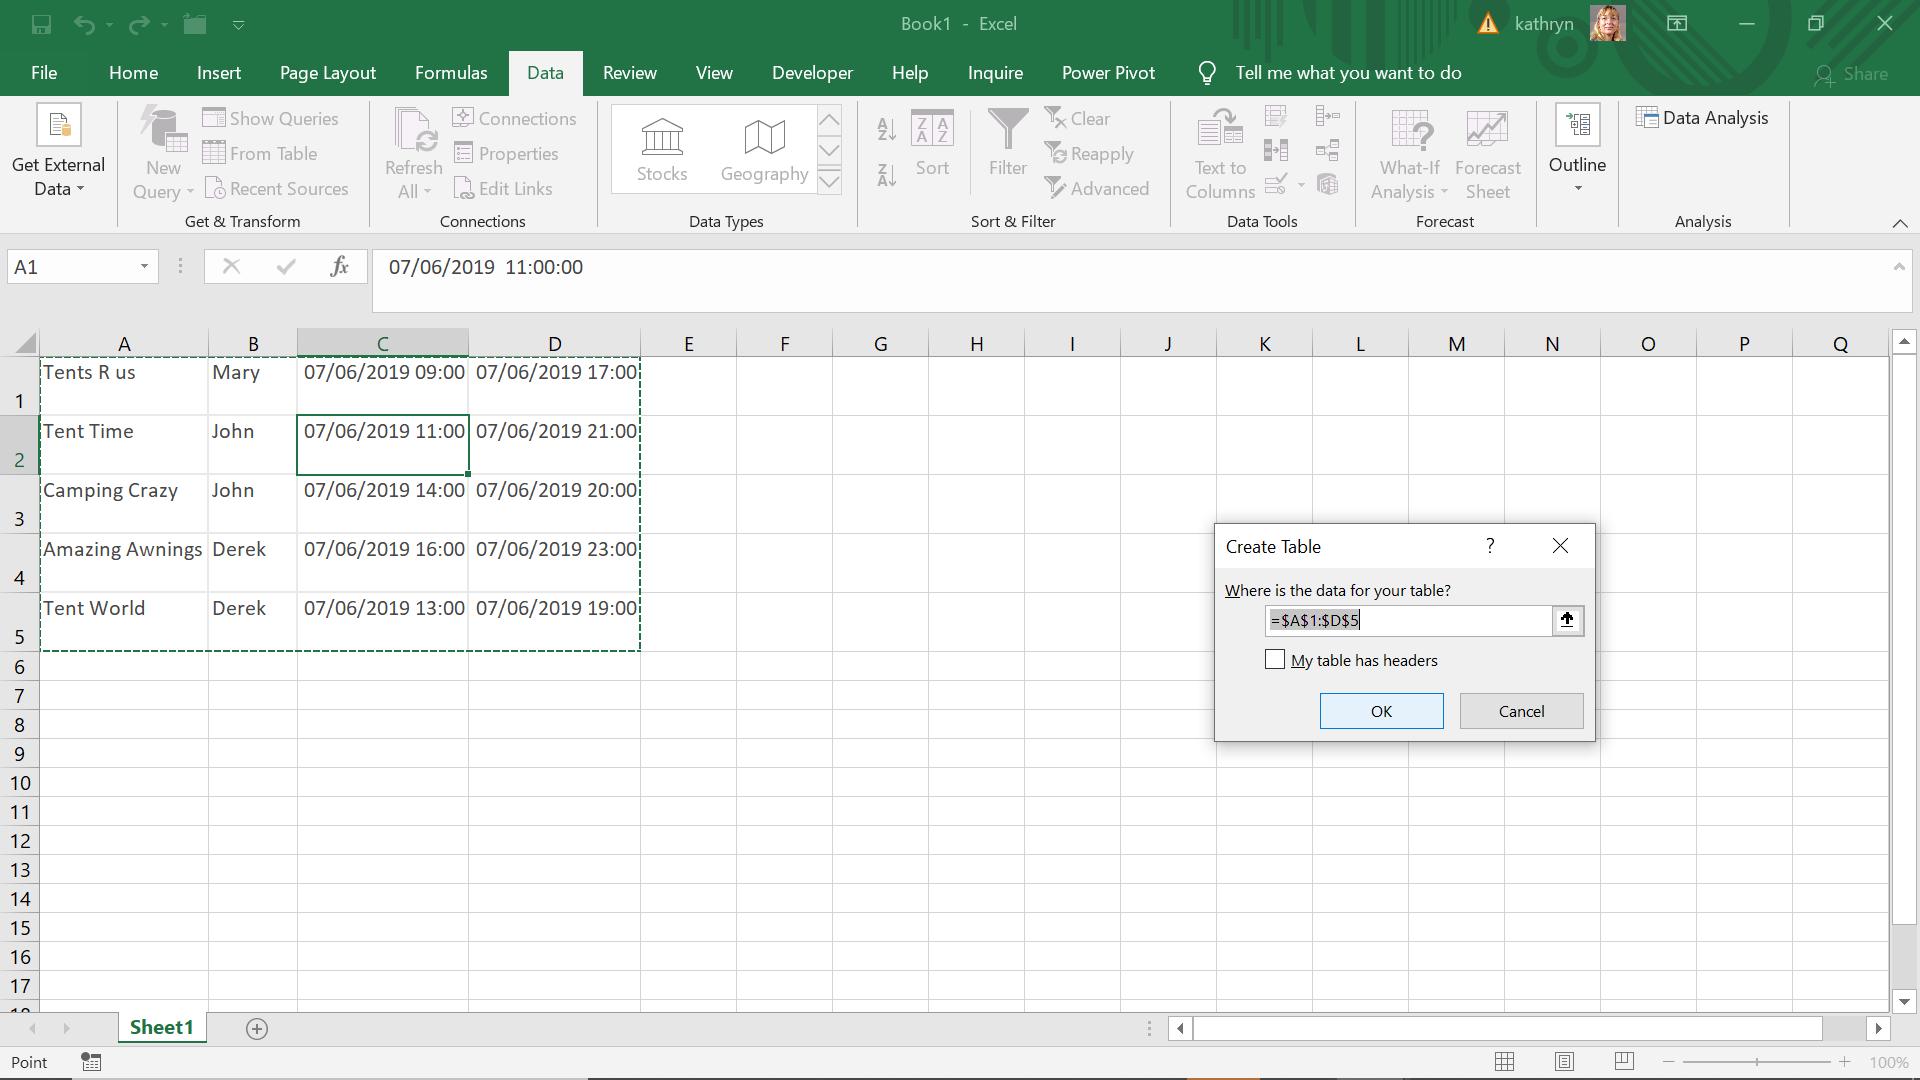
I will name the headings once I get into Power Query.
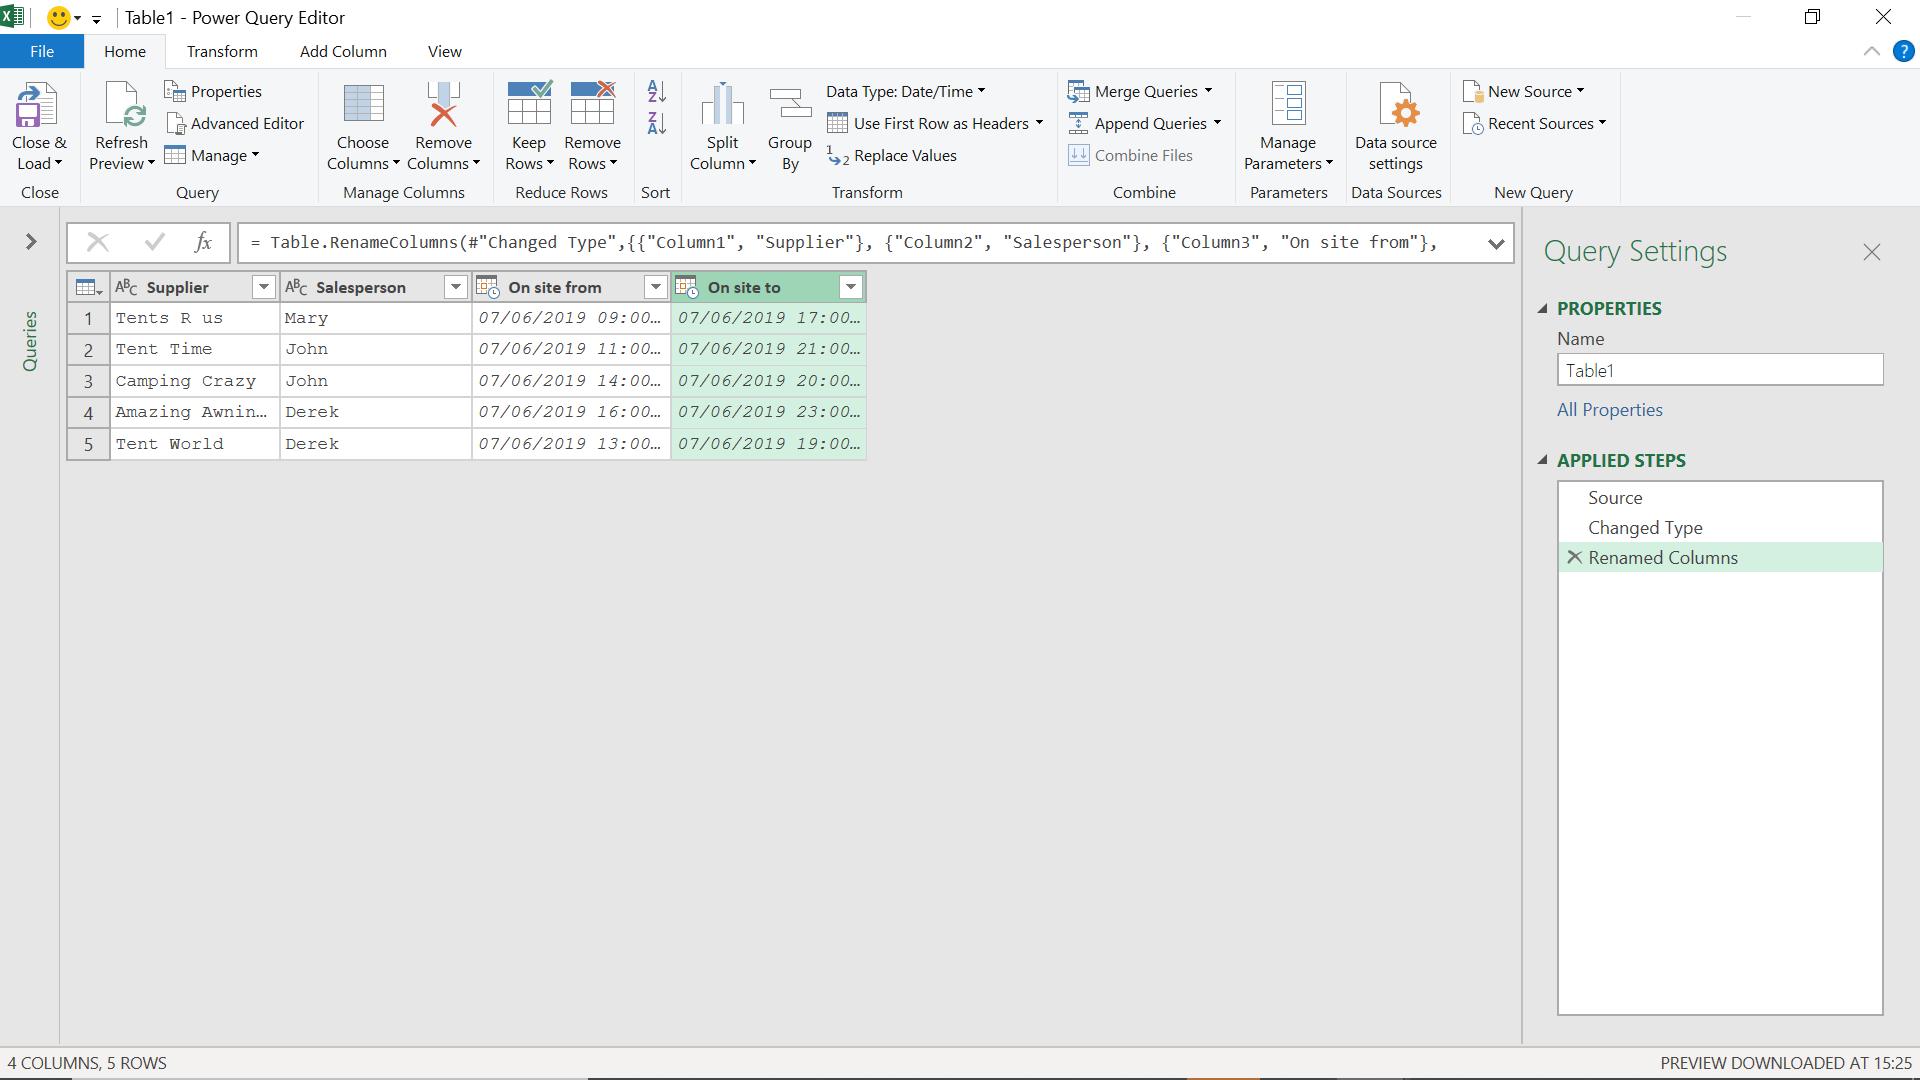
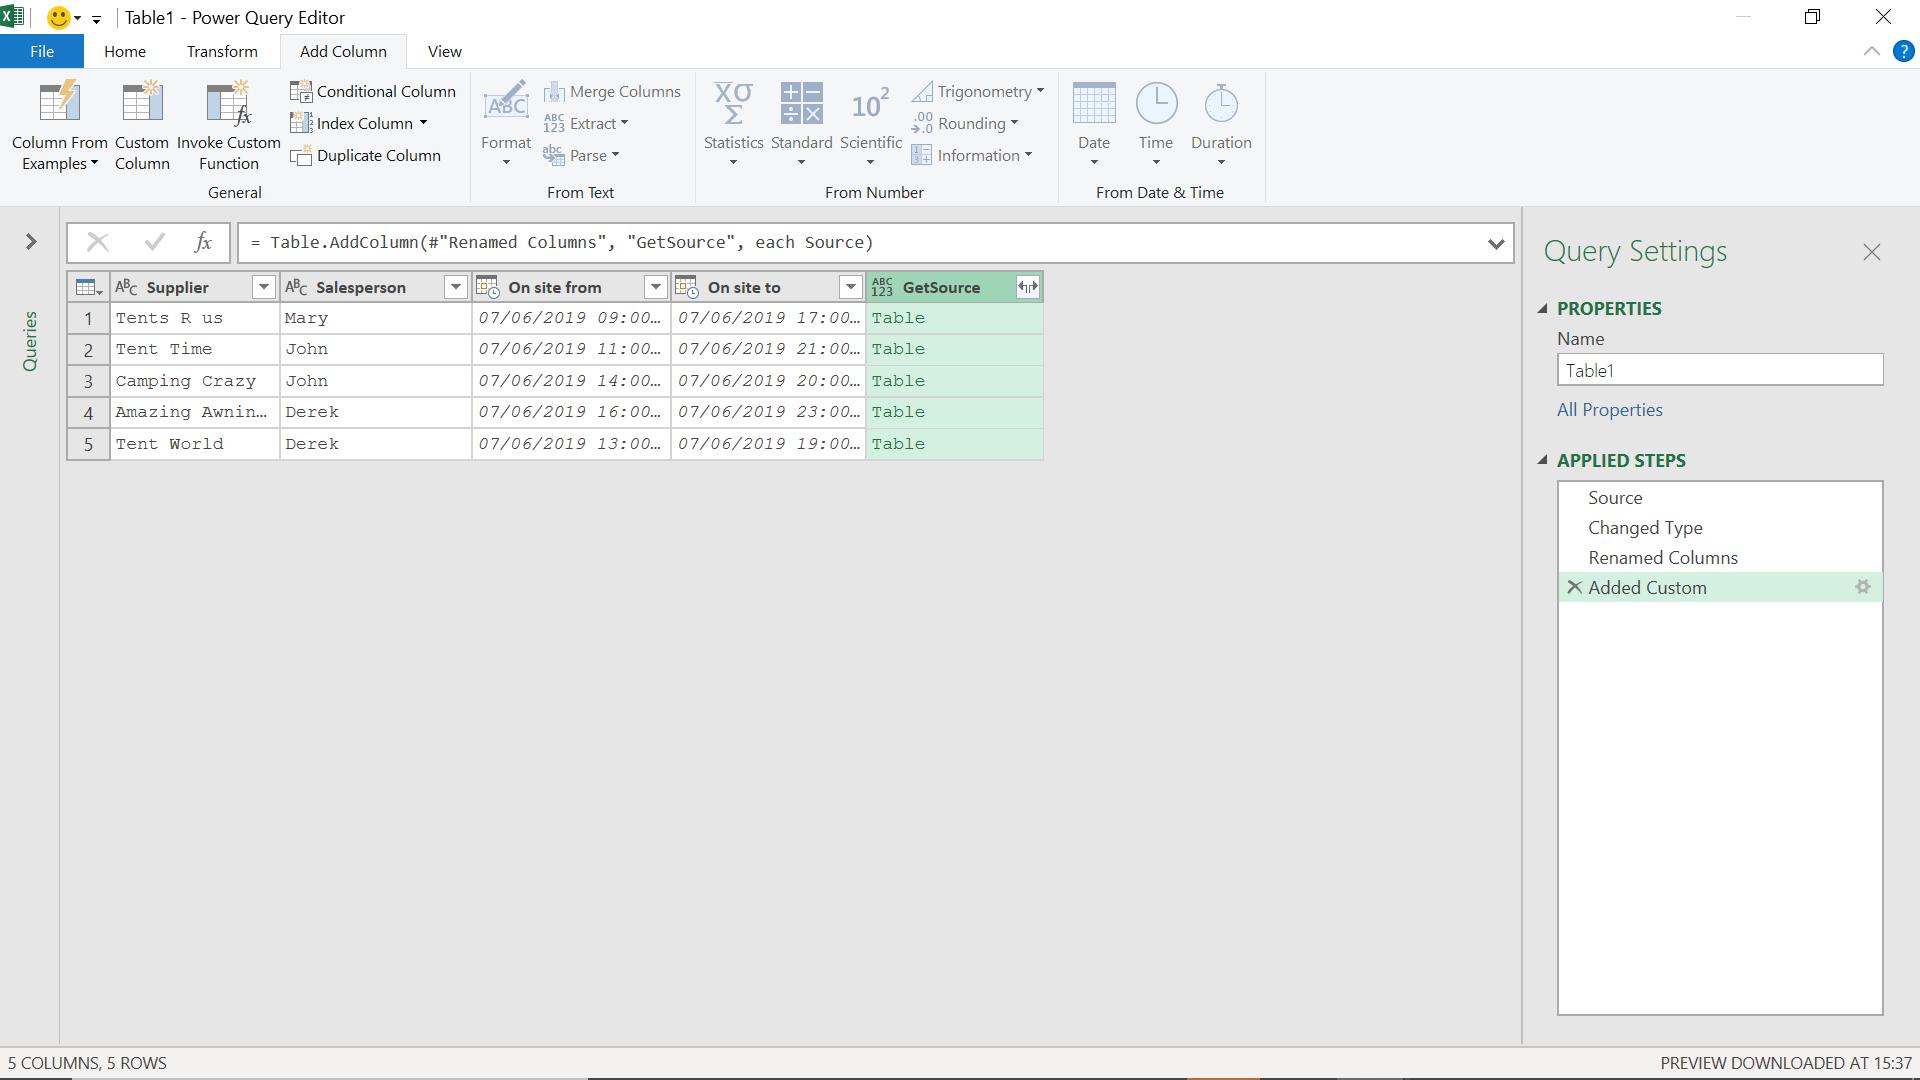
I need to calculate the overlapping time for each salesperson. To do this, I create a new column based on the source so that I may compare rows.
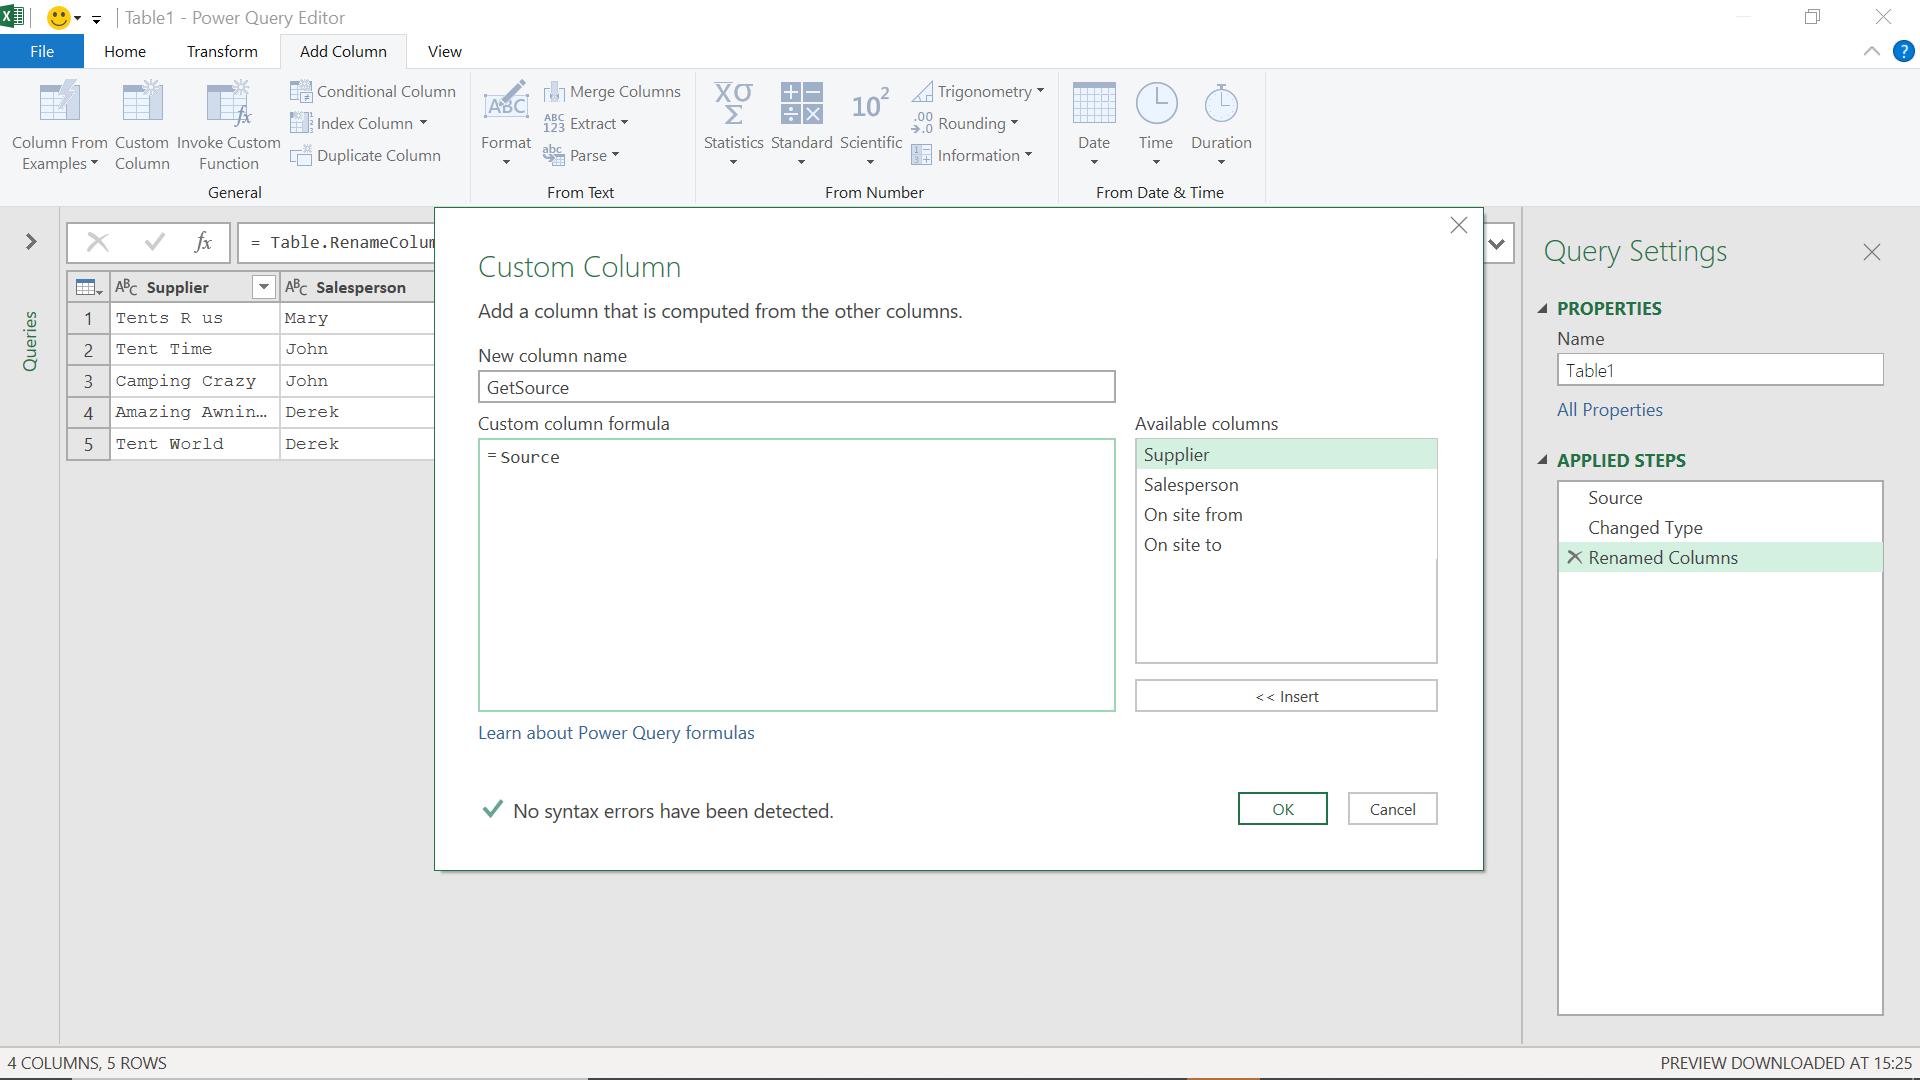
I access ‘Custom Column’ from the ‘Add Column’ tab.
Next, I expand GetSource and just for once, I want to use the column name as a prefix in my new columns.
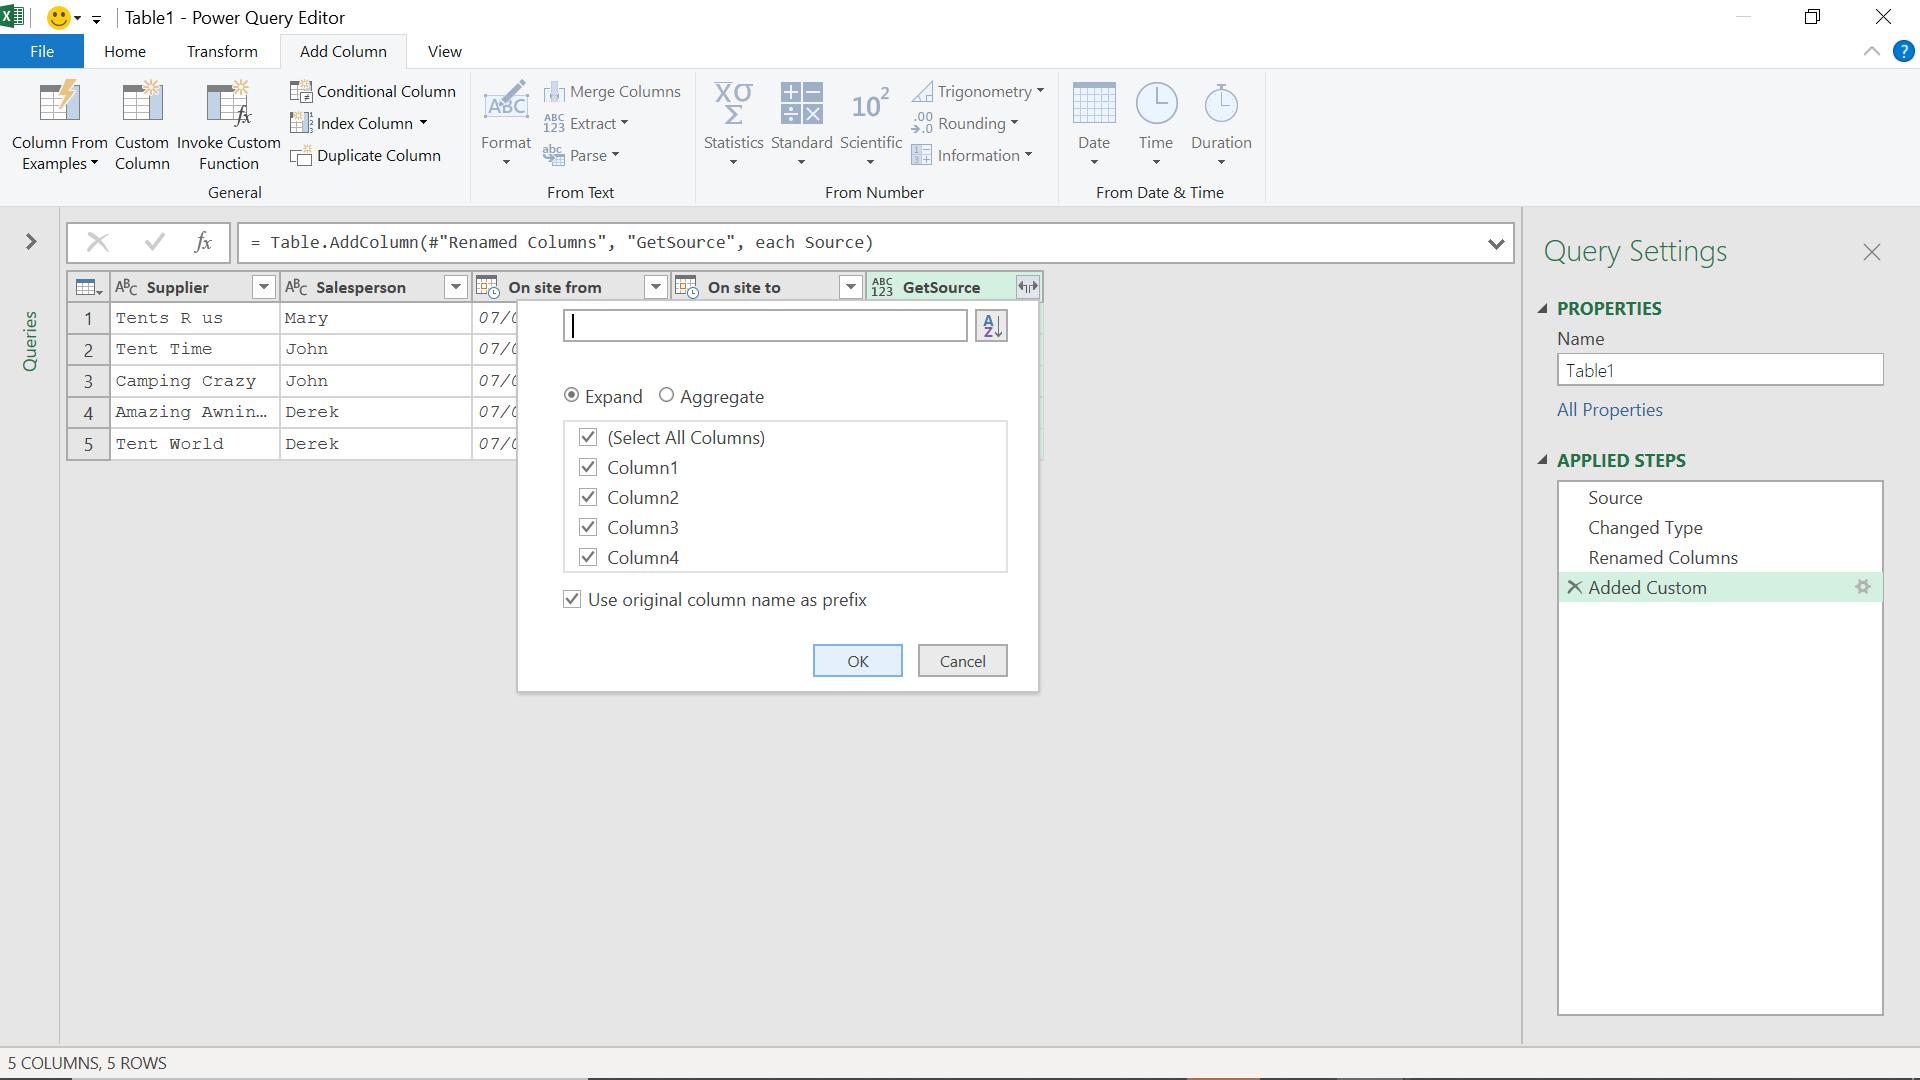
I click OK to create my new columns.
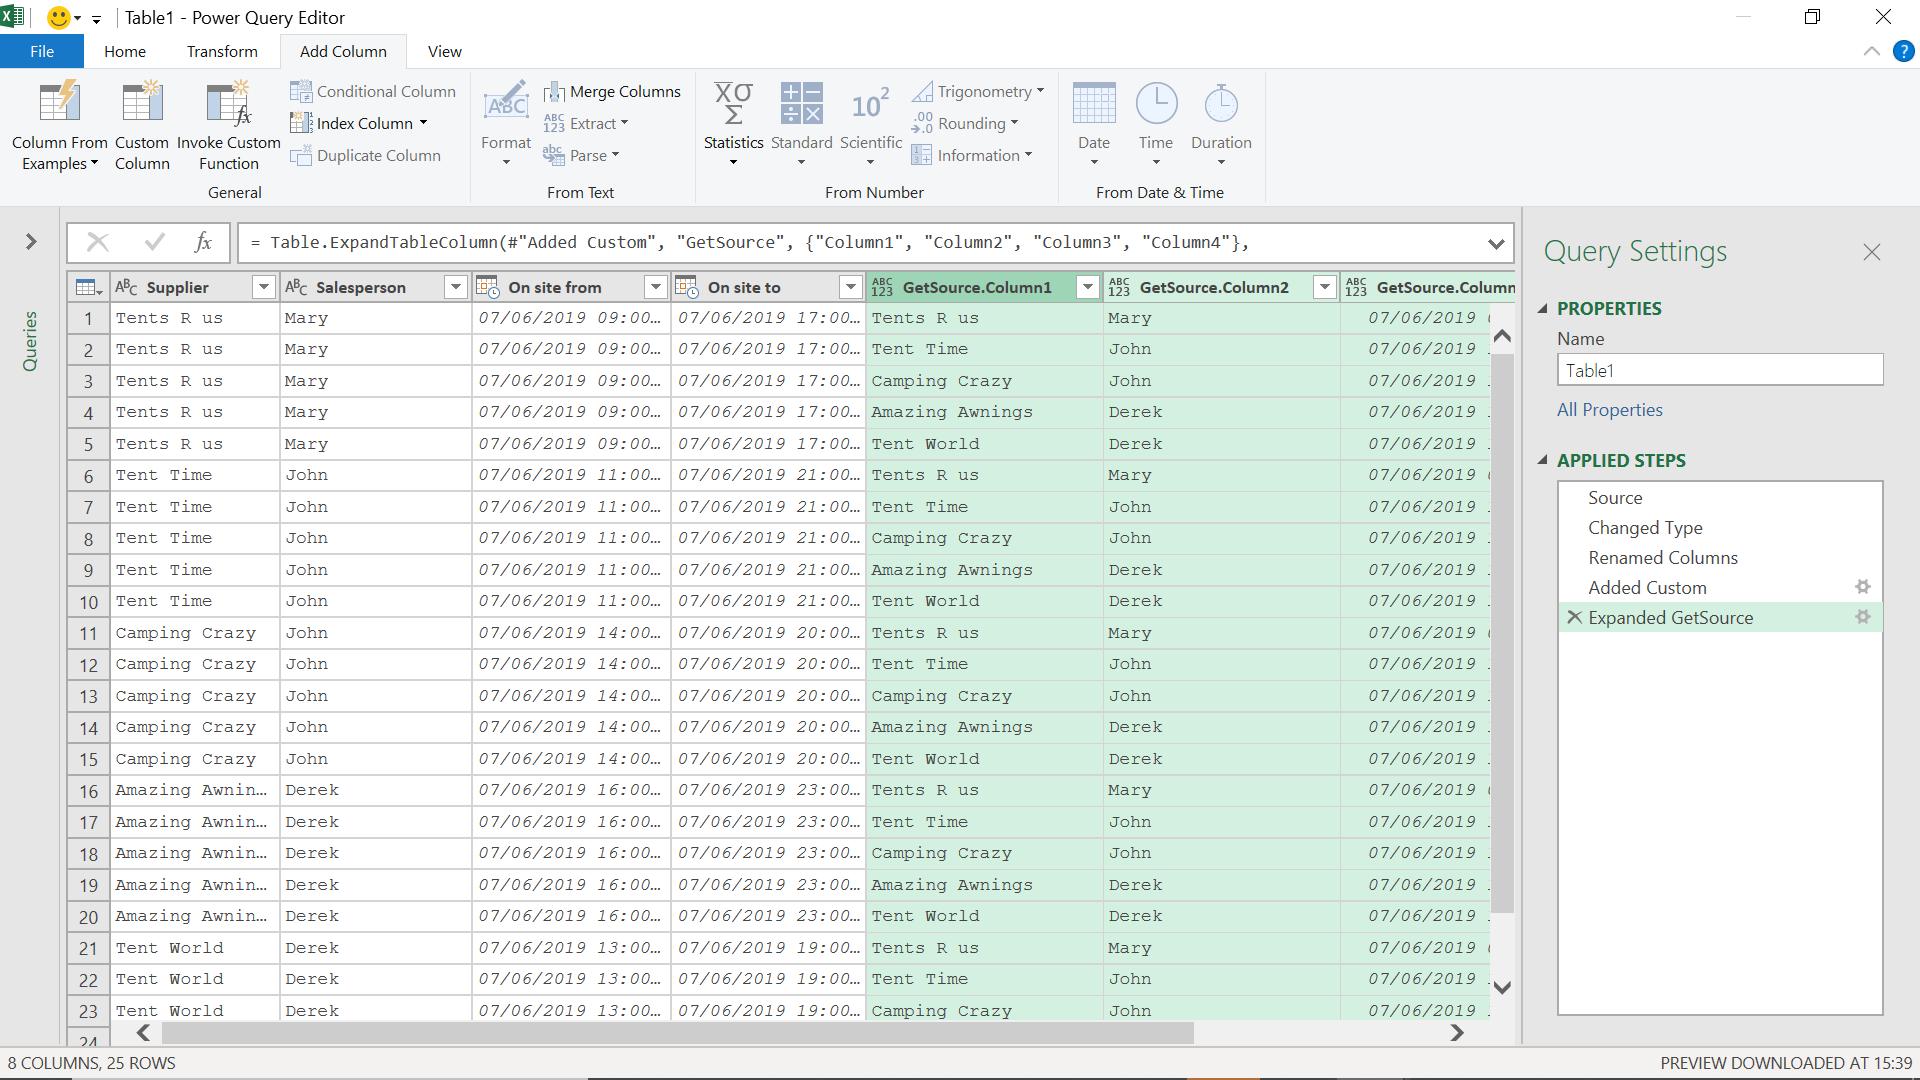
I now have a product of my columns, so instead of five rows I now have 25. Next week, I will look at a way of doing this where I don’t create all 25 rows. However, let’s continue for this week.
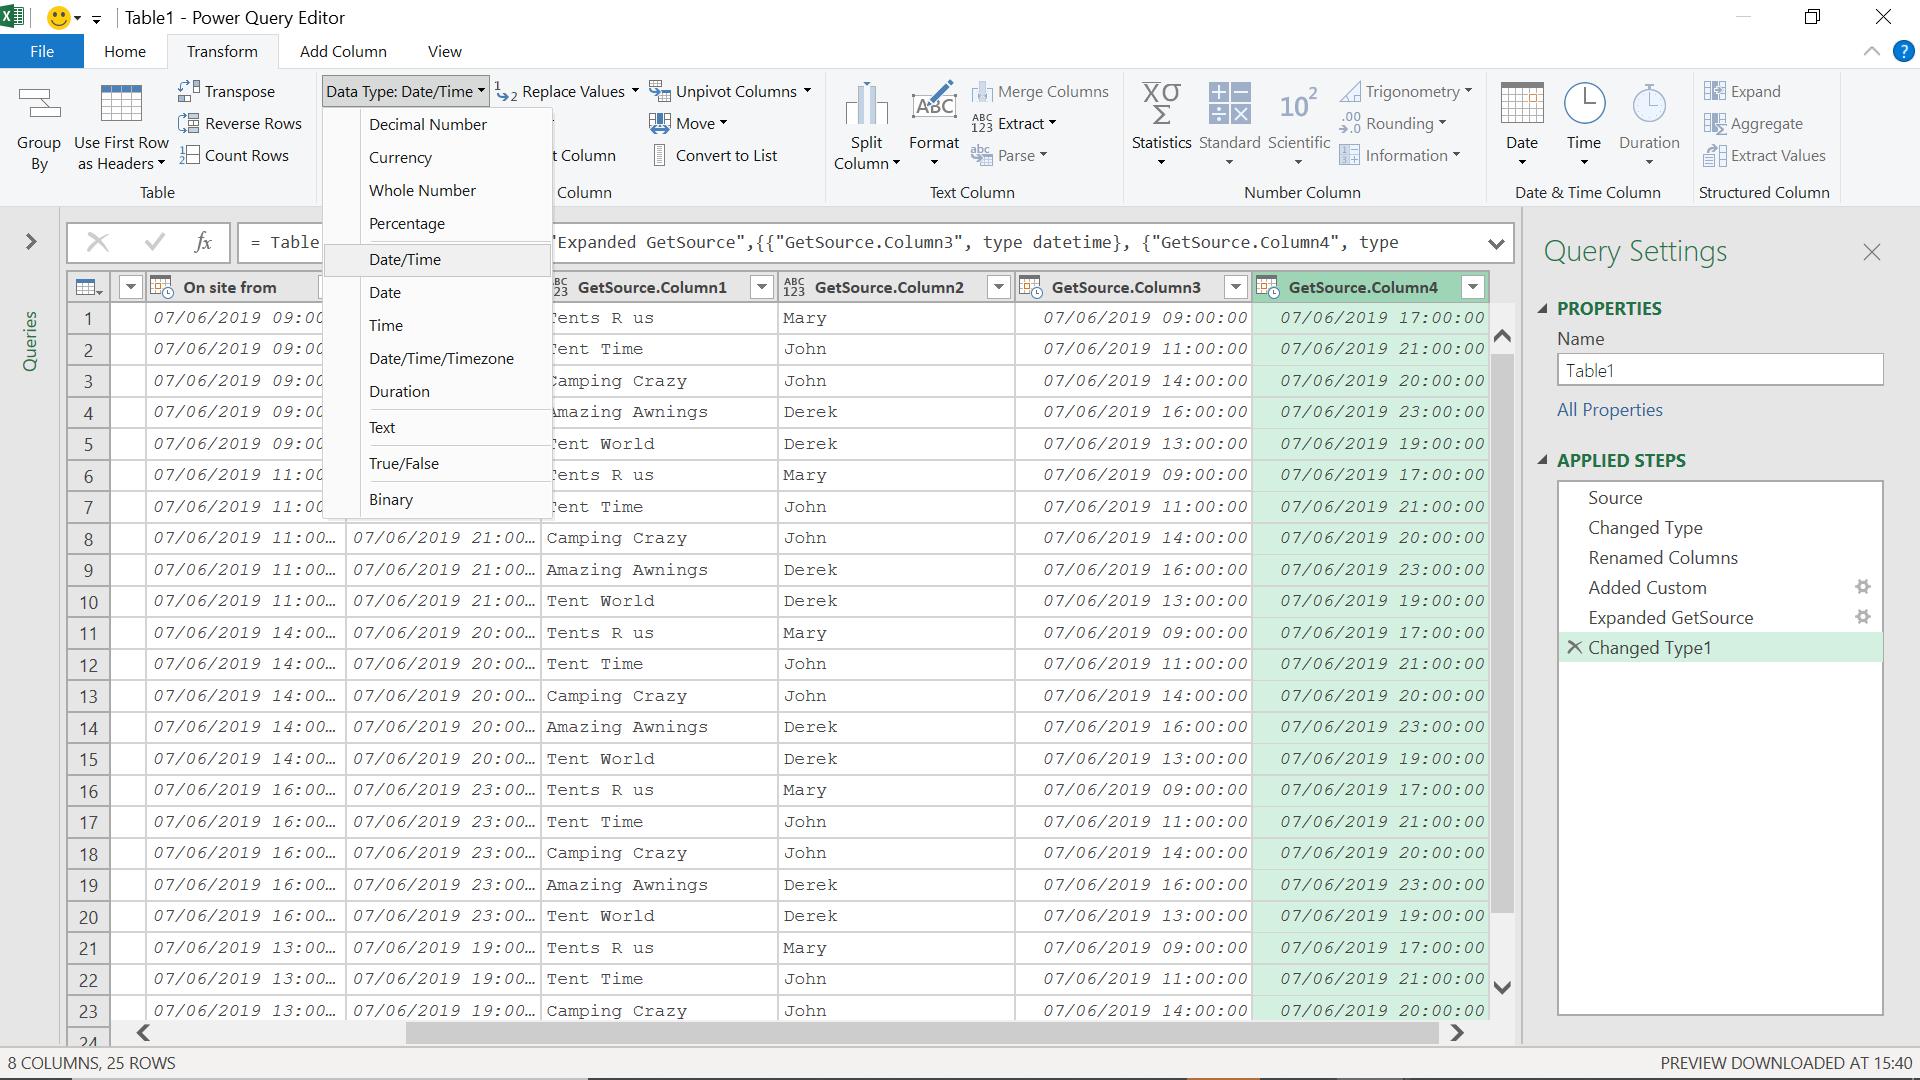
The columns GetSource.Column3 and GetSource.Column4 should be type DateTime, so I change the type on the Transform tab.
I need to create a filtering step to pick those rows I need to make my comparison (i.e. those where the supplier is different so I may compare site times). To get the frame for my filter logic, I create a standard filter. I will then amend the M code.
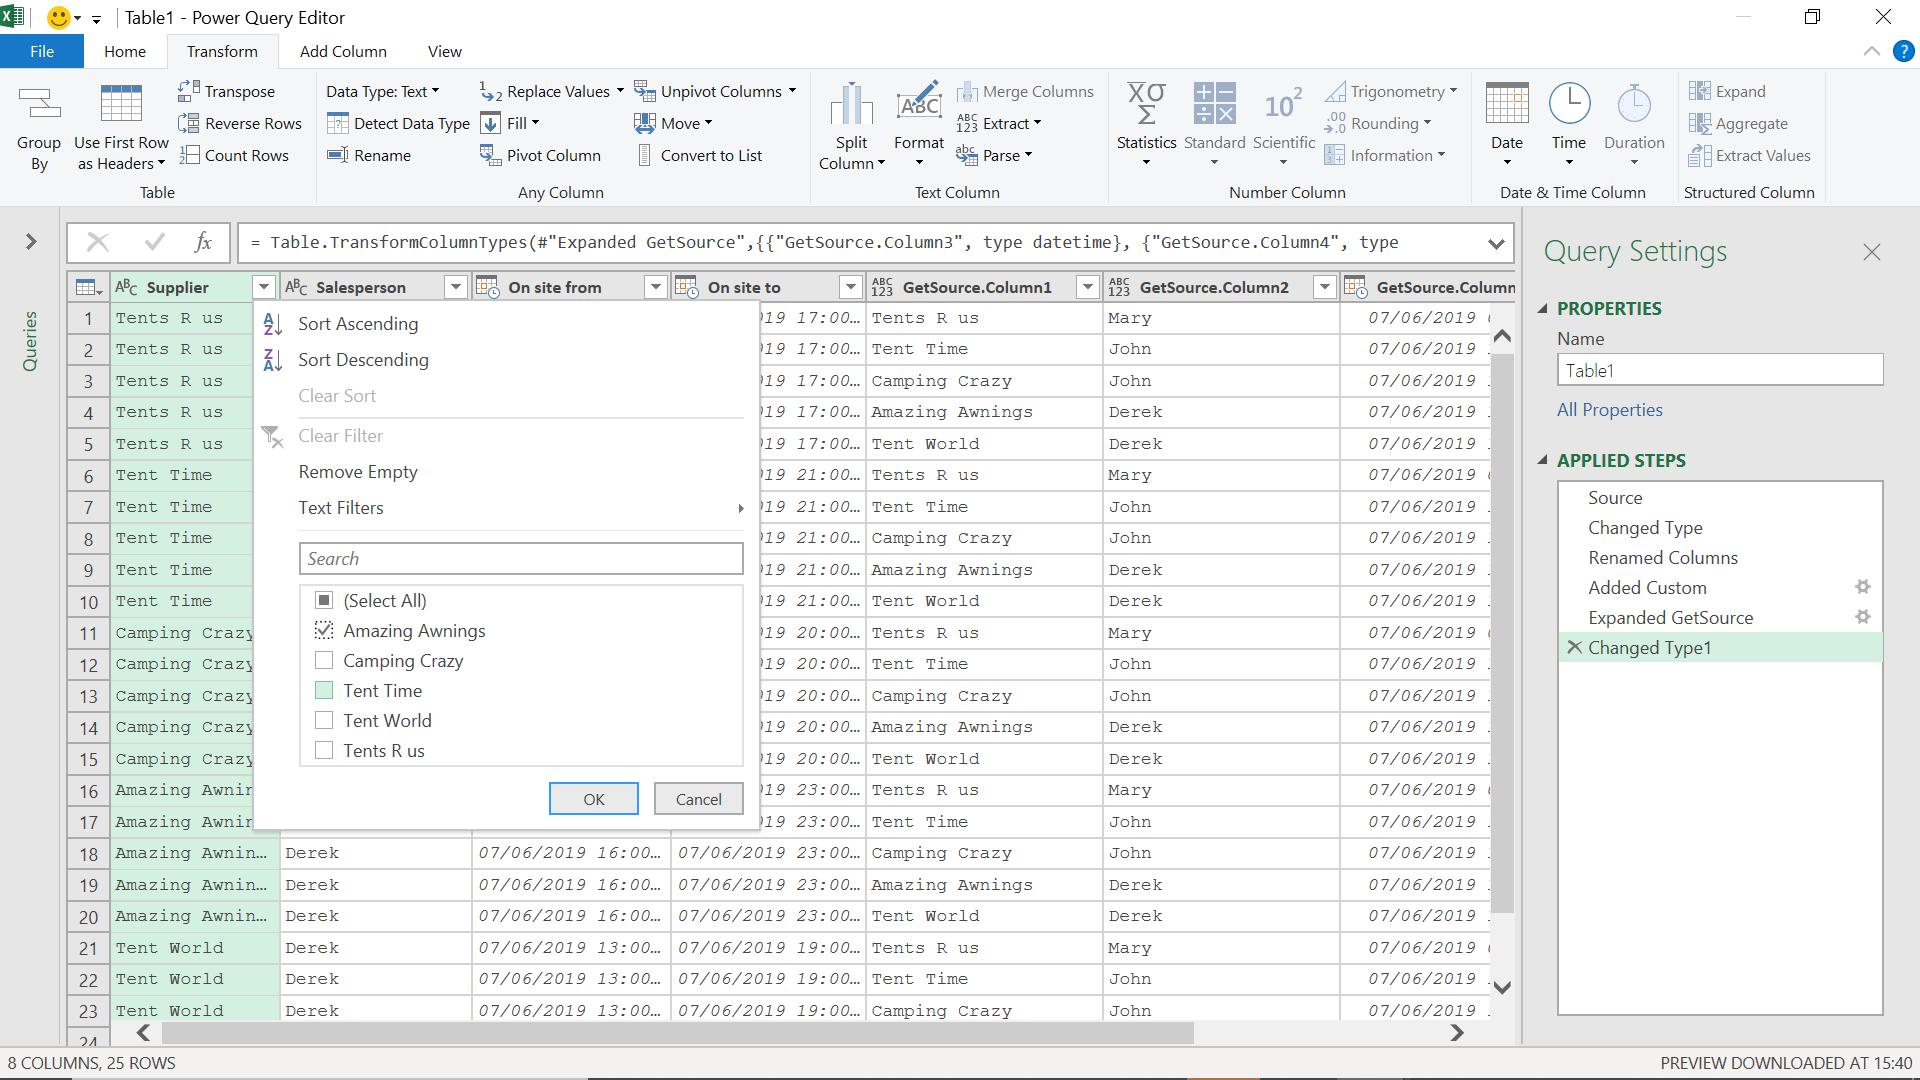
I choose to filter on ‘Amazing Awnings’ and click OK.
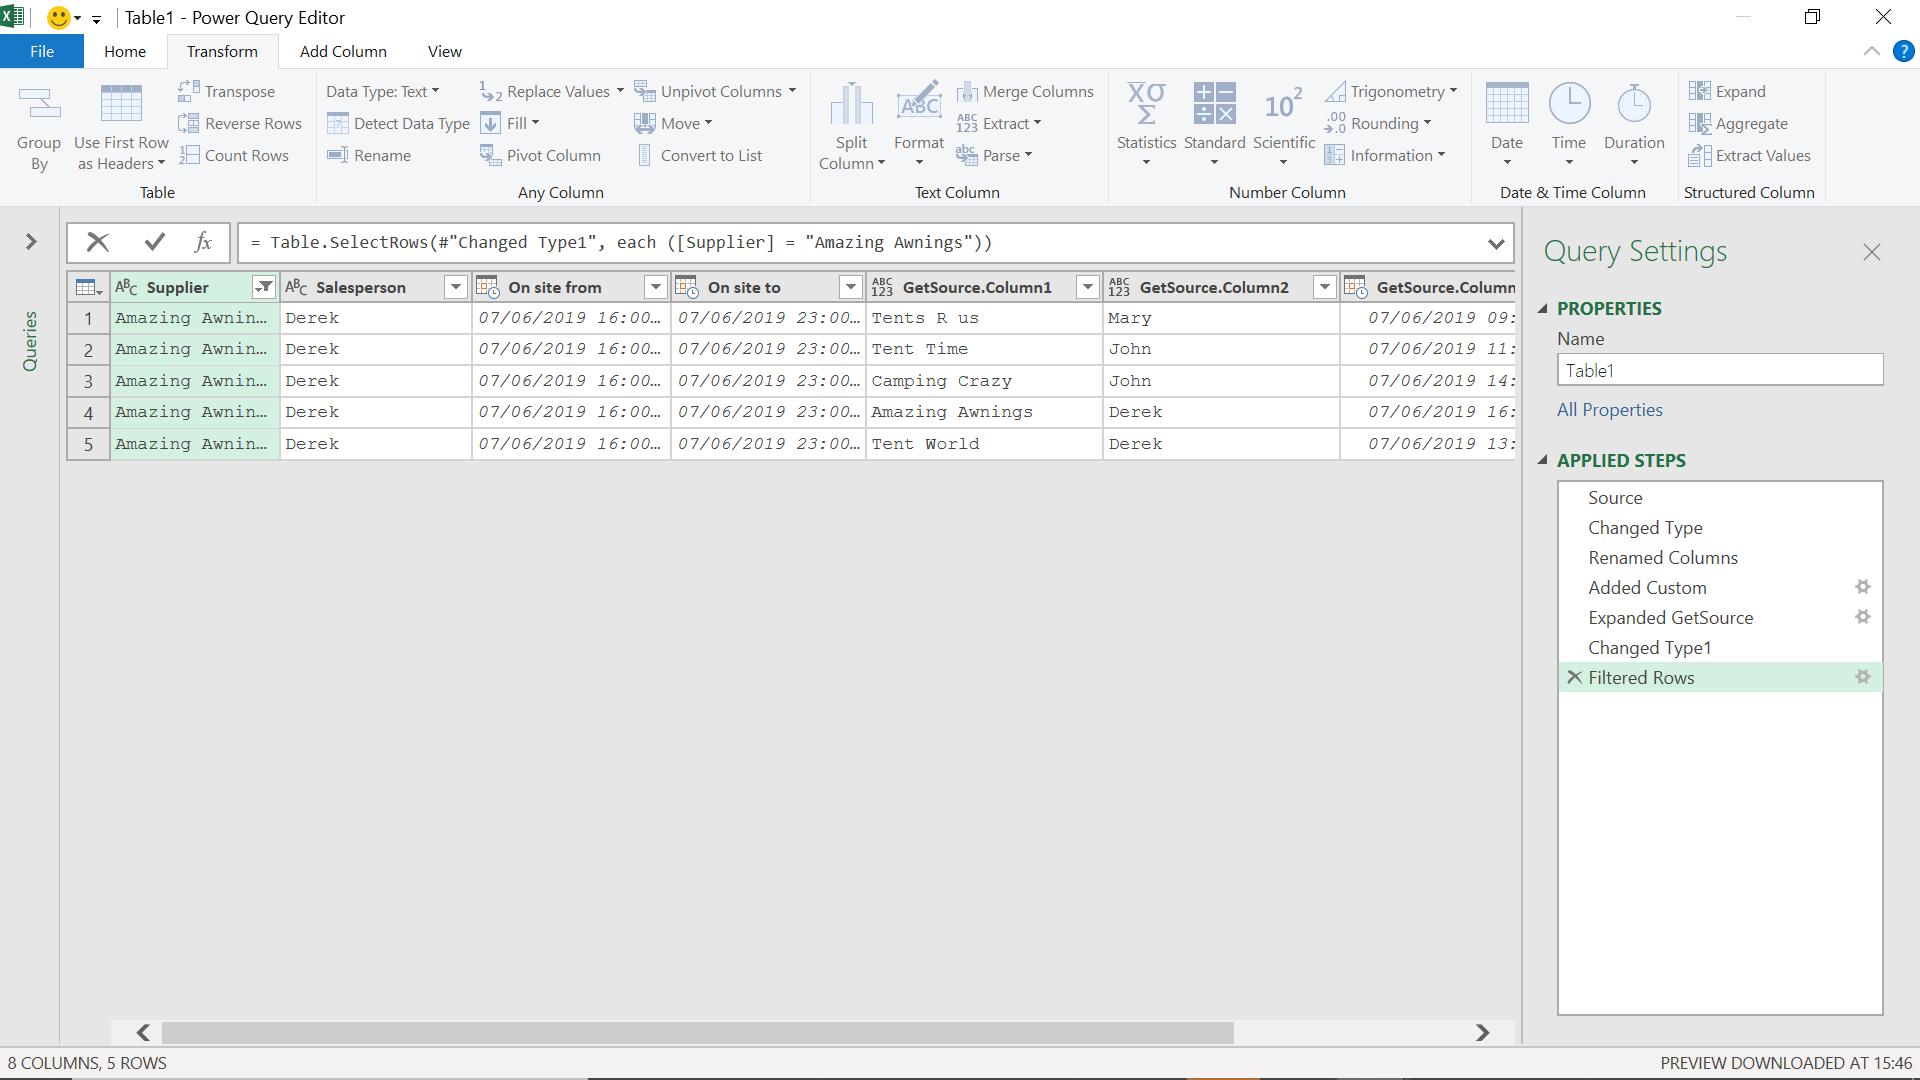
The M code for this step is
= Table.SelectRows(#"Changed Type1", each ([Supplier] = "Amazing Awnings"))
I need to change this to
= Table.SelectRows(#"Changed Type1", each ([Supplier] <> [GetSource.Column1] and
[Salesperson] = [GetSource.Column3]))
This will result in rows where the supplier is different, but the salesperson is the same
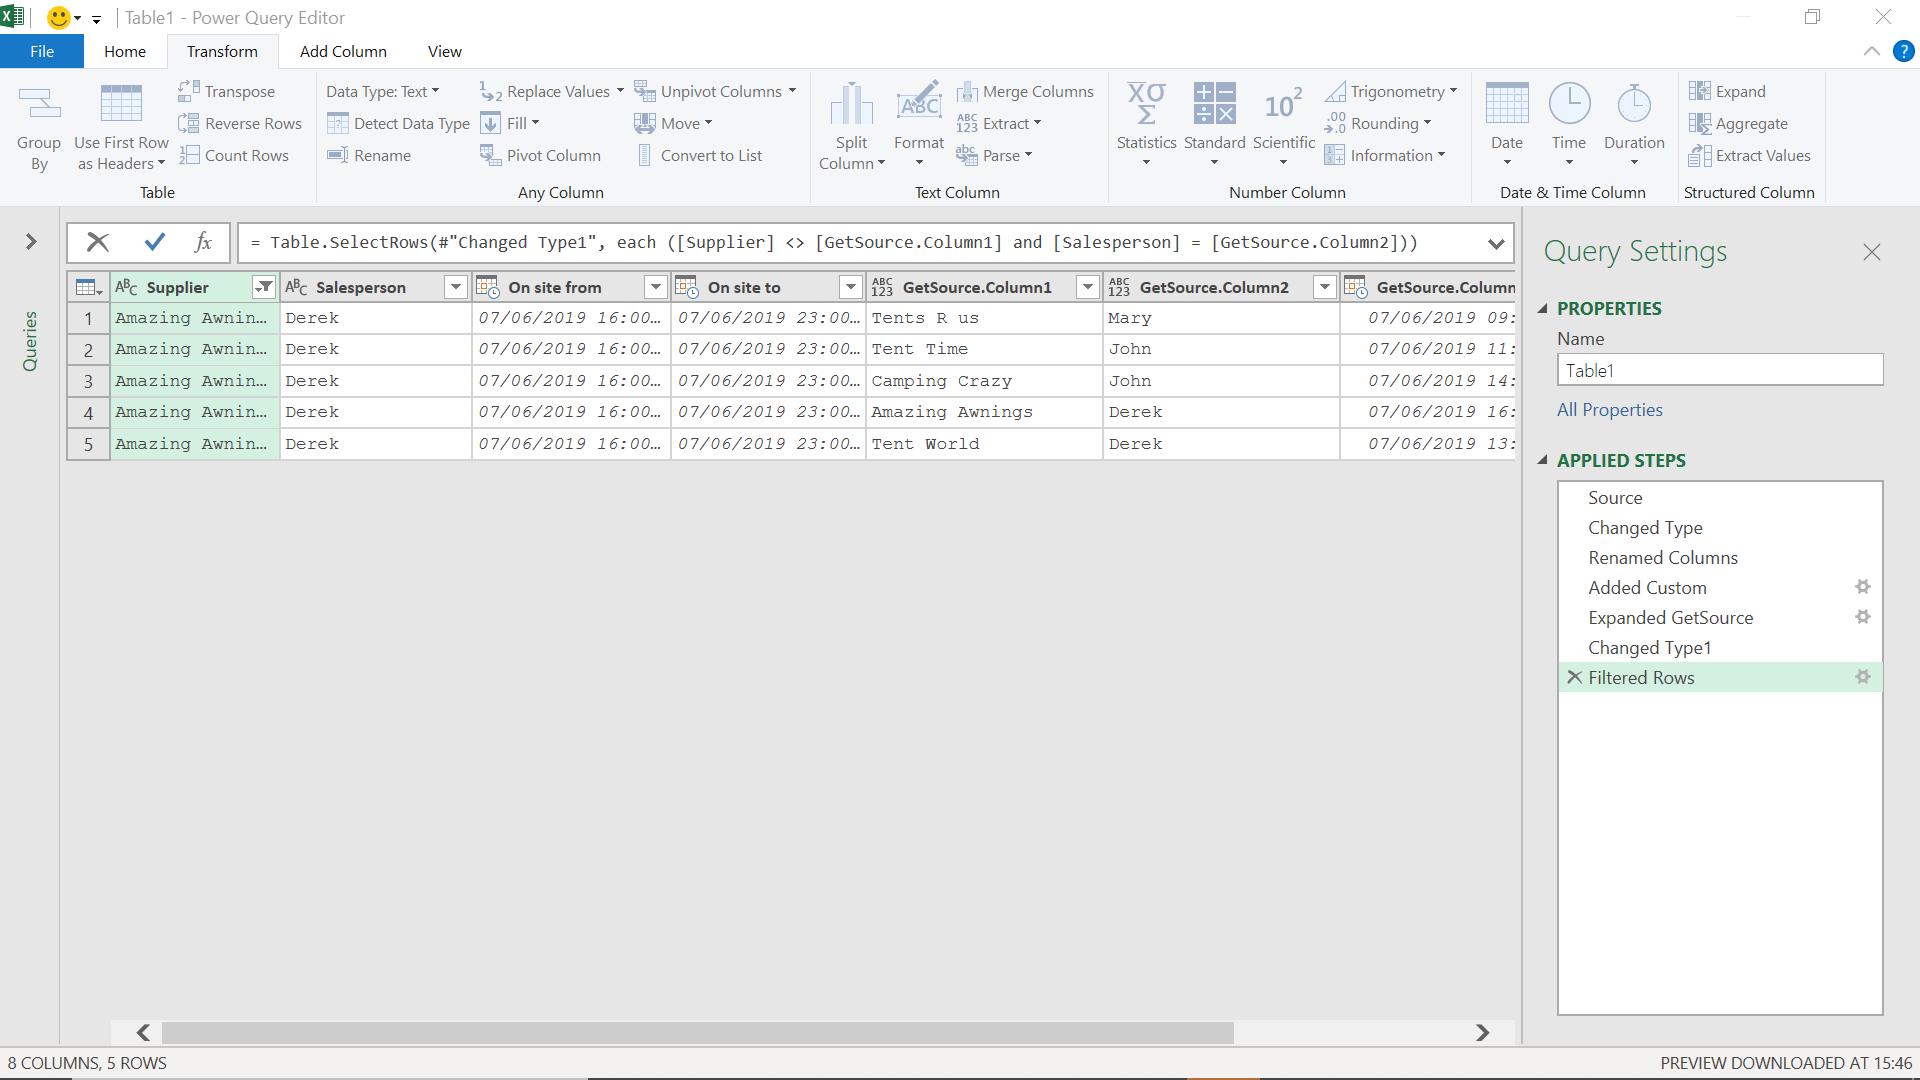
I click on the tick icon to enter my changed step.
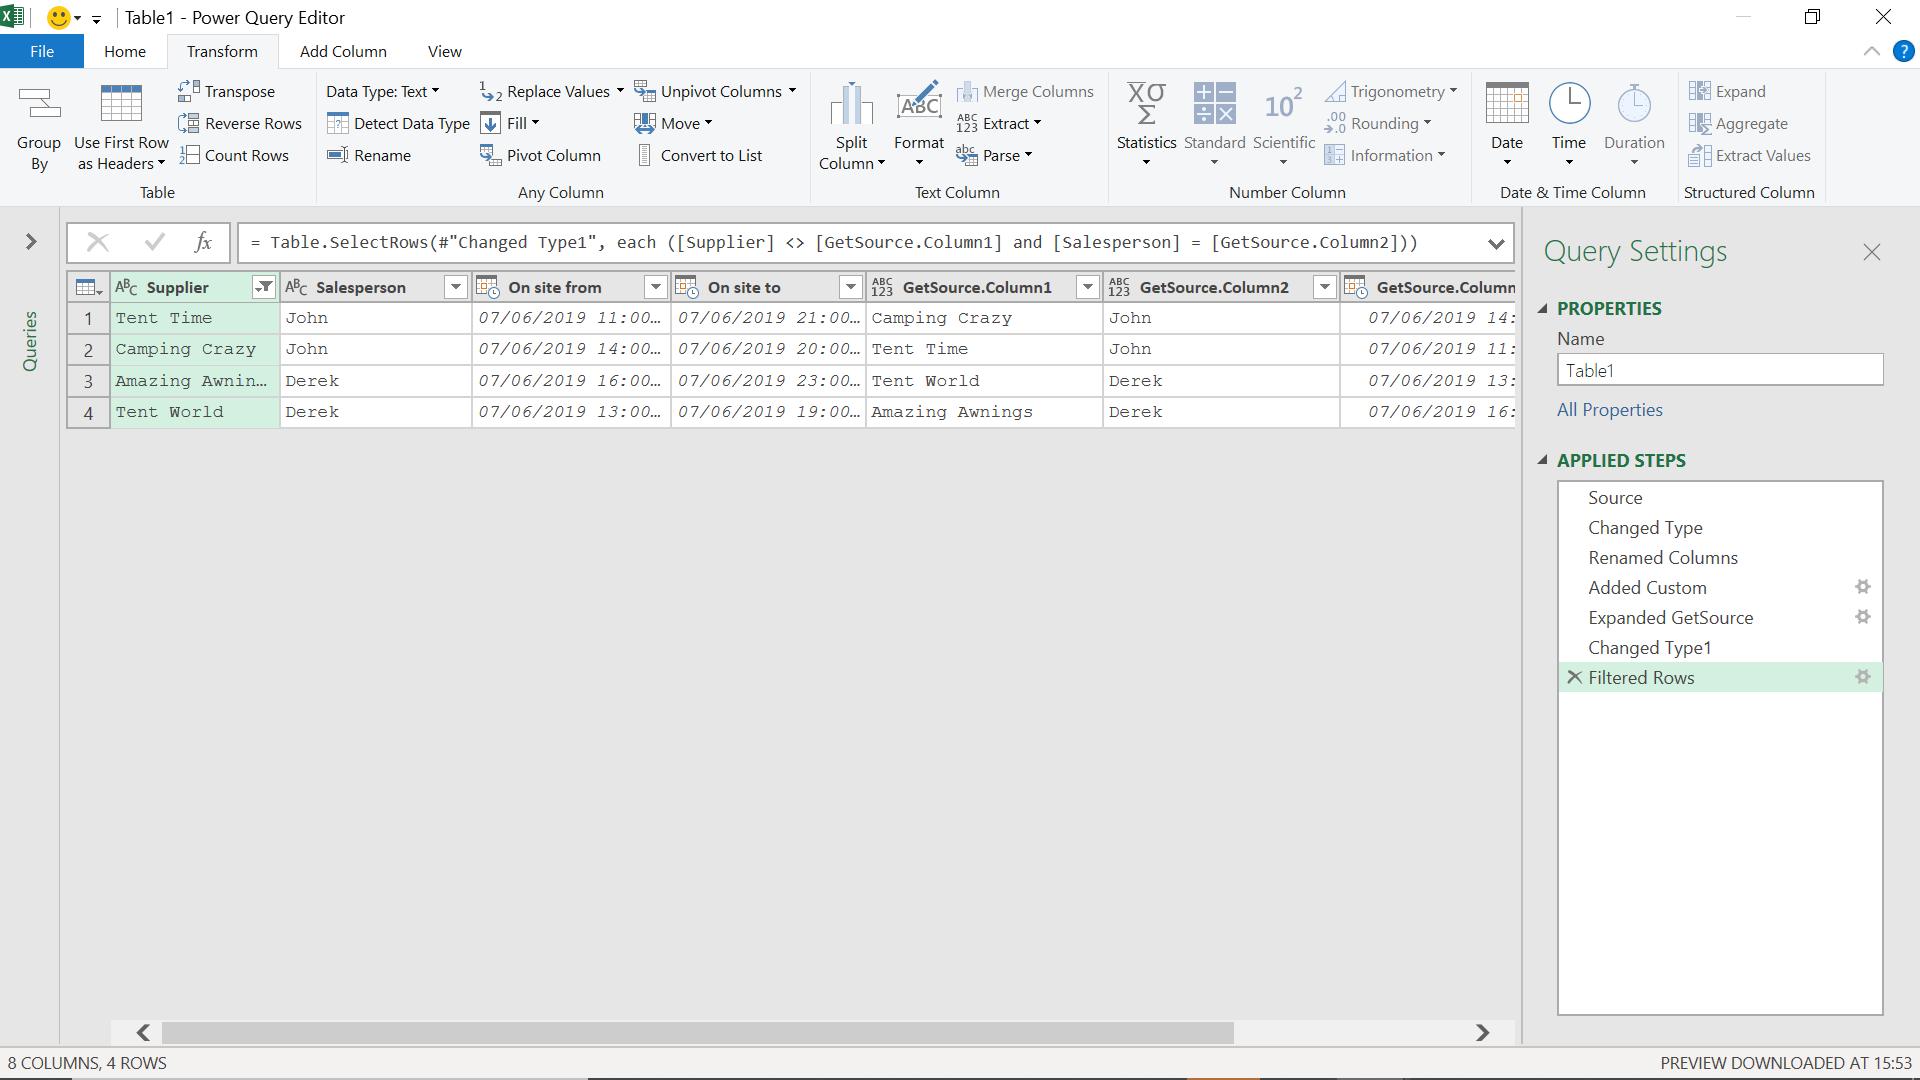
I can see that John and Derek have some overlapping time on site.
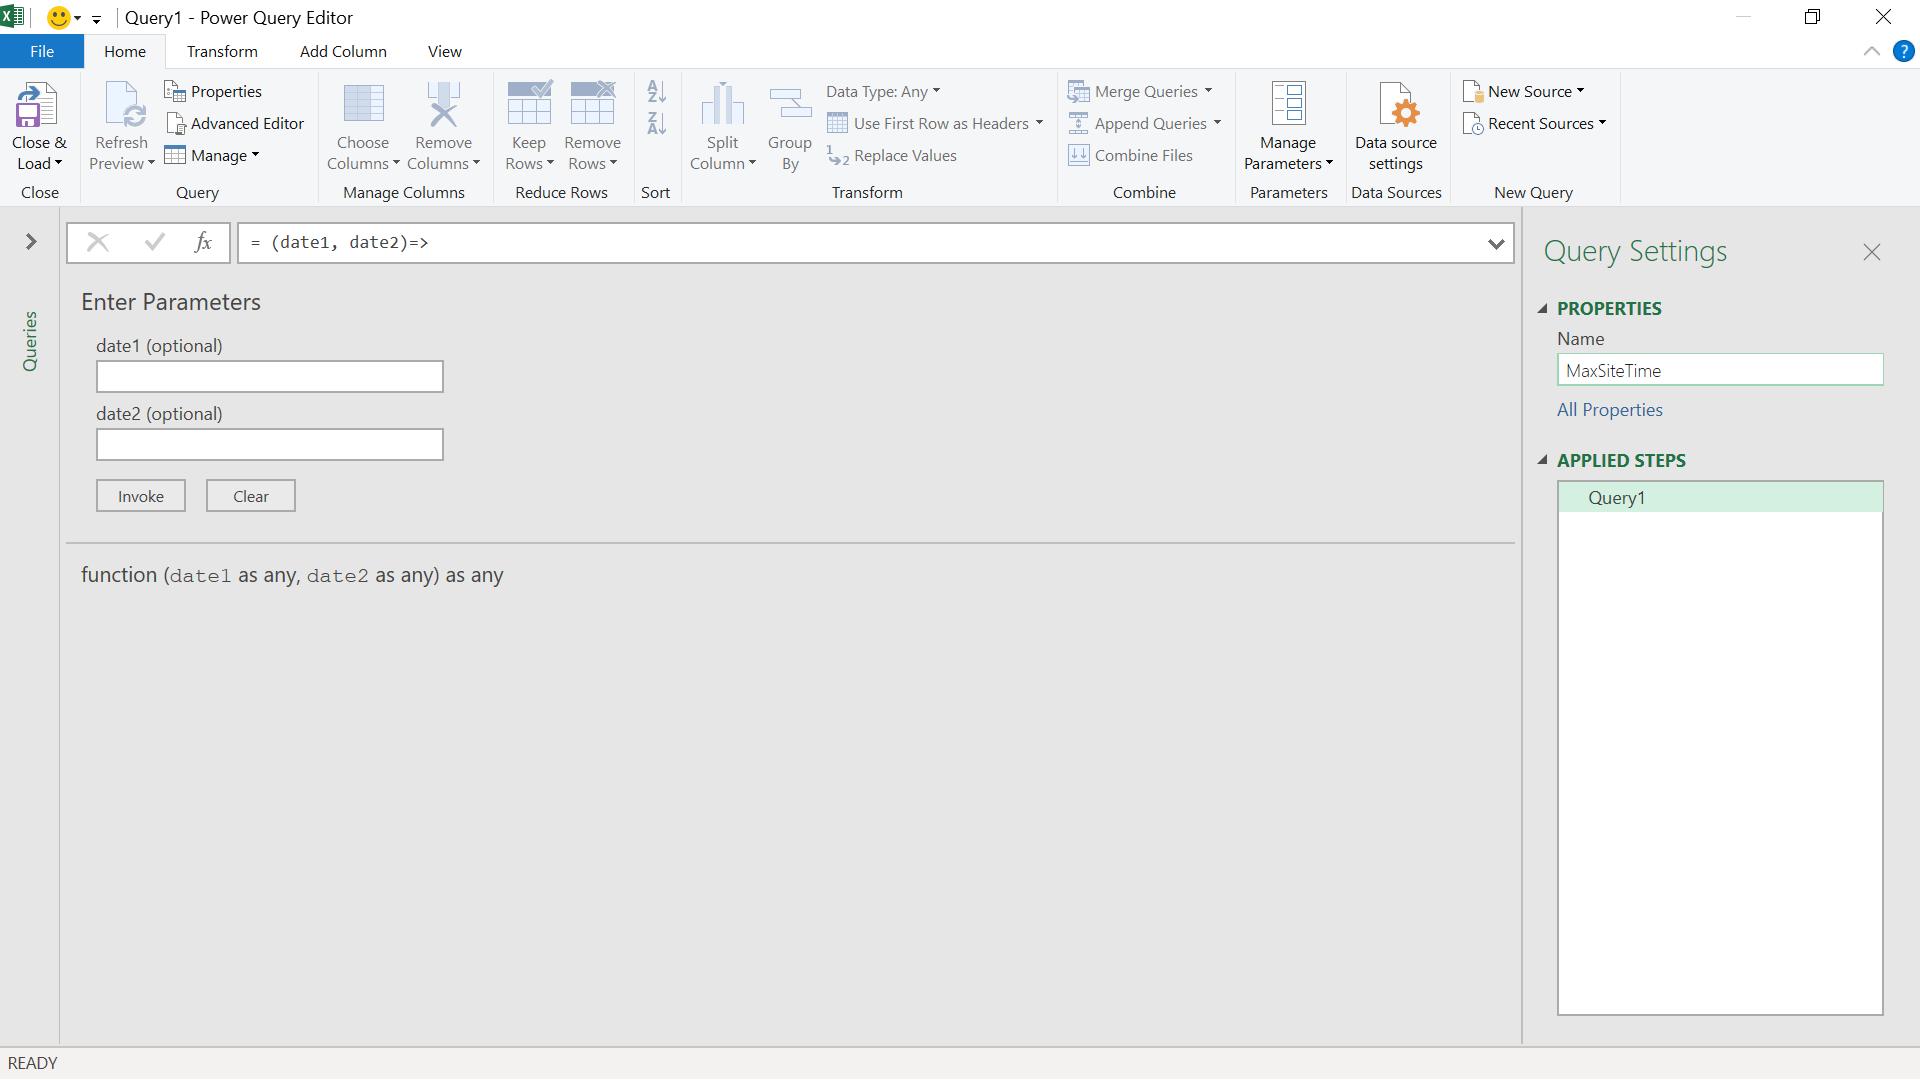
In order to calculate the overlapping time on site, I will create functions to find the MinSiteTime and MaxSiteTime to apply to my ‘on site’ columns. I close and load my current query, and create a new blank query from the ‘New Query’ dropdown:
In the Advanced Editor of my new blank query, I add some M code:
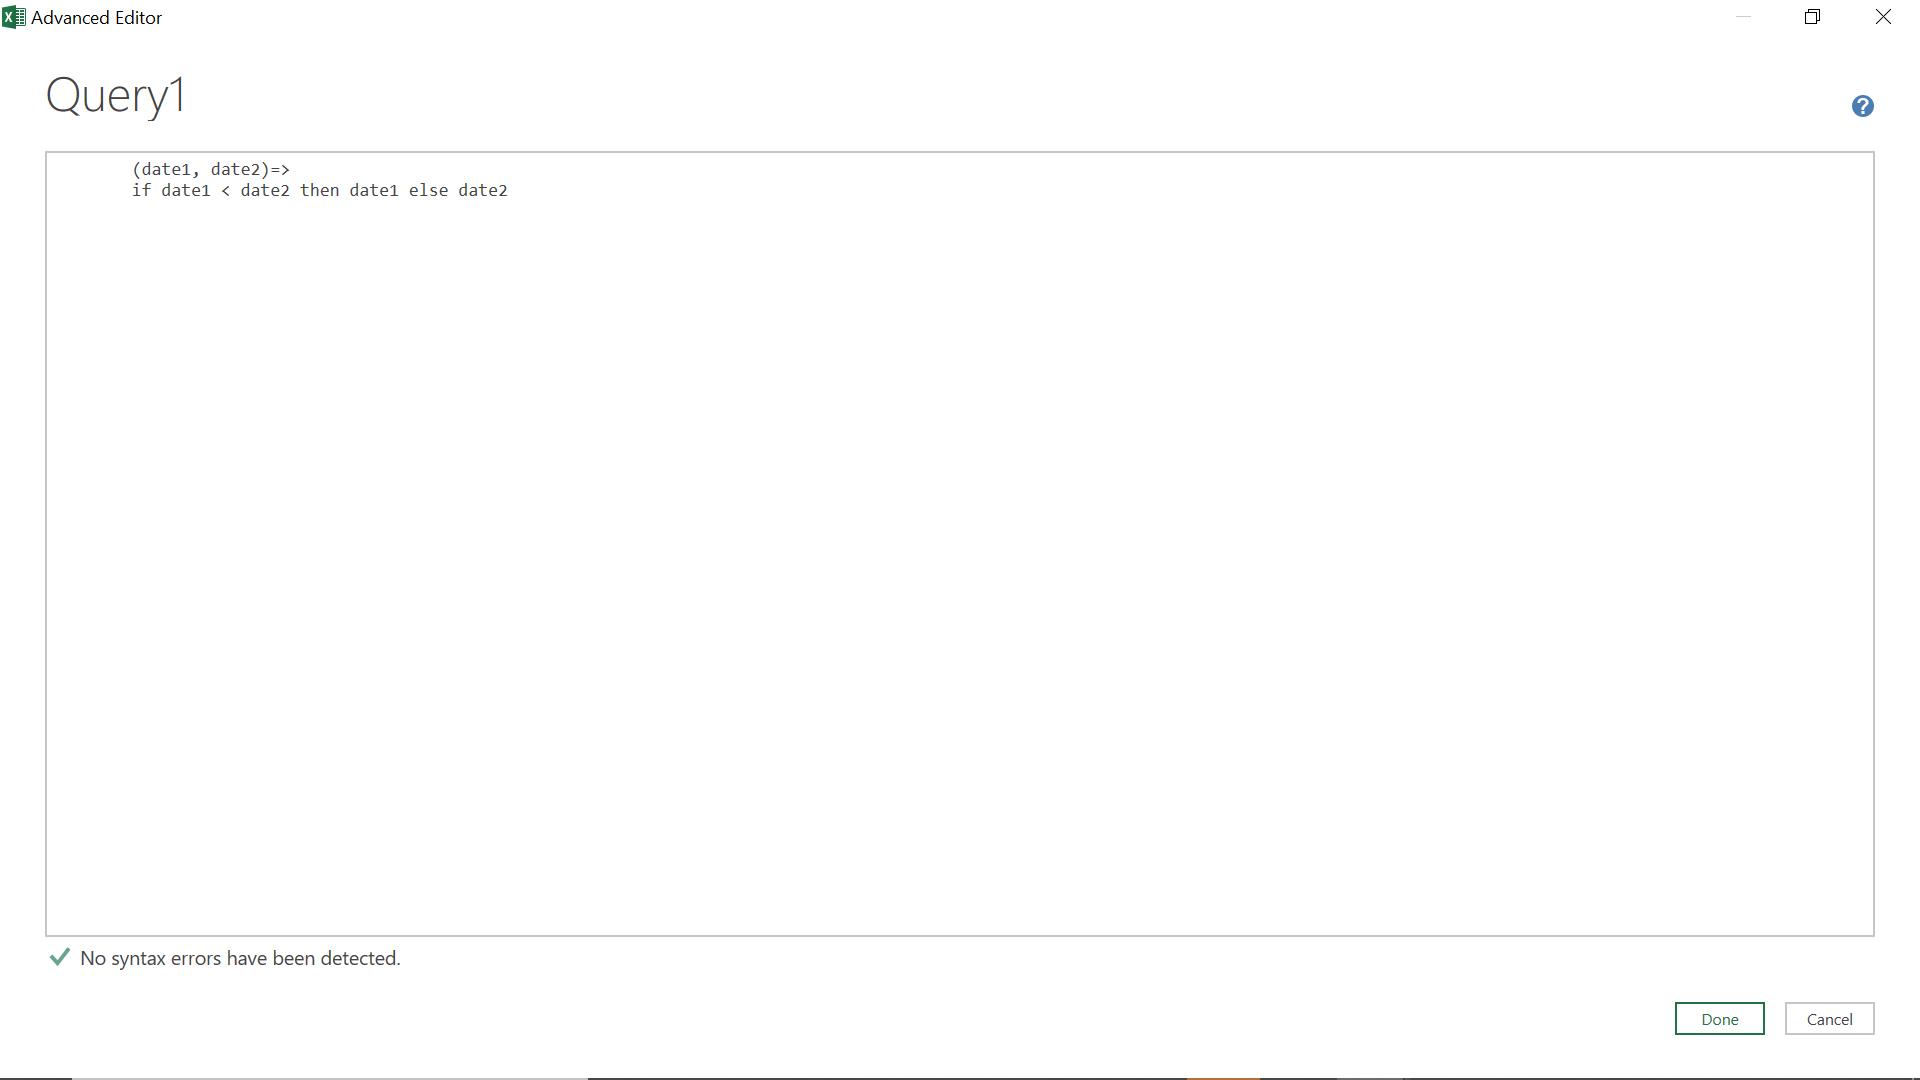
The M code I have added is
(date1, date2)=>
if date1 < date2 then date1 else date2
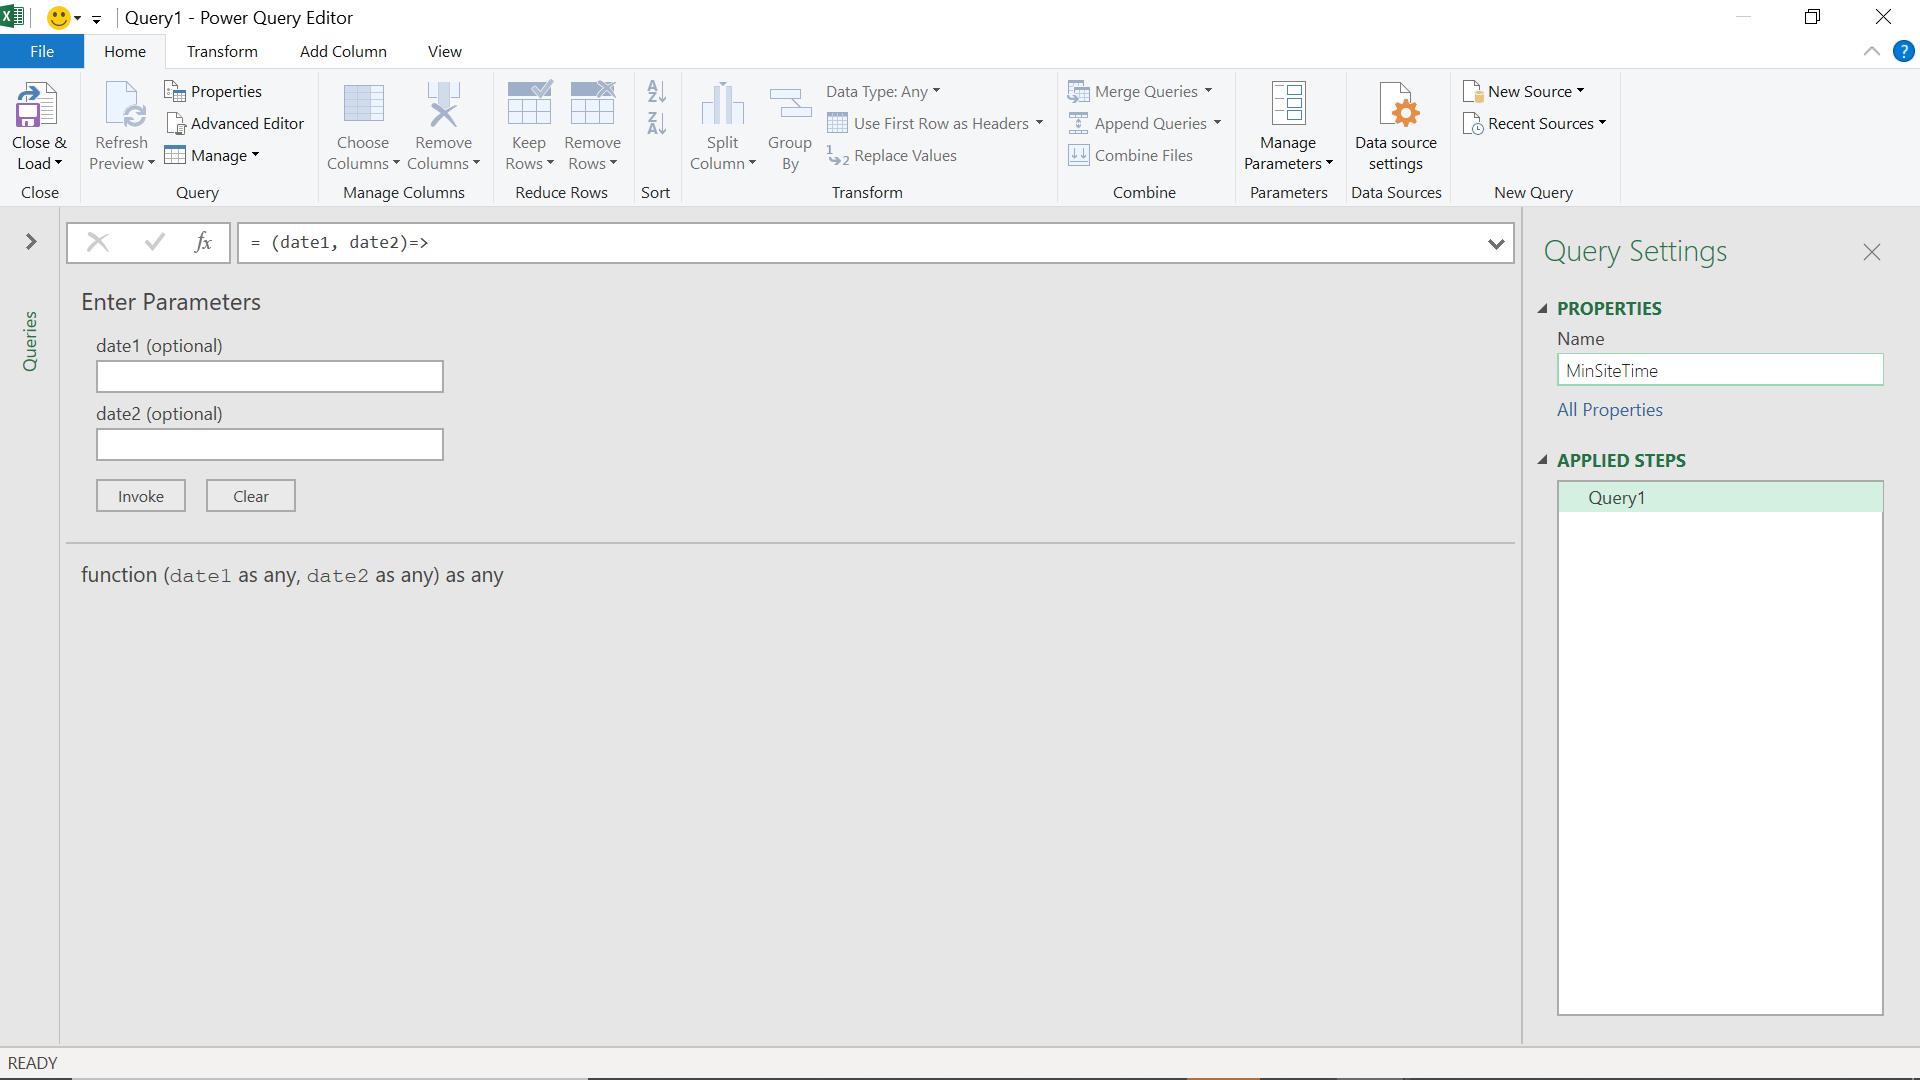
I save my function as MinSiteTime and create a new blank query.
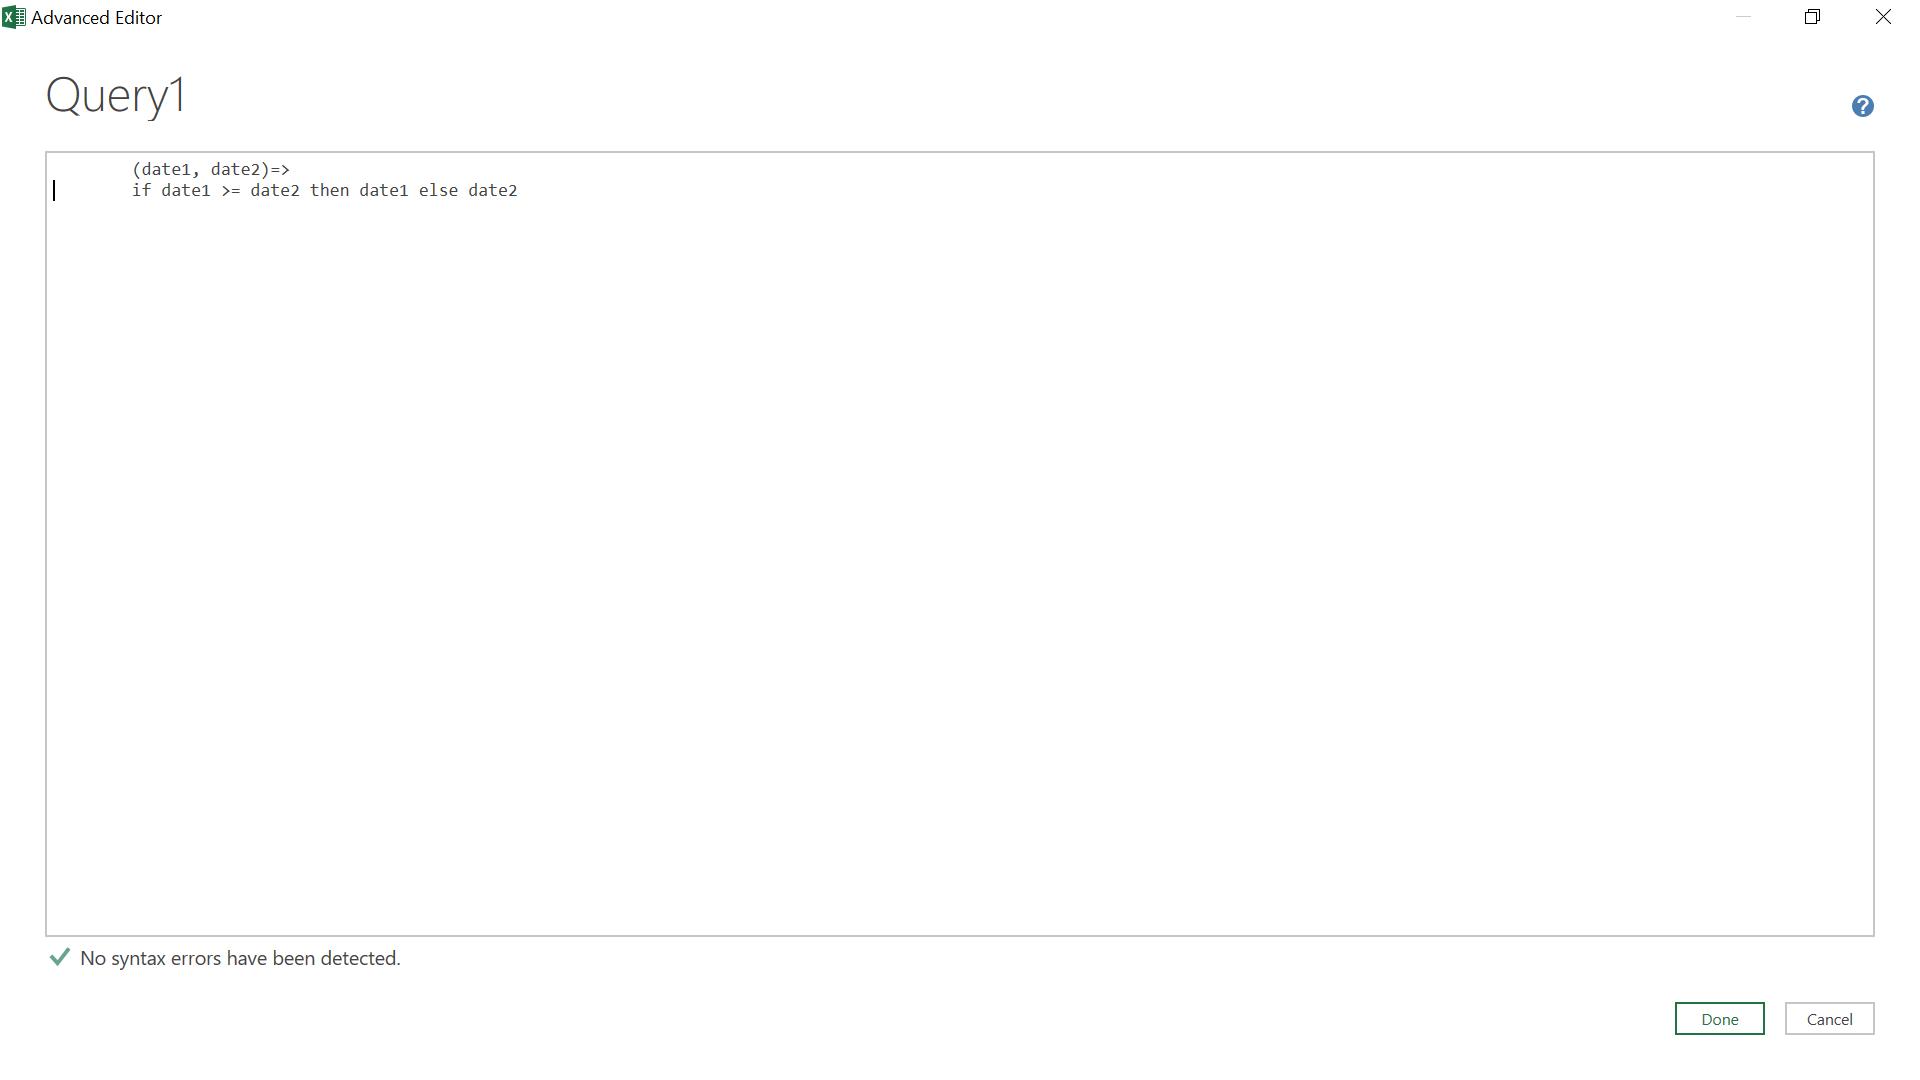
This time, the M code is:
(date1, date2)=>
if date1 >= date2 then date1 else date2
I save MaxSiteTime.
Going back to my original query, I can now create a new custom column from the ‘Add Column’ tab. I call my new column Overlap.
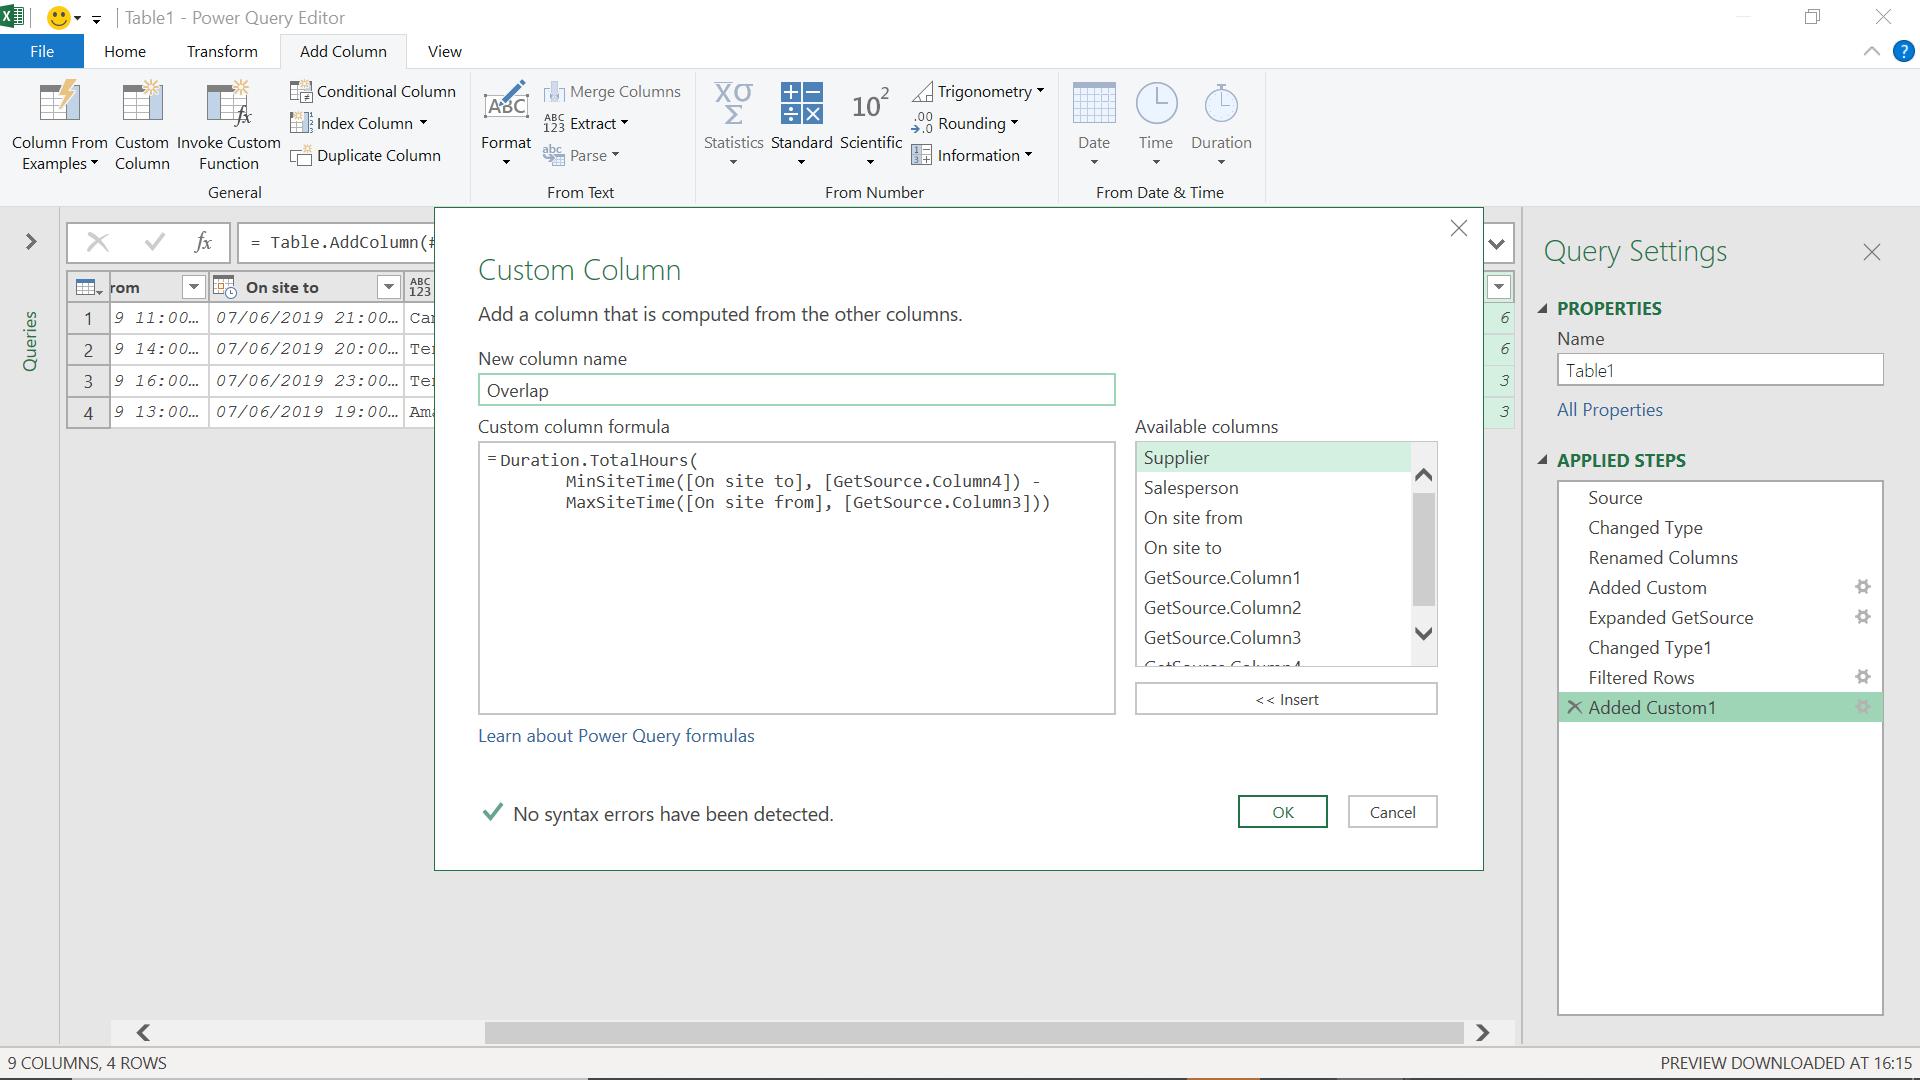
The M code I have used is:
= Duration.TotalHours(
MinSiteTime([On site to], [GetSource.Column4]) -
MaxSiteTime([On site from], [GetSource.Column3]))
This formula will give me the number of hours overlapping: if the result is negative, then there is no overlap.
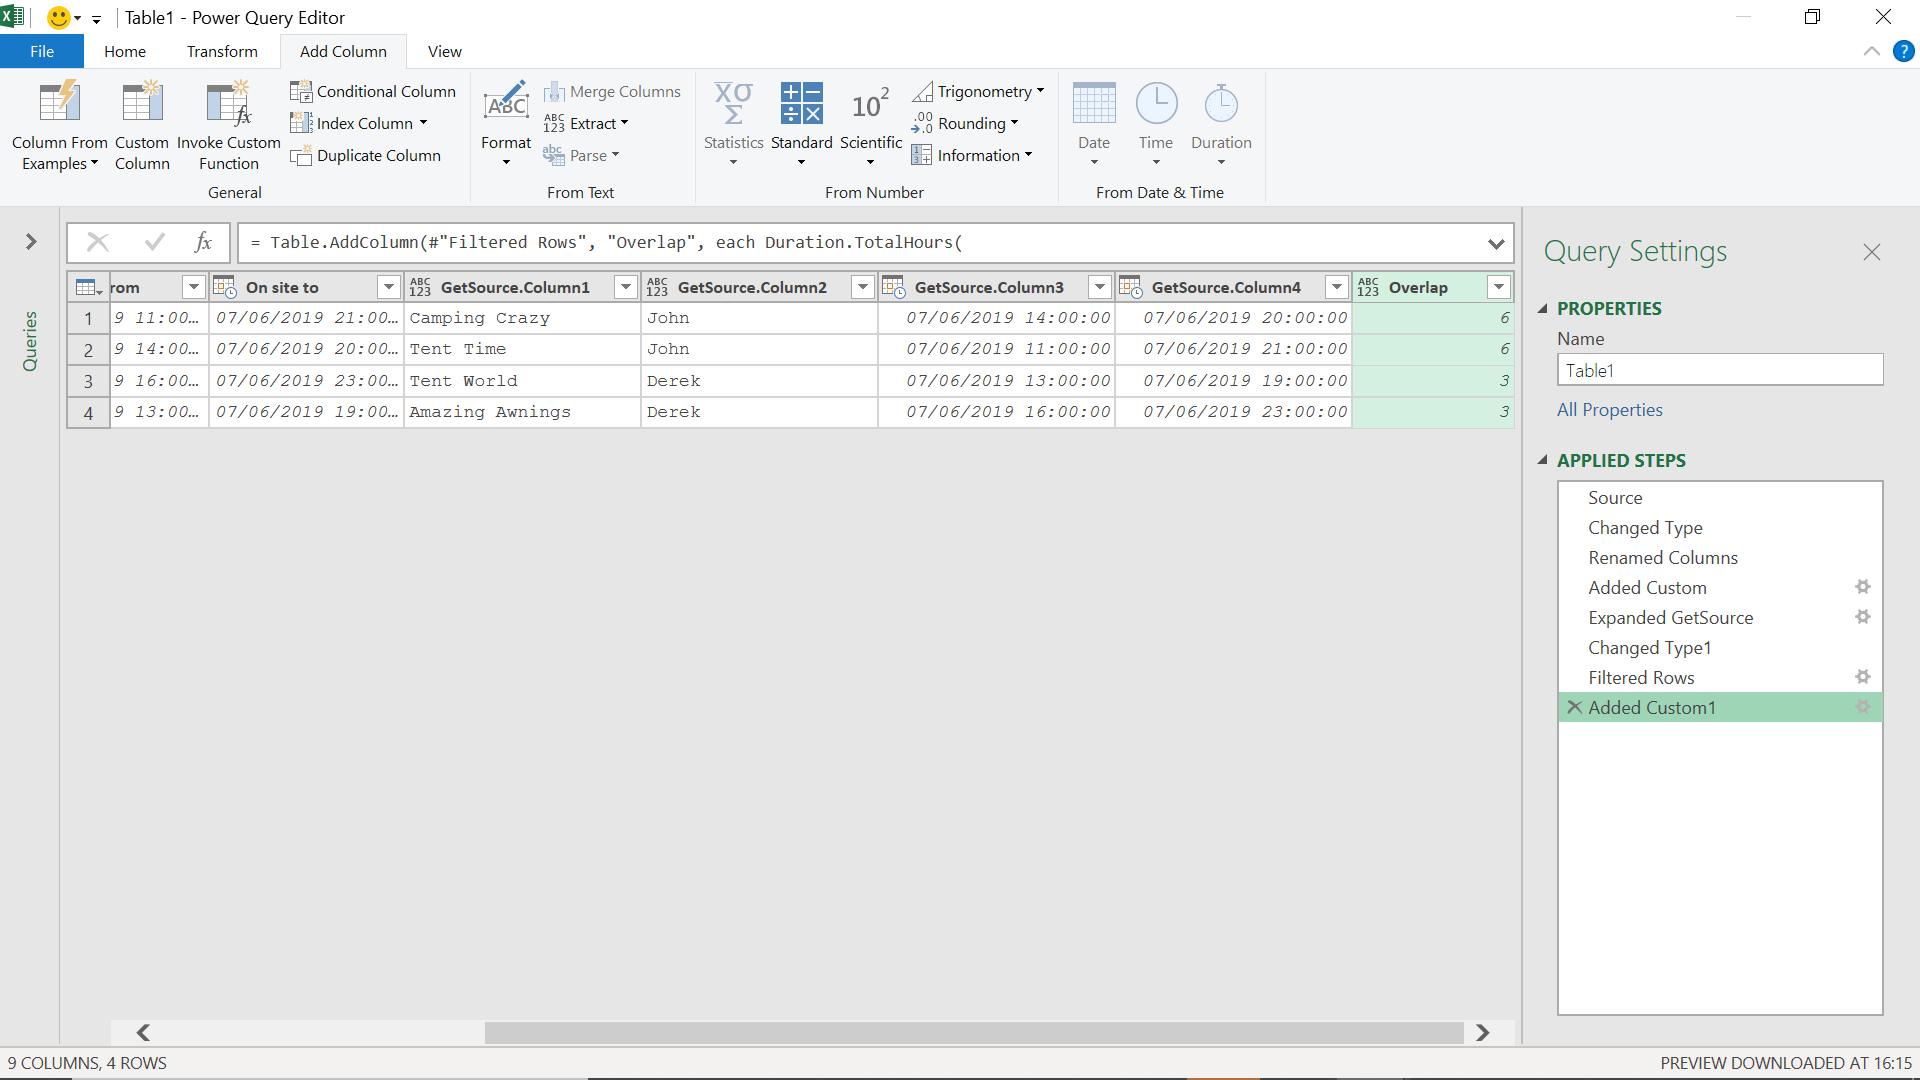
As expected, both salespeople have overlapping time on supplier sites. I can add another supplier for John with no overlap to show that this will not give a positive value in the overlap column.
If I refresh my query, I can see the results:
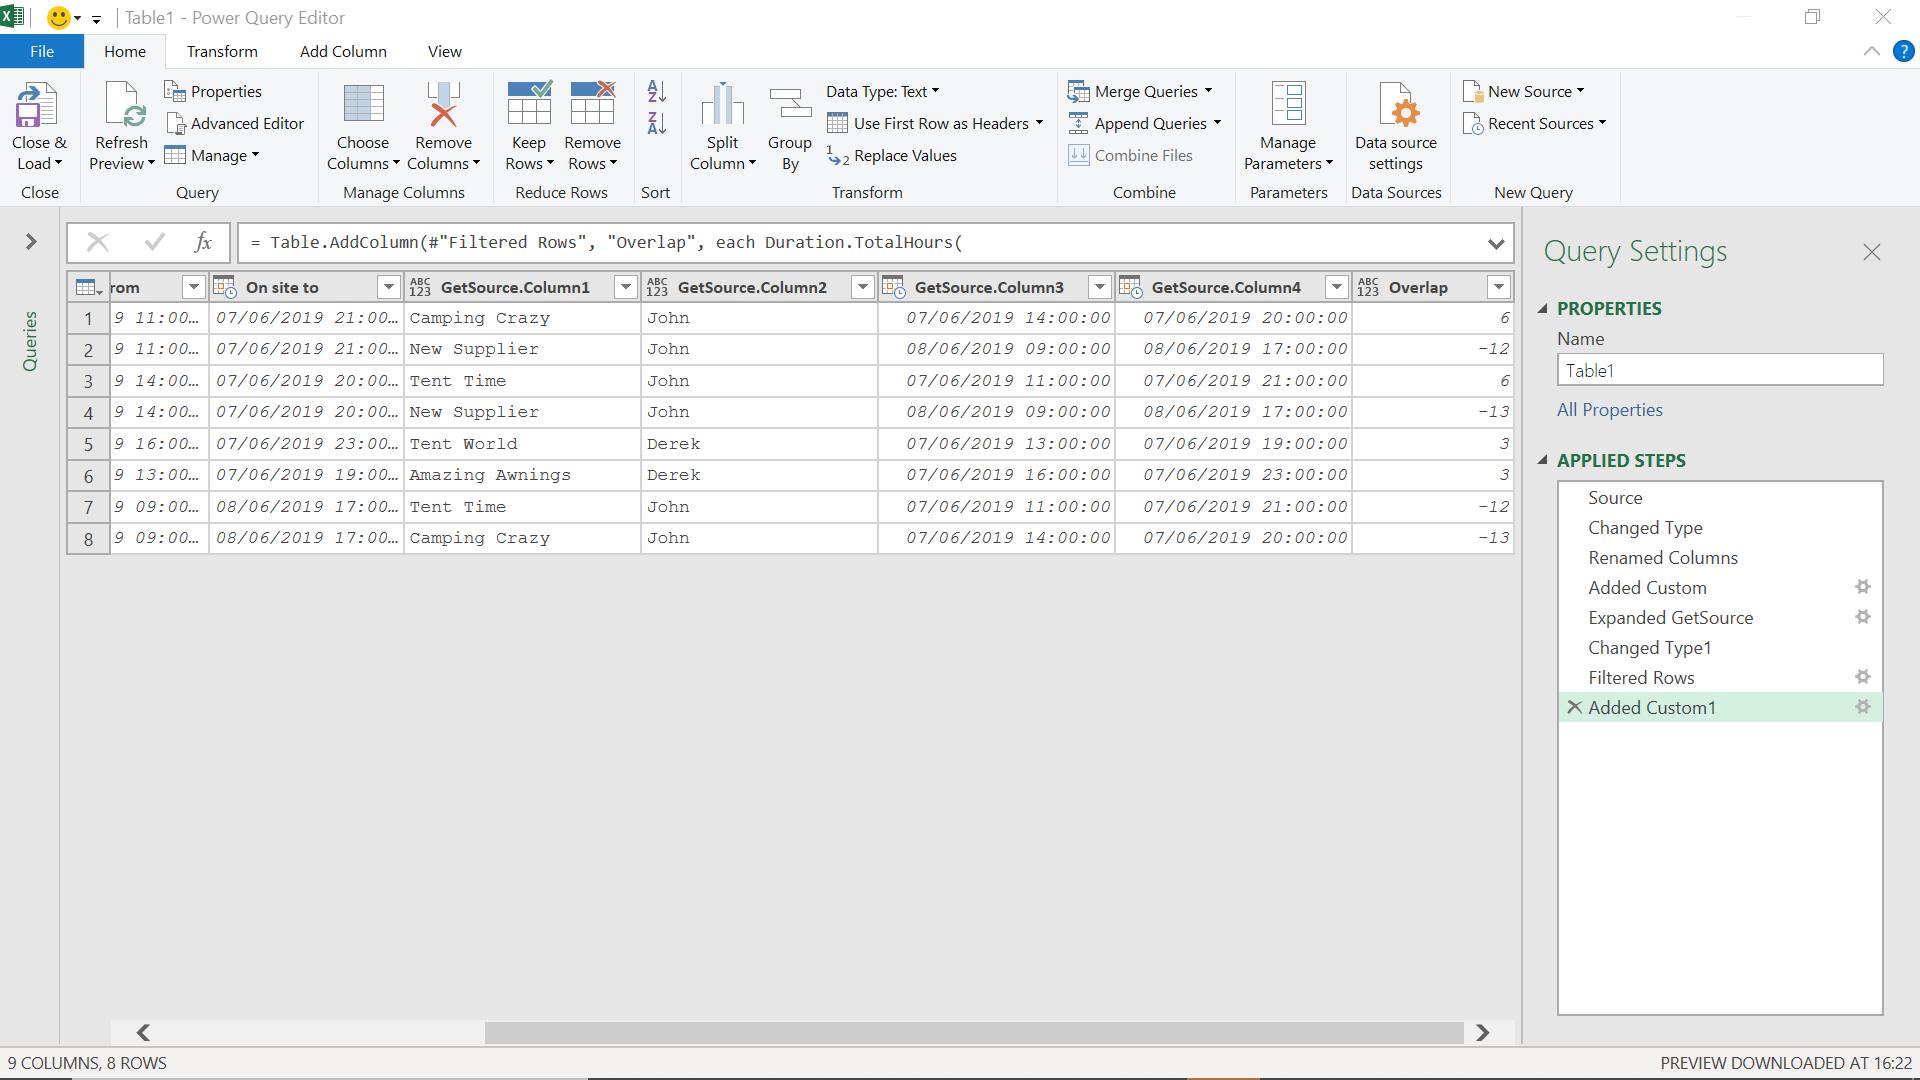
The rows involving ‘New Supplier’ have a negative value in Overlap,
showing that there is no overlapping time on site. I can filter on Overlap to remove the negative values:
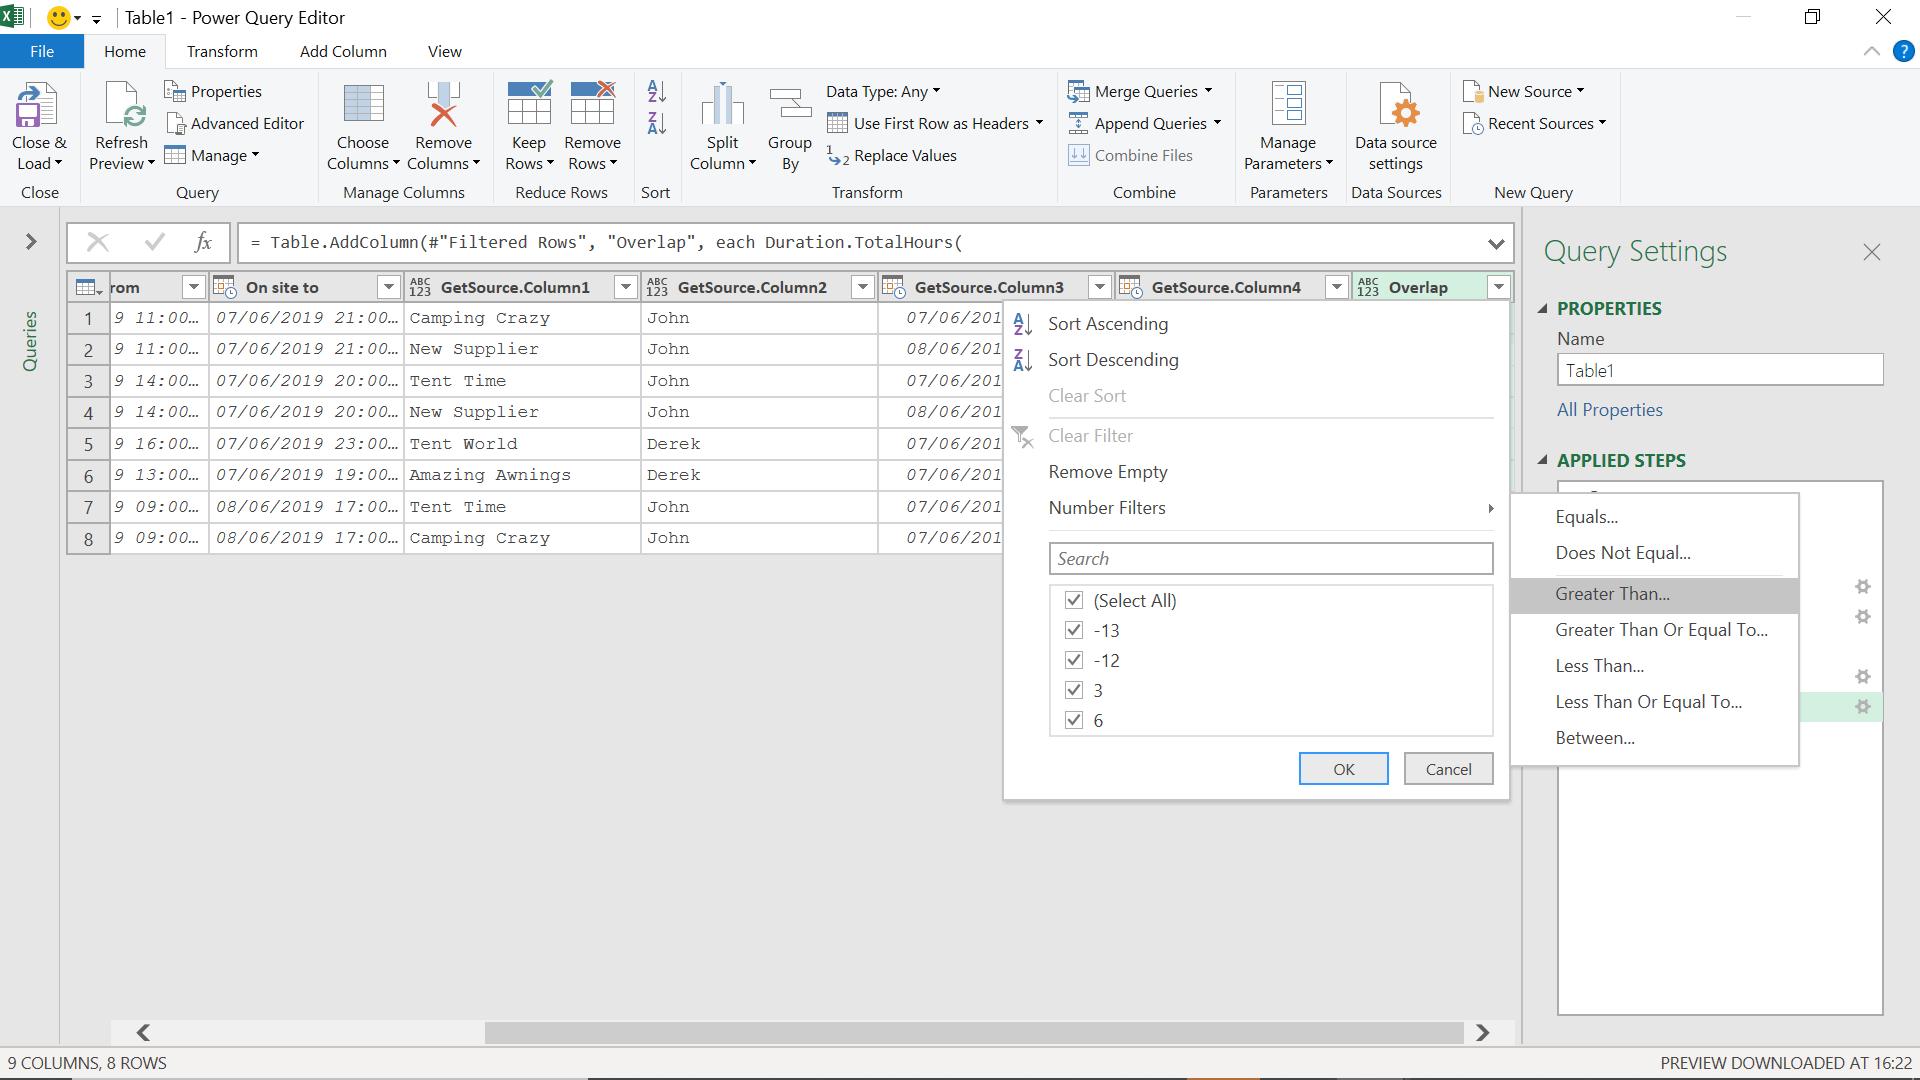
I choose values greater than zero (0).
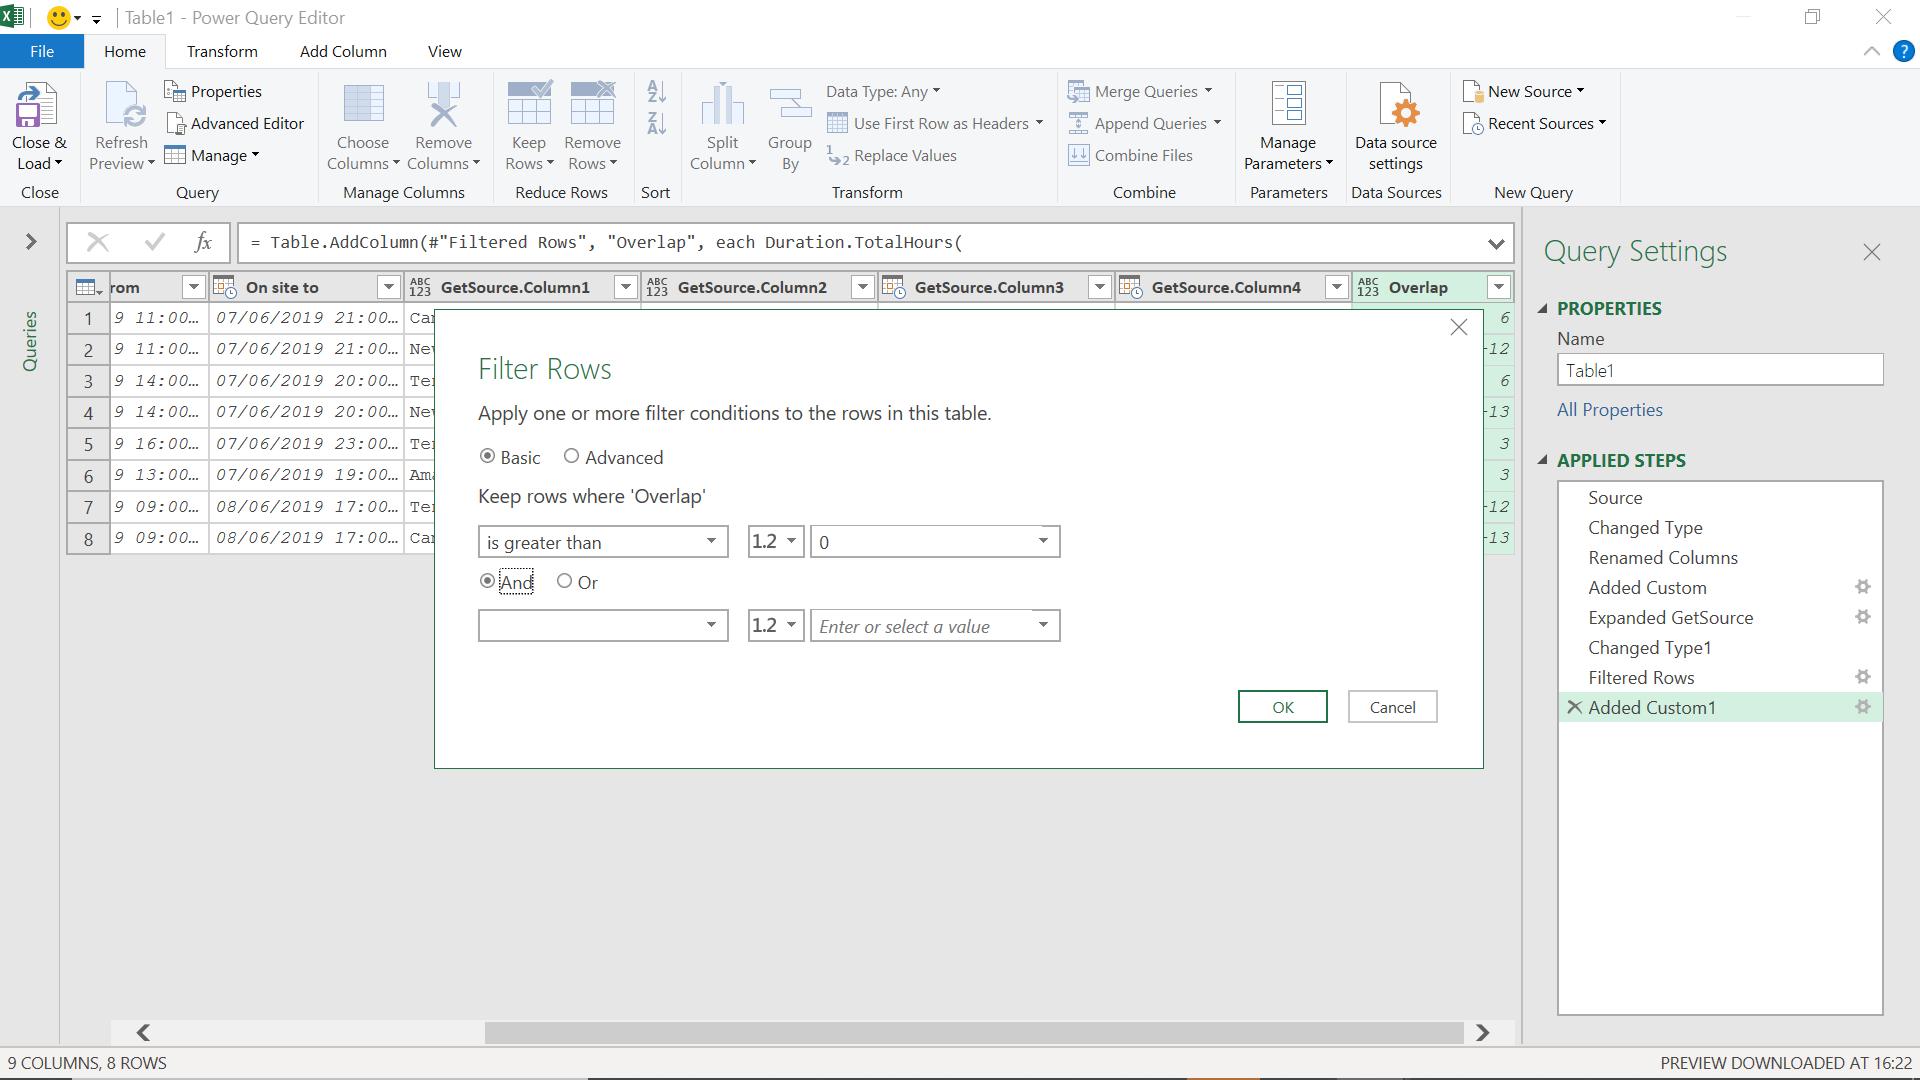
I can see the filter applied:
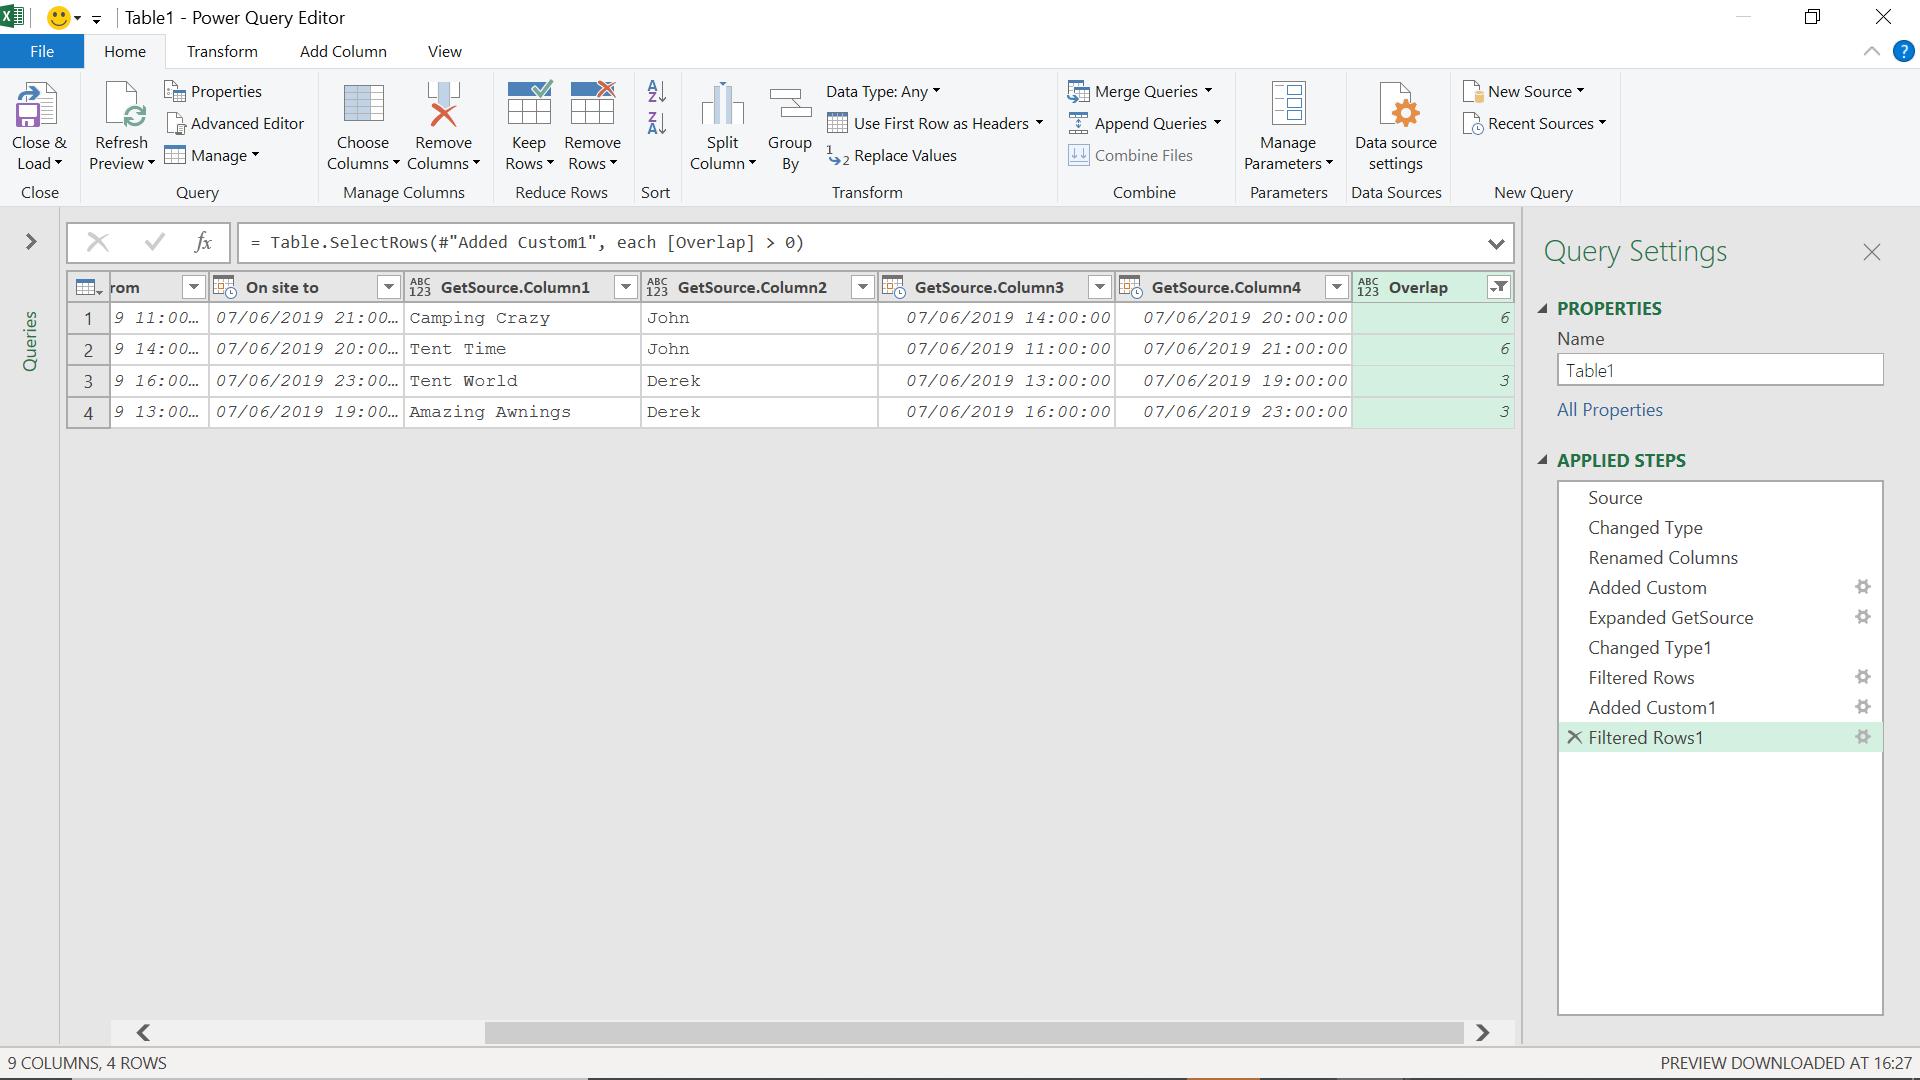
I only see those rows where there’s an overlap. If I wish, I can show the overlap in more detail by creating columns to show the beginning and end of the overlap. To do this, I add two custom columns and use my MaxSiteTime and MinSiteTime functions. I use the ‘Invoke Custom Function’ button on the ‘Add Column’ tab to do this.
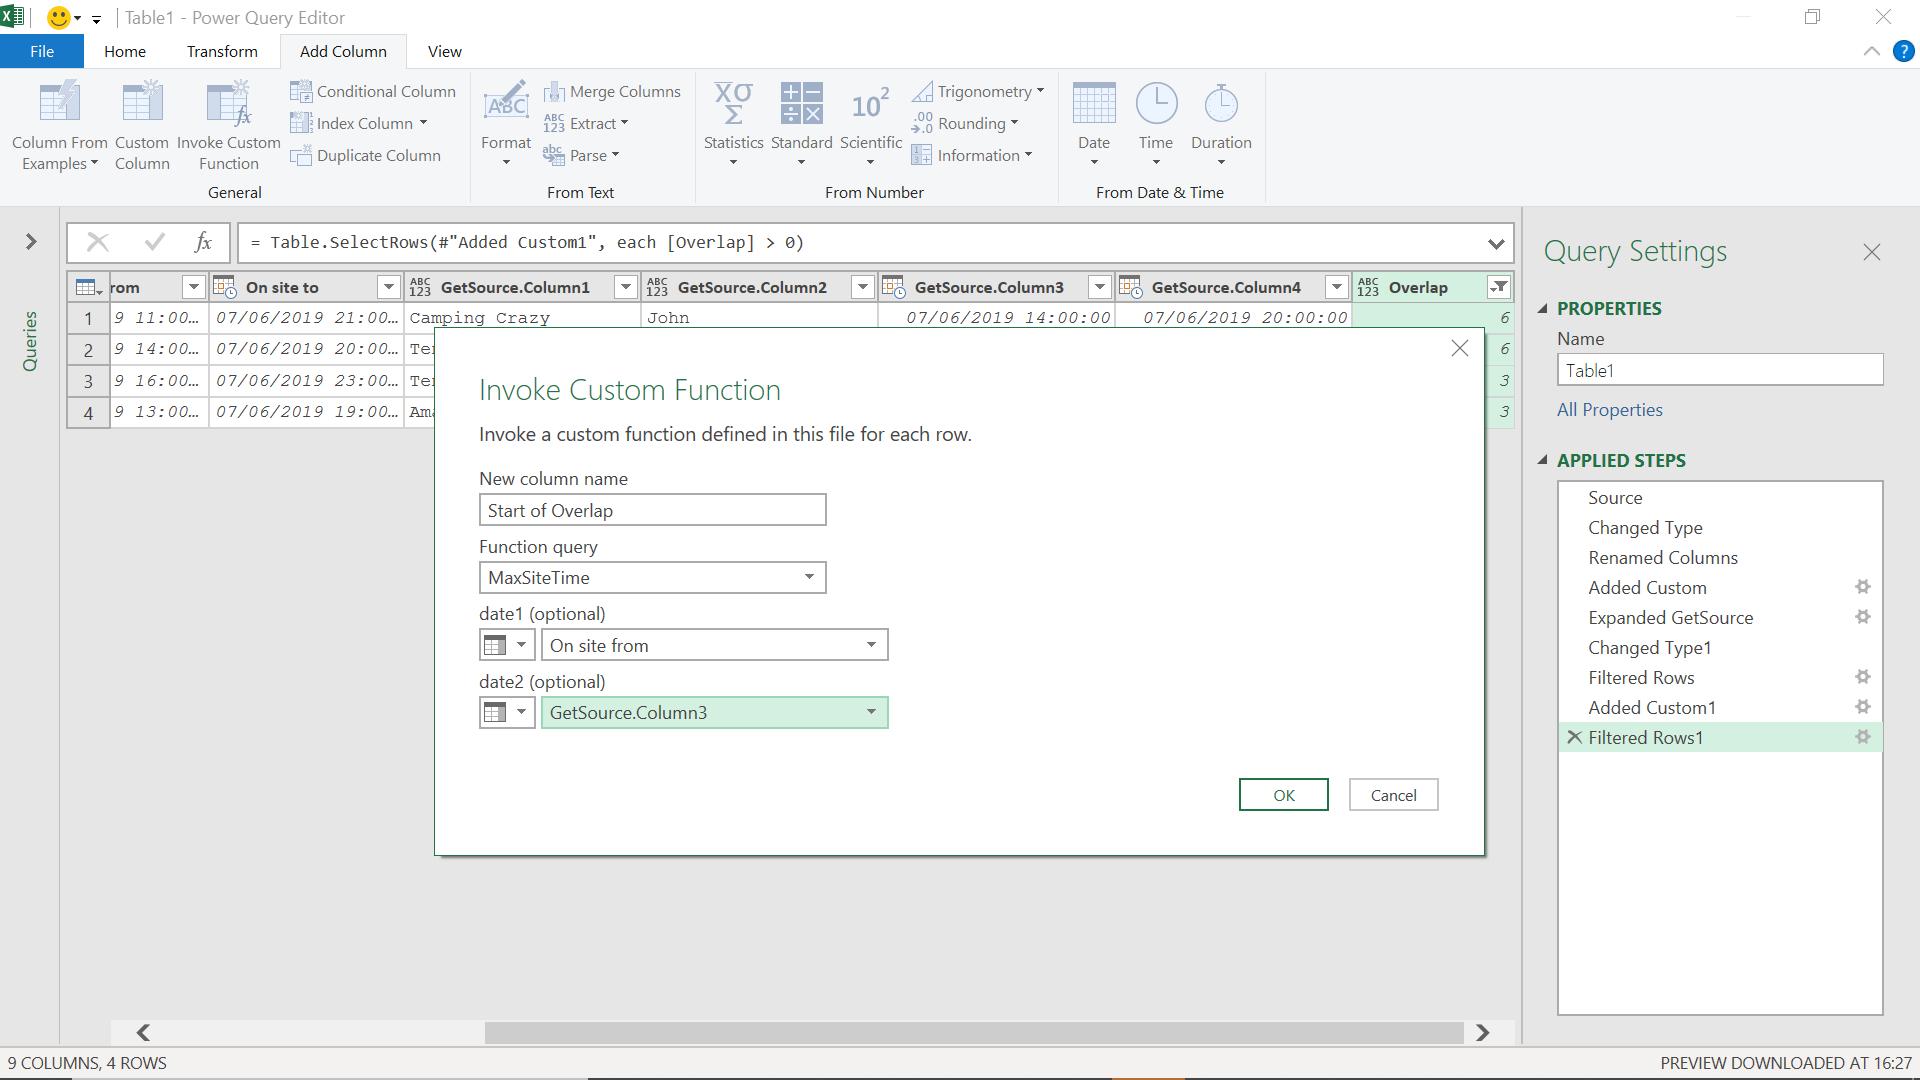
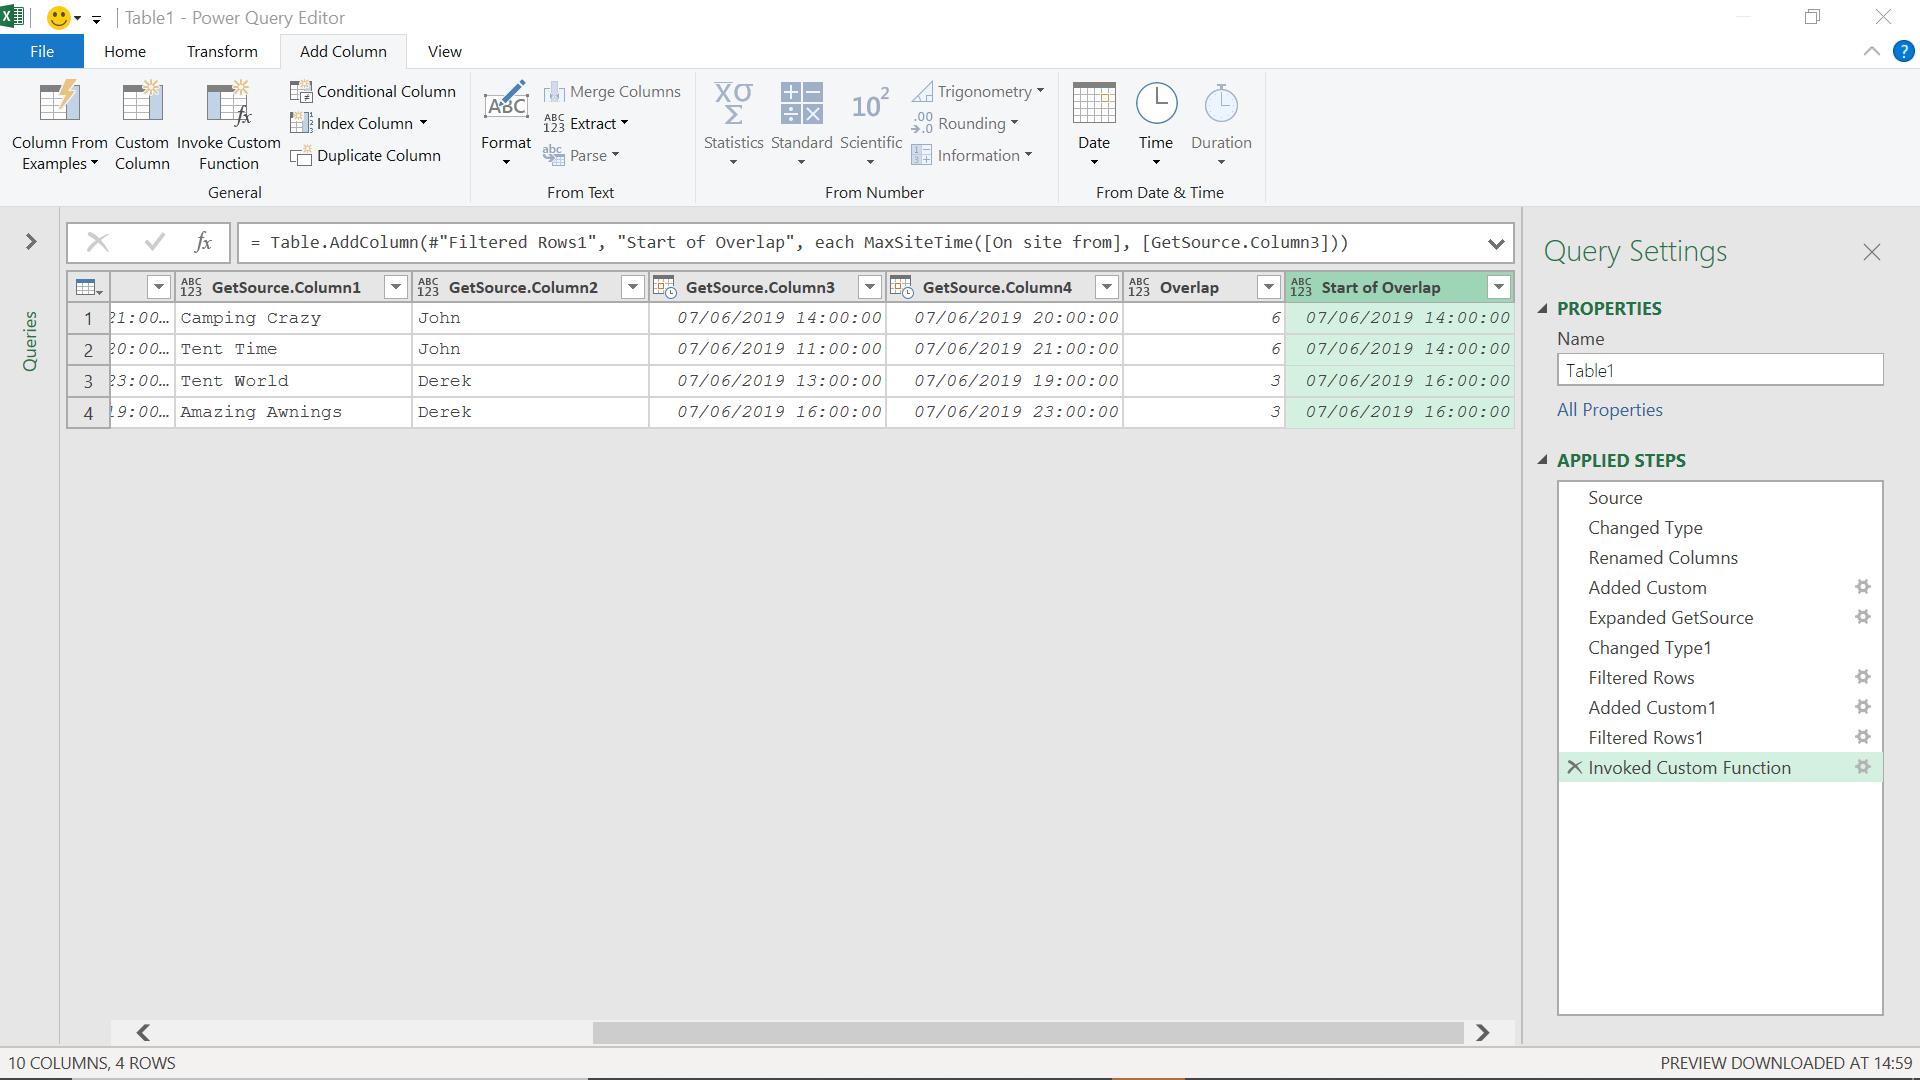
I take the On Site From and GetSource.Column3 (i.e. the linked On Site From), and find the later of the two.
I create another column for the end of the overlap using a similar method.
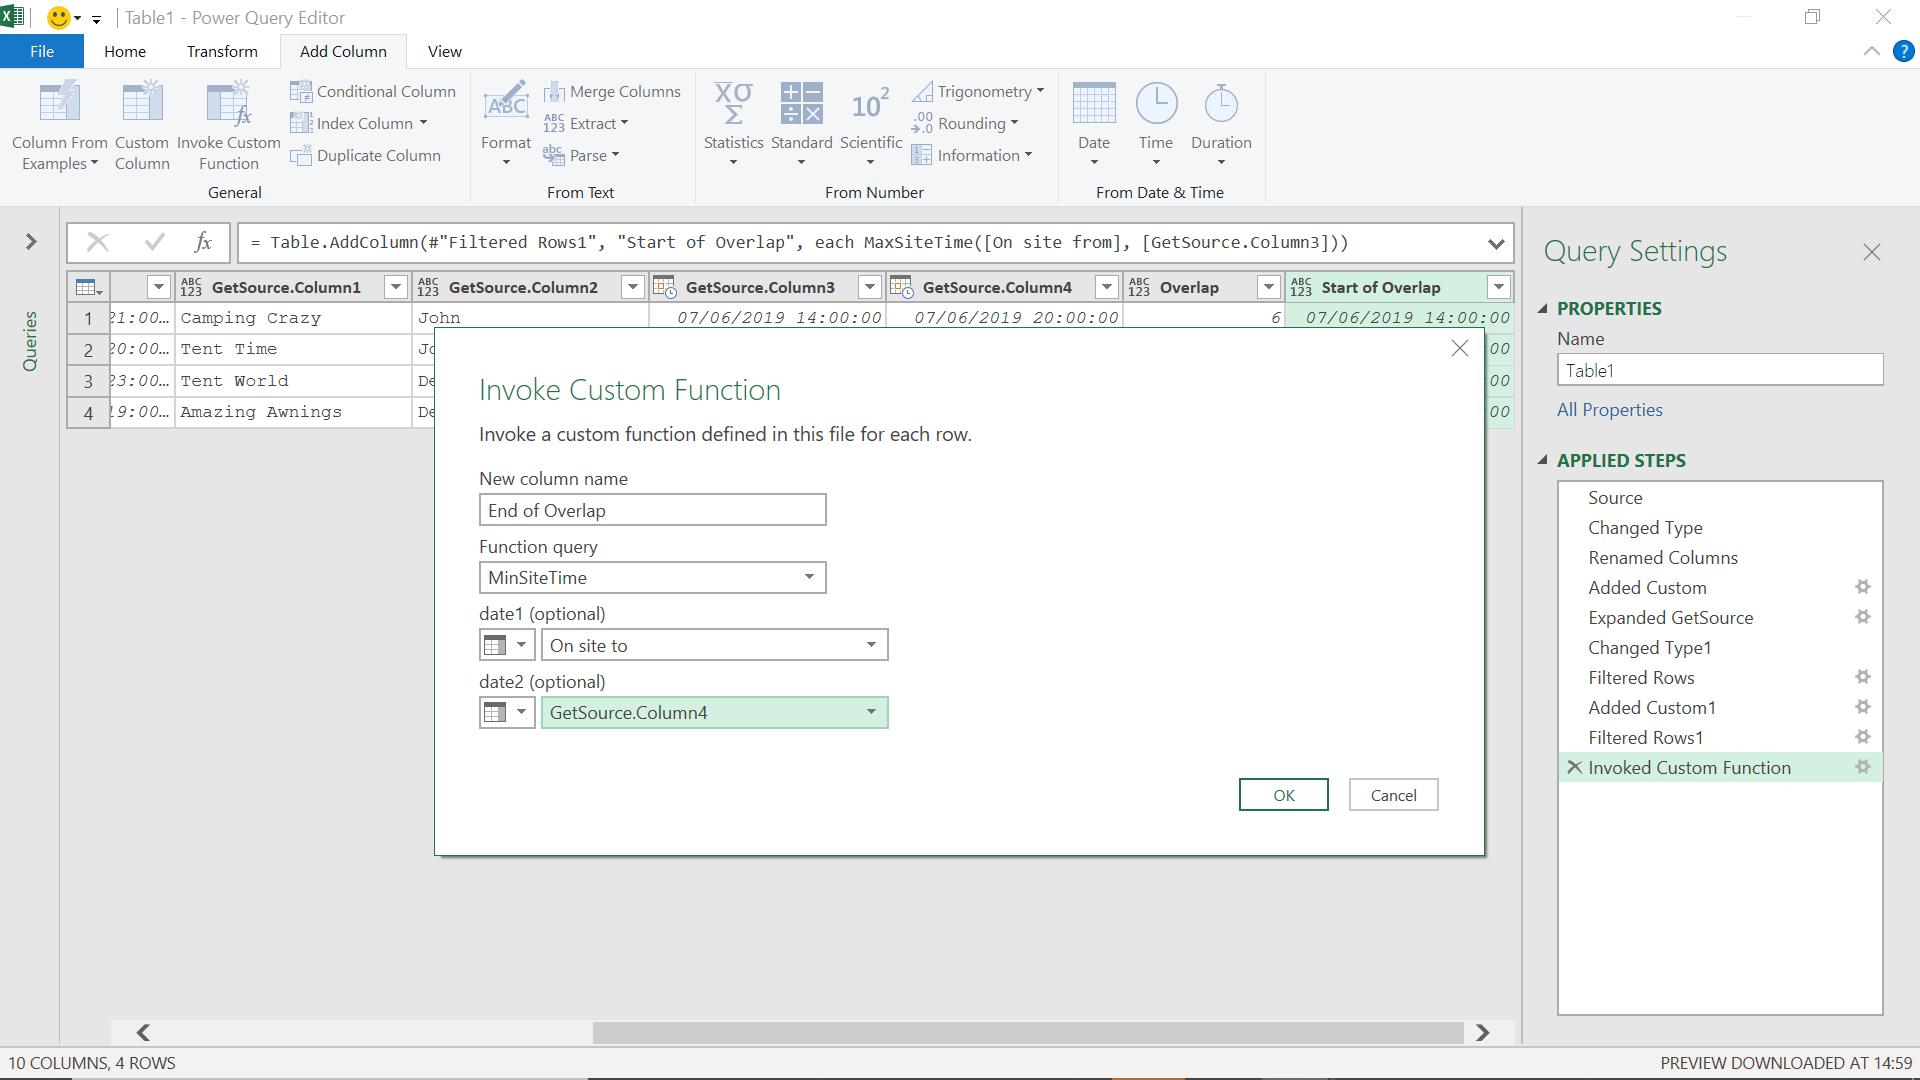
I take the On Site To and GetSource.Column4 (i.e. the linked On Site To), and find the earlier of the two.
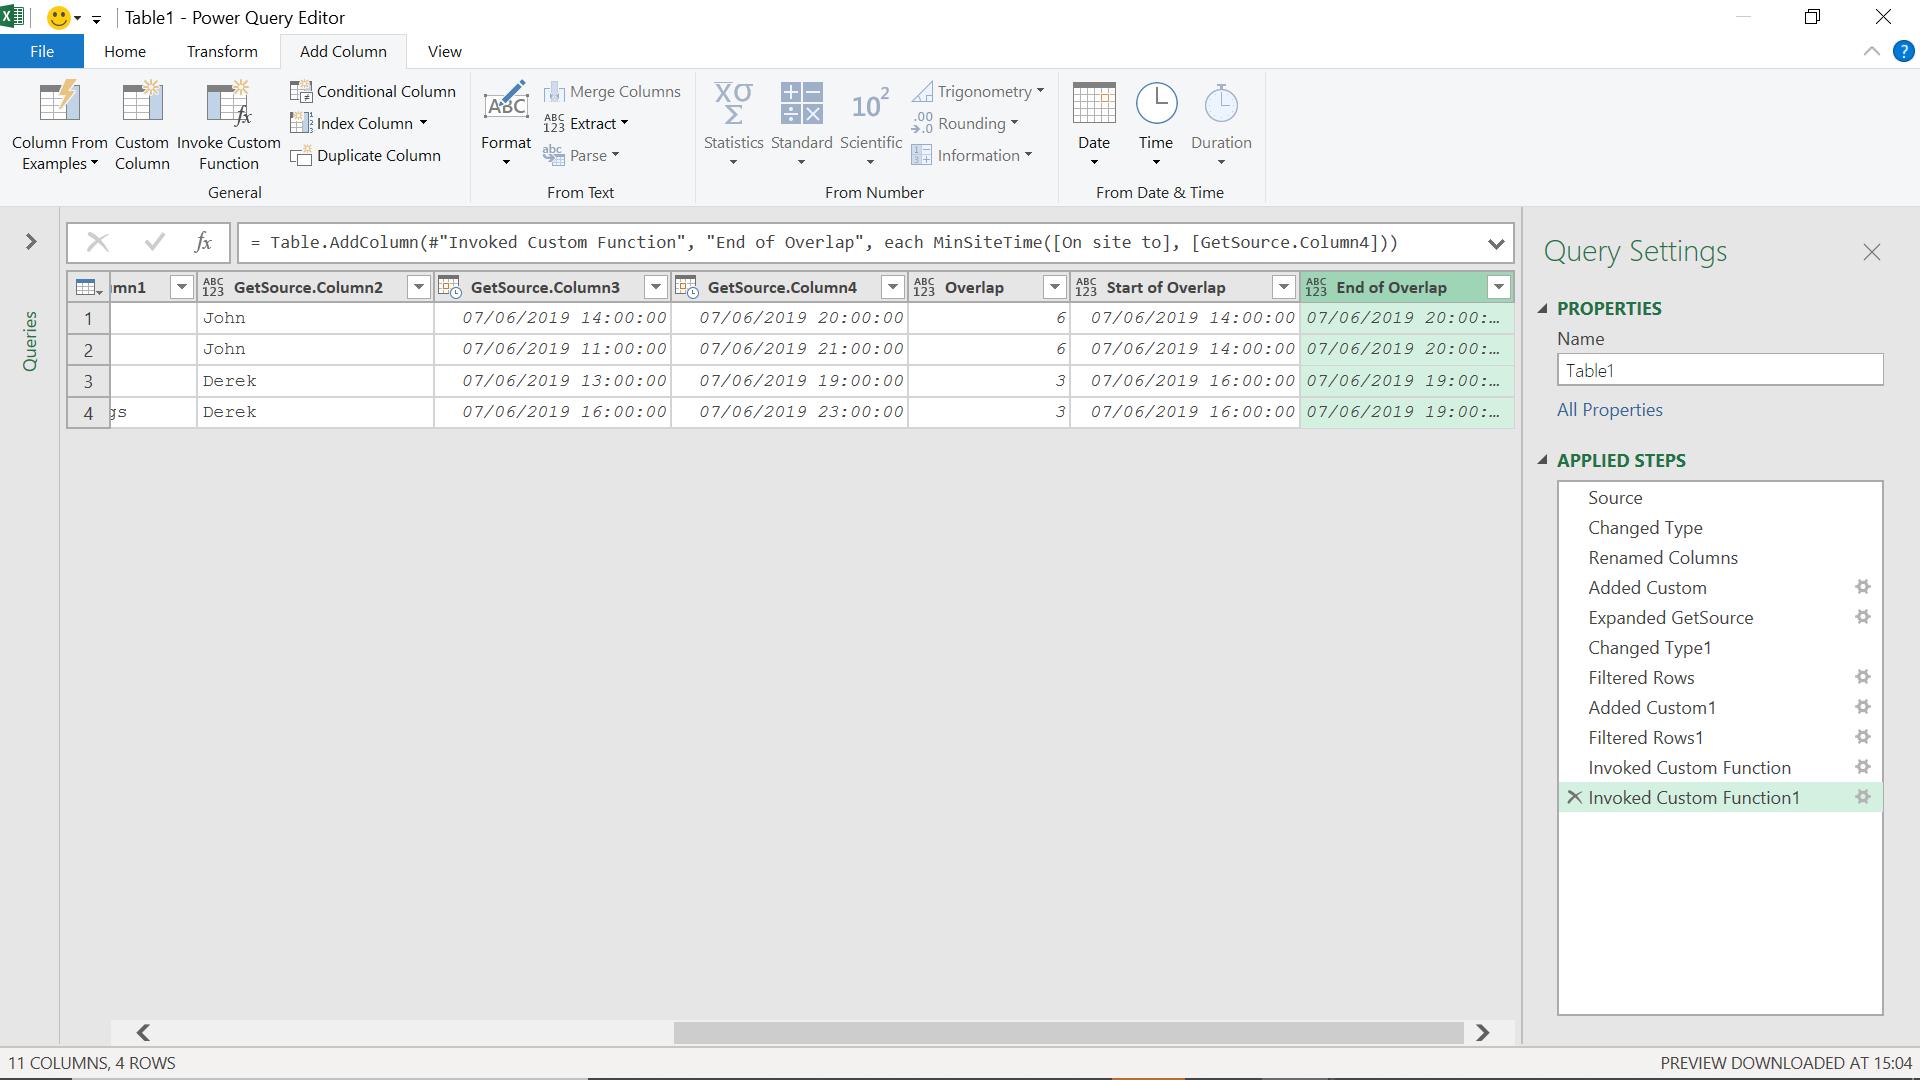
I can now remove the ‘GetSource’ columns to see my results:
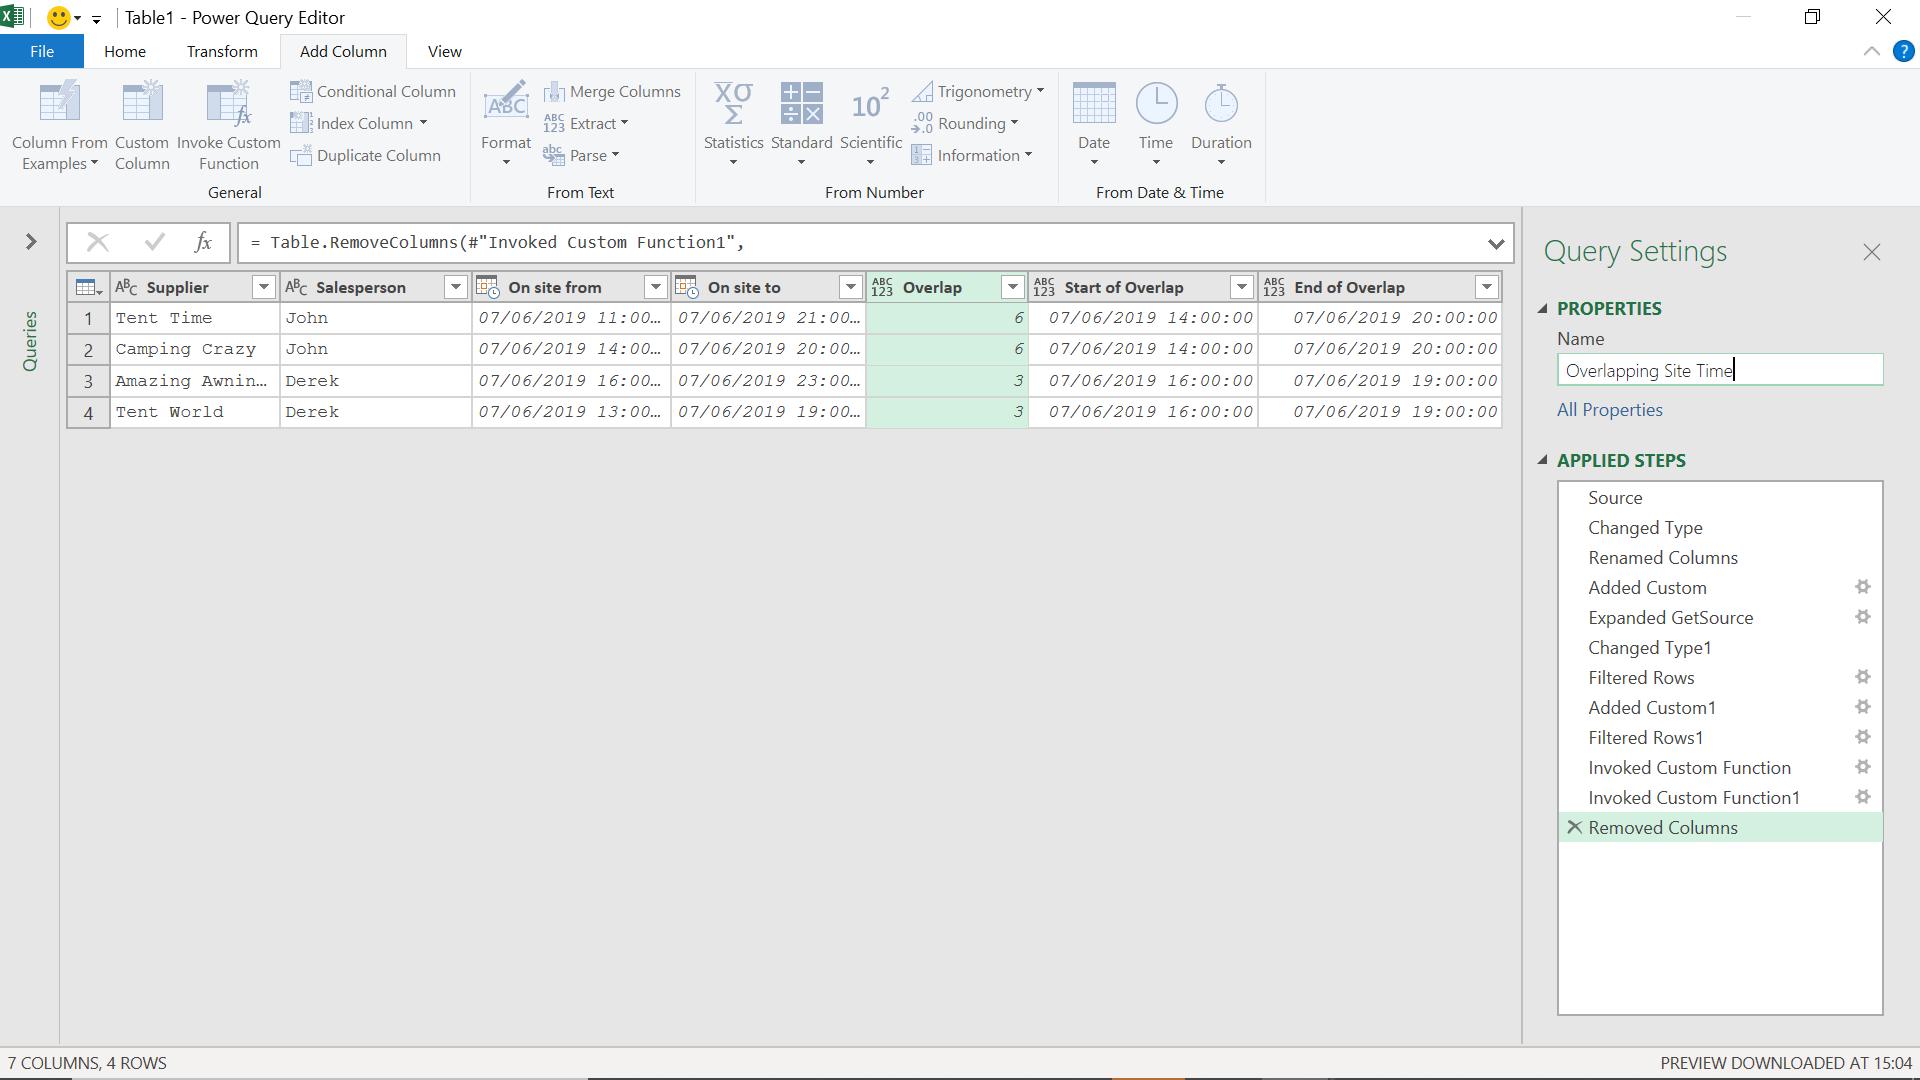
I can now see the overlapping site time in the records for my salespeople and can chase up to see what the recorded times should have been. Next time, I will look at a method of doing this where I don’t have to create so many rows during my calculations.
Come back next time for more ways to use Power Query!