
Power Query: Rental Wrangles
28 July 2021
Welcome to our Power Query blog. This week, I look at how to expand data to create a useful table.
I have some data on tent rentals:
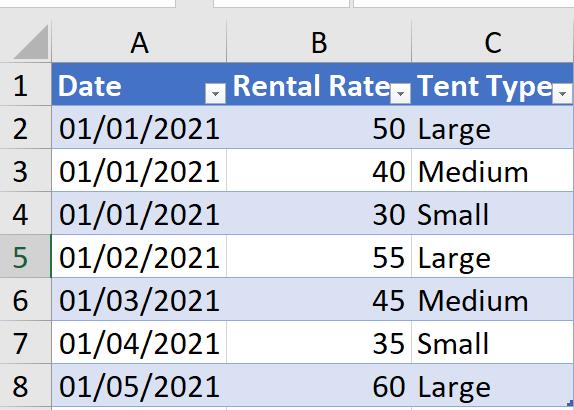
It’s a fairly basic Table, which just records the date when rentals for each type of tent change.
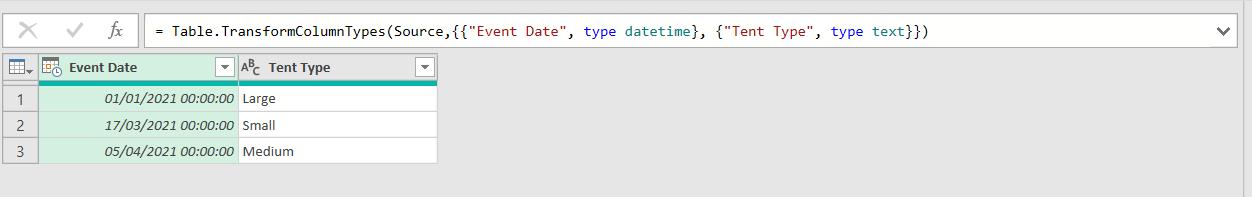
I also have a Table of one-day events, where tent rental is required:
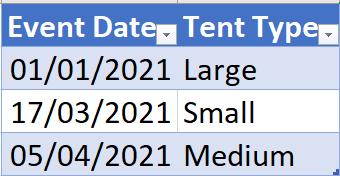
I want to know the rental for each event, but currently there is only a clear link for the first event, as it occurs on 1 January 2021 and there is a rental rate entry for this. There are a couple of ways I can approach this. This week, I am going to expand the tent rental table so that there is an entry for every date.
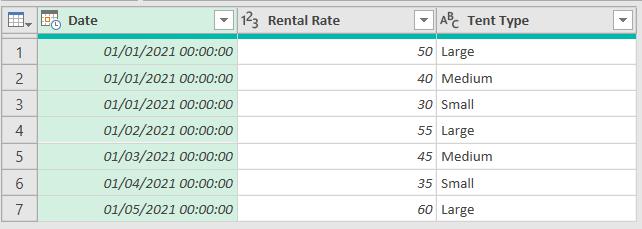
I start by extracting the tent rental data to Power Query, using ‘From Table/Range’ on the ‘Get & Transform Data’ section of the Data tab.
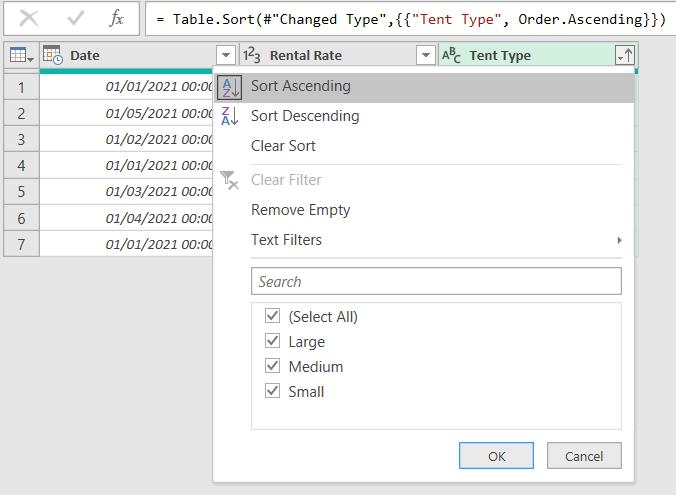
I start by ordering my data by Tent Type, using the dropdown next to the column heading.
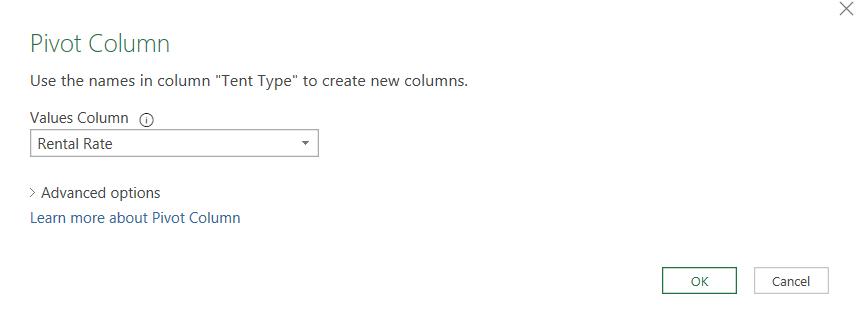
I need to get the Tent Type into the headings so that I can cross reference Tent Type with all Dates in the appropriate period. I can do this by pivoting the Tent Type column. This option is available from the Transform tab:
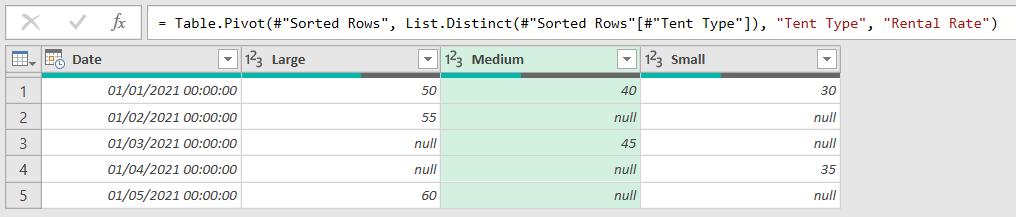
I now have column headings for each Tent Type.
In order to create a row for each Date, I am going to create a new Blank Query from the ‘New Source’ dropdown in the ‘New Query’ section of the Home tab.
I start my new query by using functionality that will create a list. The M code I am going to use is in the form:
={fromdate..todate}
However, I can not currently use dates as the beginning and ending points; I have to use numbers. Power Query will then generate every number in the interval. Thus, I convert my dates to numbers.
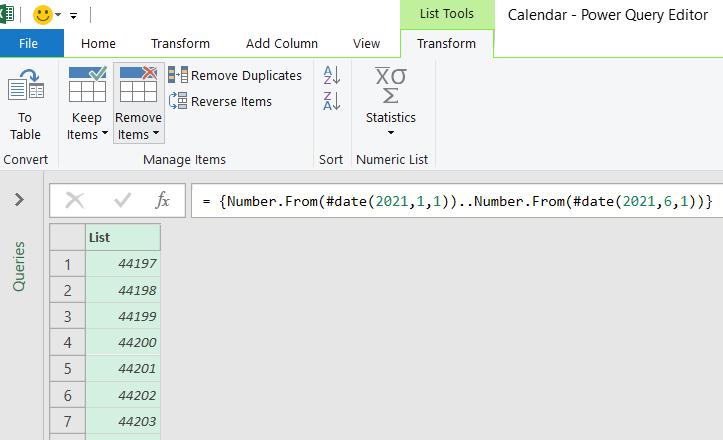
= {Number.From(#date(2021,1,1))..Number.From(#date(2021,6,1))}
Here, I am creating a date by providing the year, month and day number, and then using Number.From() to convert the date to a number. This will give me a number for every day from 1 January 2021 to 1 June 2021.
I can then convert the list to a table using the option on the ‘List Tools’ tab. I also change the datatype to DateTime (so that it matches the Date column on my original query) and rename it Date.
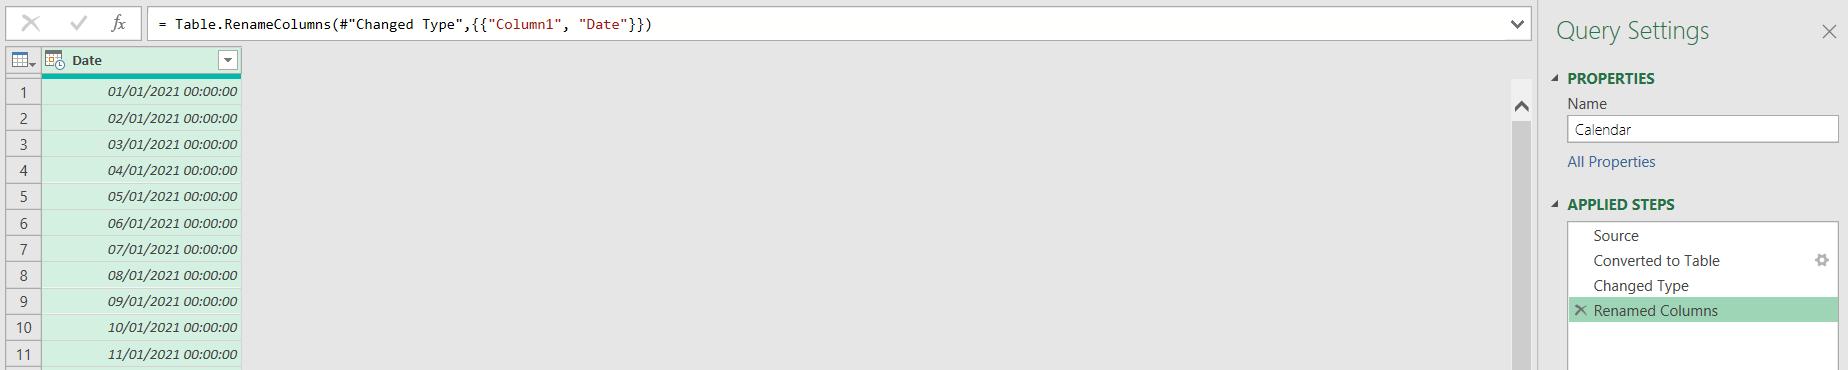
My Calendar query is ready to use.
Back in my original query (now called Rental Calendar), I am going to merge with the Calendar query. I can do this from the Home tab.
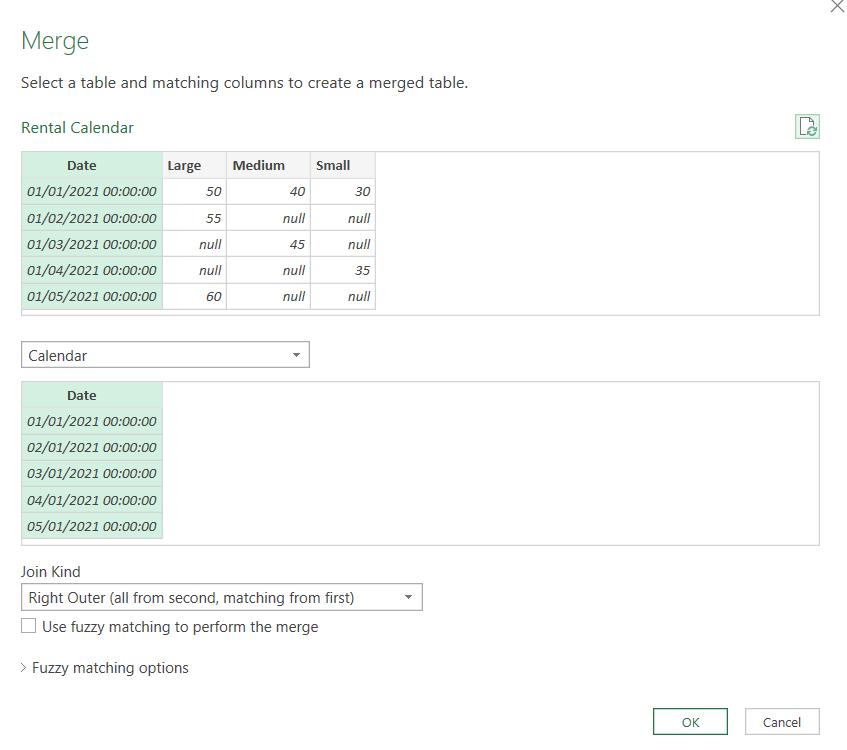
I use a ‘Right Outer’ join because I want to include every Date from Calendar.
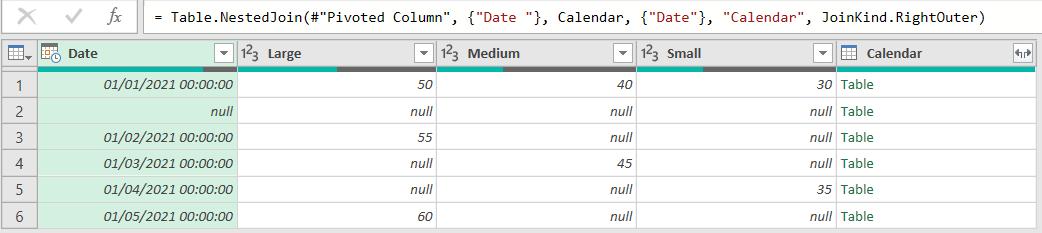
I can now expand the Calendar column to just give me the Date.
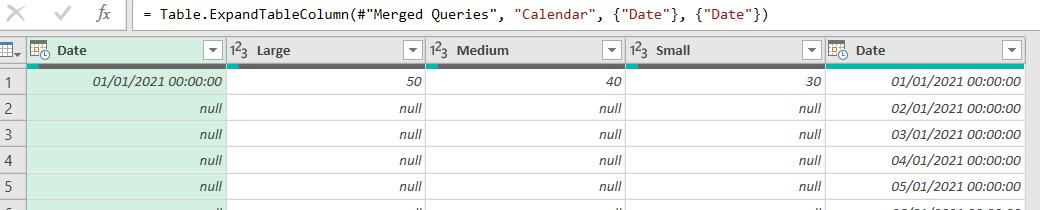
I remove the original Date column. I need a rental value for every date, so I can fill down on “Large”, “Medium” and “Small”.
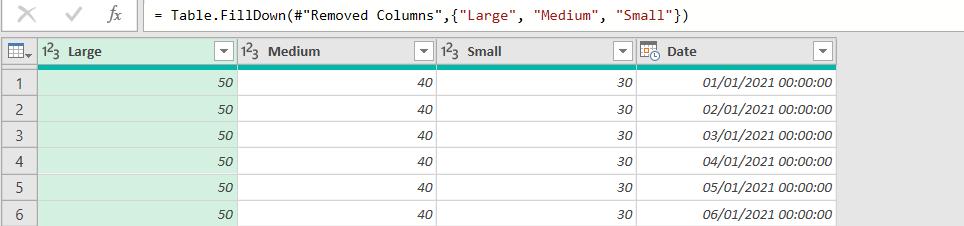
Finally, I need to get the tent types back into a Tent Type column. I can do this by selecting Date and choosing to ‘Unpivot other columns’ from the ‘Unpivot Columns’ dropdown on the Transform tab.
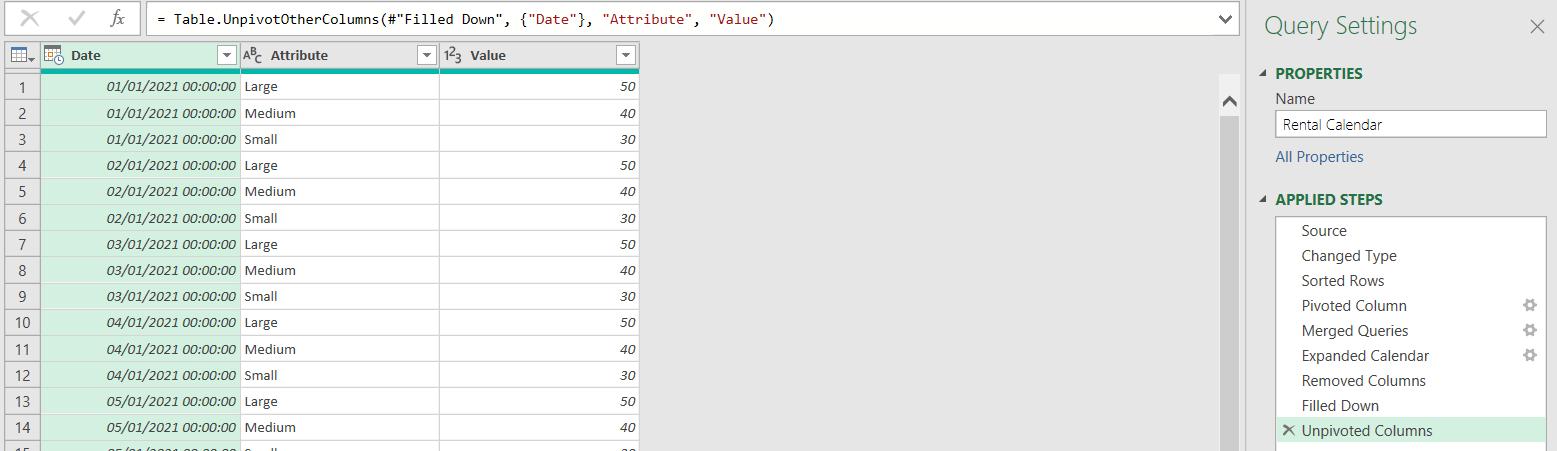
I now have a value for each date, telling me what the rental is for each type of tent. I can rename the Attribute and Value columns to Tent Type and Rental Rate.
Next, I extract the data for the events:
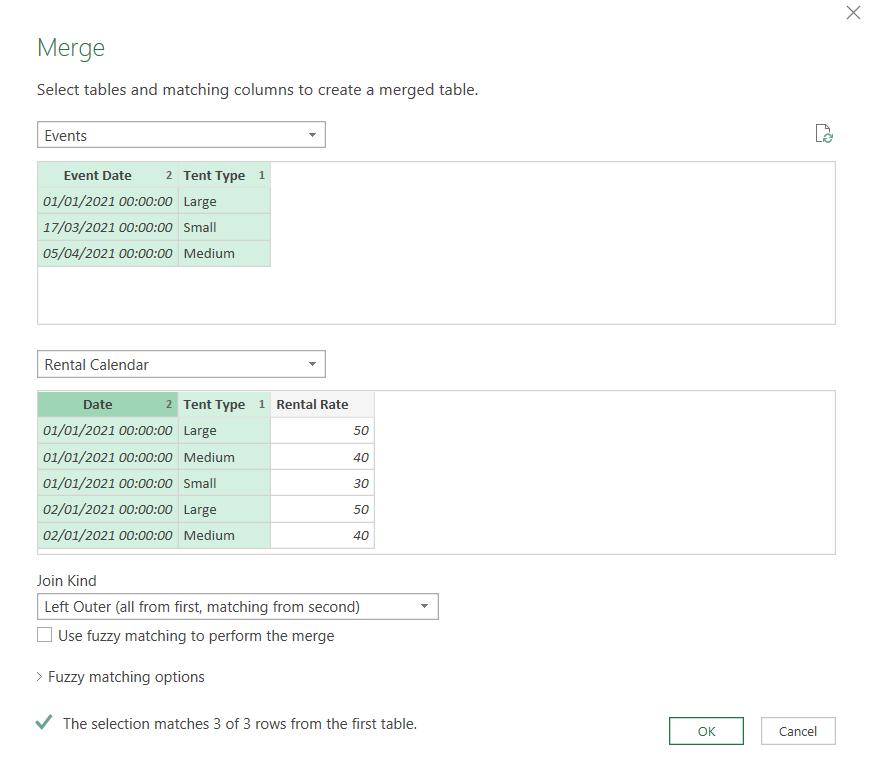
I merge with the query Rental Calendar. This time, I use a ‘Left Outer’ join, as I only want rows for each Event Date and Tent Type.
This gives me a new column containing the data from Rental Calendar.
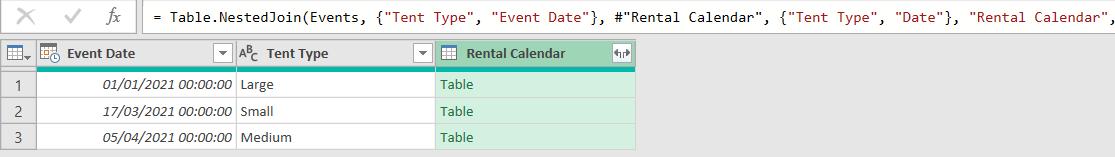
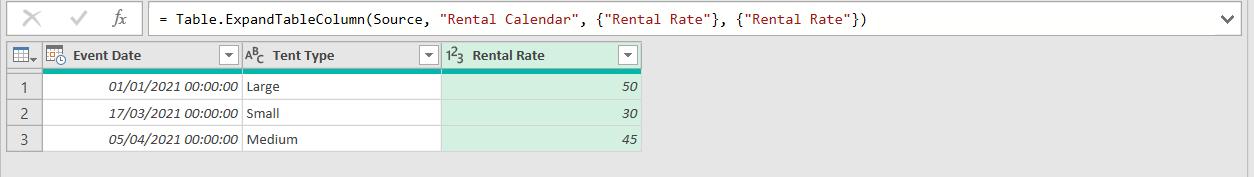
I expand Rental Calendar to get the Rental Rate.
Next time, I’ll look at a different way to get to this result by creating a function.
Come back next time for more ways to use Power Query!