Power Query: Rental Wrangles Receipts - Part 1
11 August 2021
Welcome to our Power Query blog. This week, I look at an example where I need to transform my data before I can apply a function.
Last time, I was looking at how to extract the correct rental information for an event, where only one tent was being rented. This time, I am looking at larger events where I have list of tents required for each event.

With such large groups involved, I’ve had to return to 2019 for this example! I start by extracting my data to Power Query using the ‘From Table/Range’ option on the ‘Get & Transform Data’ section of the ‘Data’ tab. Since the process for the rental data is the same as last week, I can skip to the function created.

The function is ready to be applied to the event data. I ‘Close & Load To’ and create my function and the supporting table as ‘Connection Only’ queries. I go back to the Excel Worksheet and extract my data.

I take the defaults and create my query, which I call Event Data:

I need to divide the Tents Rented column in two different ways. First, I need to create a row for each tent type, and second, I need to separate the quantity and tent type into different columns. I will be using the ‘Split Column’ functionality for both tasks. I can access ‘Split Column’ either by right-clicking my column or from the Transform and Home tabs.

I choose to split ‘By Delimiter’:

I choose to ‘Split into Rows’ in the ‘Advanced options’ section and opt for a Custom delimiter.

The delimiter I am using is comma followed by a space (, ). This means there will be no space before the numbers.

I now have rows for each tent type with the quantities. It’s always a good idea to check that all steps generated are needed. In this case, the Split Column step has automatically been followed with a Changed Type step. This would be useful if I had created new columns, but since I have created rows instead, this step is not needed, and I can delete it.
I split the column again:

This time I am going to split ‘By Digit to Non-Digit’, to extract the tent quantities.

Ironically, I don’t have an automatically generated Changed Type step this time! I rename Tents rented.1 to Quantity and Tents Rented.2 to Tent Type. I also change the data type of Quantity to be a whole number, which I can do from the Transform tab. Since I am going to use Tent Type as a parameter, I also remove any spaces. I can do this by using Trim from the ‘Format Options’ dropdown on the Transform tab.

This will remove any leading or trailing spaces.

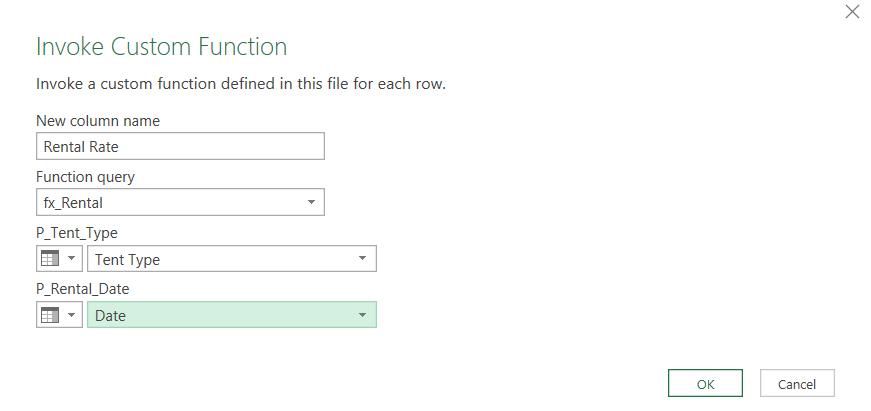
The next step is to create a Custom Function Column by ‘Invoking Custom Function’ from the ‘Add Column’ tab.

I call the new column Rental Rate and invoke fx_Rental, passing Tent Type and Date as the parameter values.

Before I continue, I change the data type of Rental Rate to be a currency.
Now I just need to perform a simple multiplication. I choose to do this from the ‘Add Column’ tab to keep the data for each tent. I select Quantity and Rental Rate (with the CTRL key held down).

Choosing Multiply from the dropdown list of Standard mathematical functions will create a new column, which is a product of Quantity and Rental Rate.

I rename Multiplication to Rental Amount.

That is where I will leave it this week. Next time, I will recombine my data so that I have one line for each event.
Come back next time for more ways to use Power Query!

