
Power Query: Reorganising by Numbers
18 March 2020
Welcome to our Power Query blog. This week, I look at using some numerical functions to sort out expense formatting.
I have more expense data from my imaginary salespeople. I need to format it so that I have my data in separate columns.

As usual, my first step is to extract the data to Power Query, using the ‘From Table’ option in the ‘Get & Transform’ section of the Data tab.

The first thing I notice is that Power Query has generated a ‘Changed Type’ step, which sets the column type to Any. As this doesn’t achieve anything, I remove this step by clicking the X next to it.

I need a way of distinguishing between the rows, so I add an index from the ‘Add Column’ tab. I will start my index at zero (0).

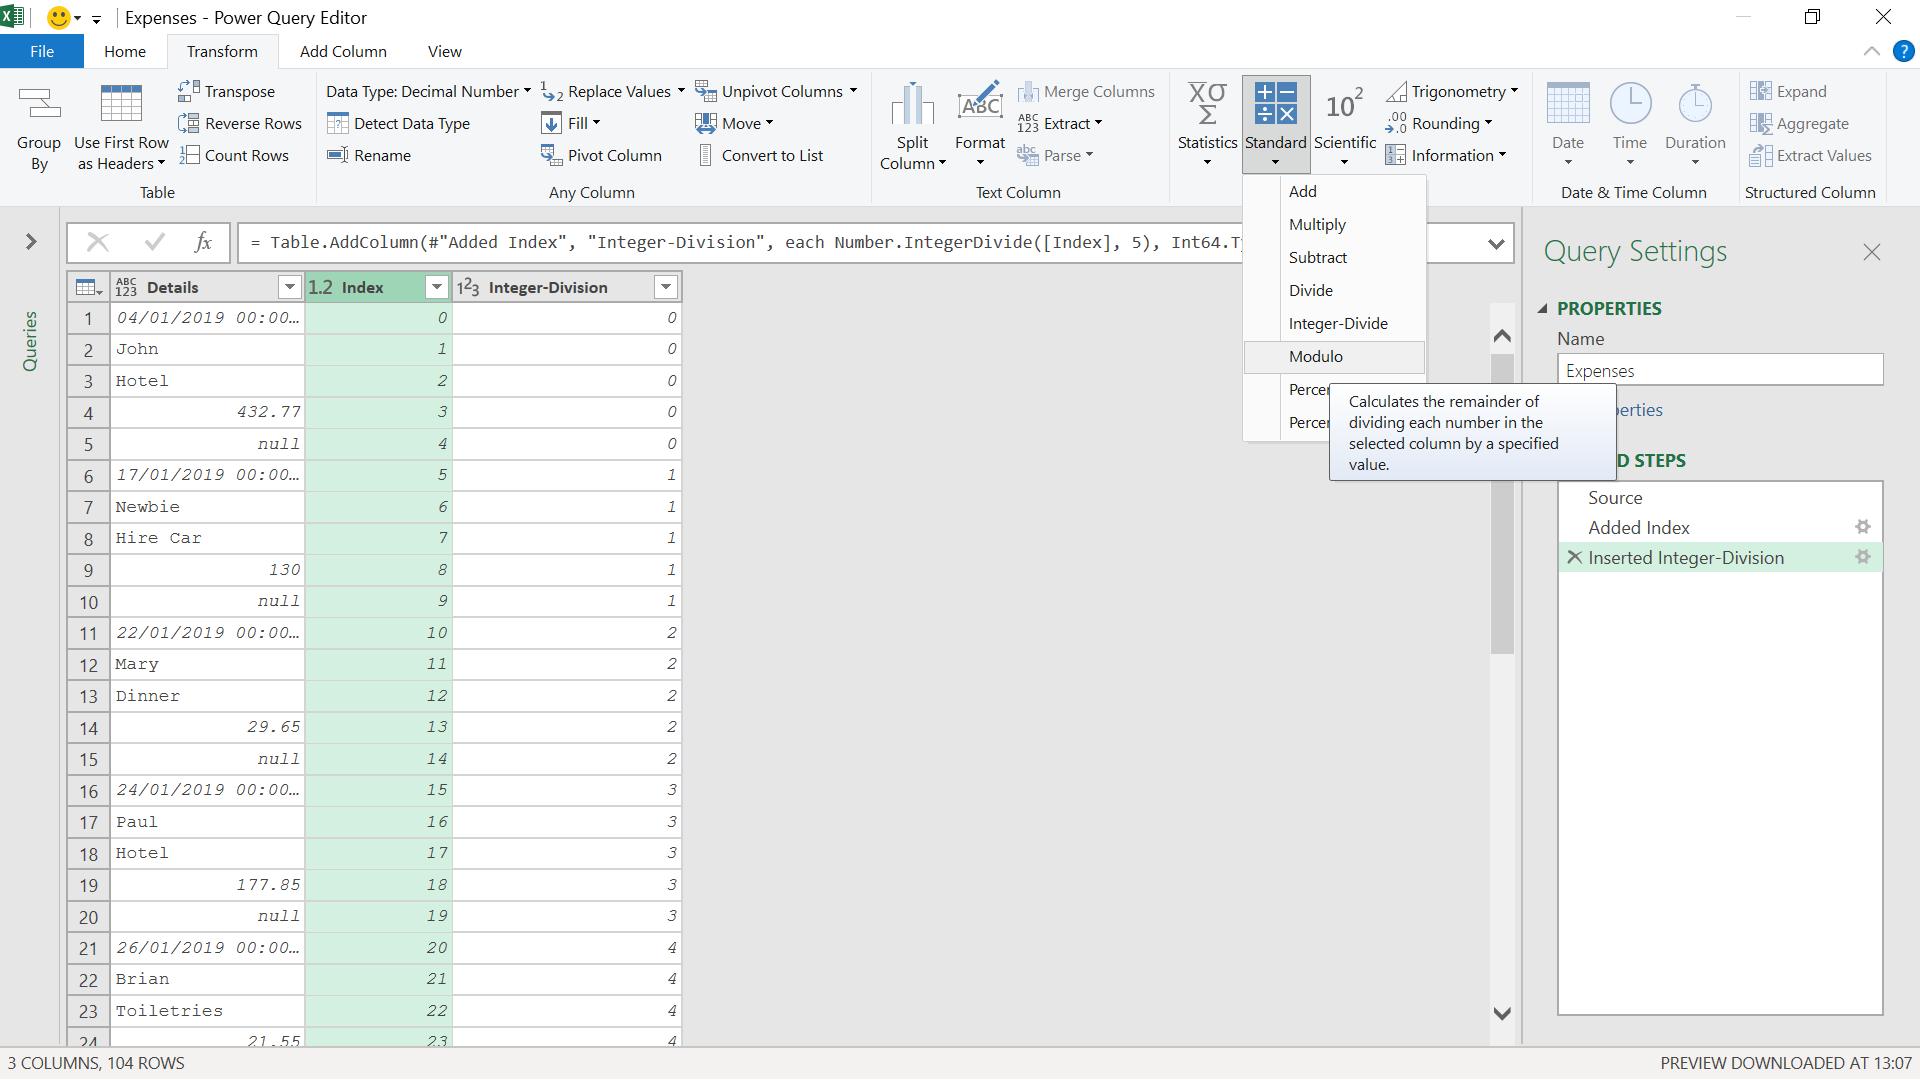
Since my data is in groups of five (5) rows, I can use another feature on the ‘Add Column’ tab, which is in the Standard dropdown of ‘From Number’.

Using ‘Integer-Divide’, I want to divide this Index column such that I retain only the integer part of the division result:

I choose to divide by five (5) and click ‘OK’.

I now have a column which counts my rows, and a column which identifies each group of data. I combine these by using the mod functionality. I will transform my Index column using the Modulo option in the Standard options in the ‘From Number’ section on the Transform tab.
I need to specify the value to use, which again is five (5), since that is the size of each data group.
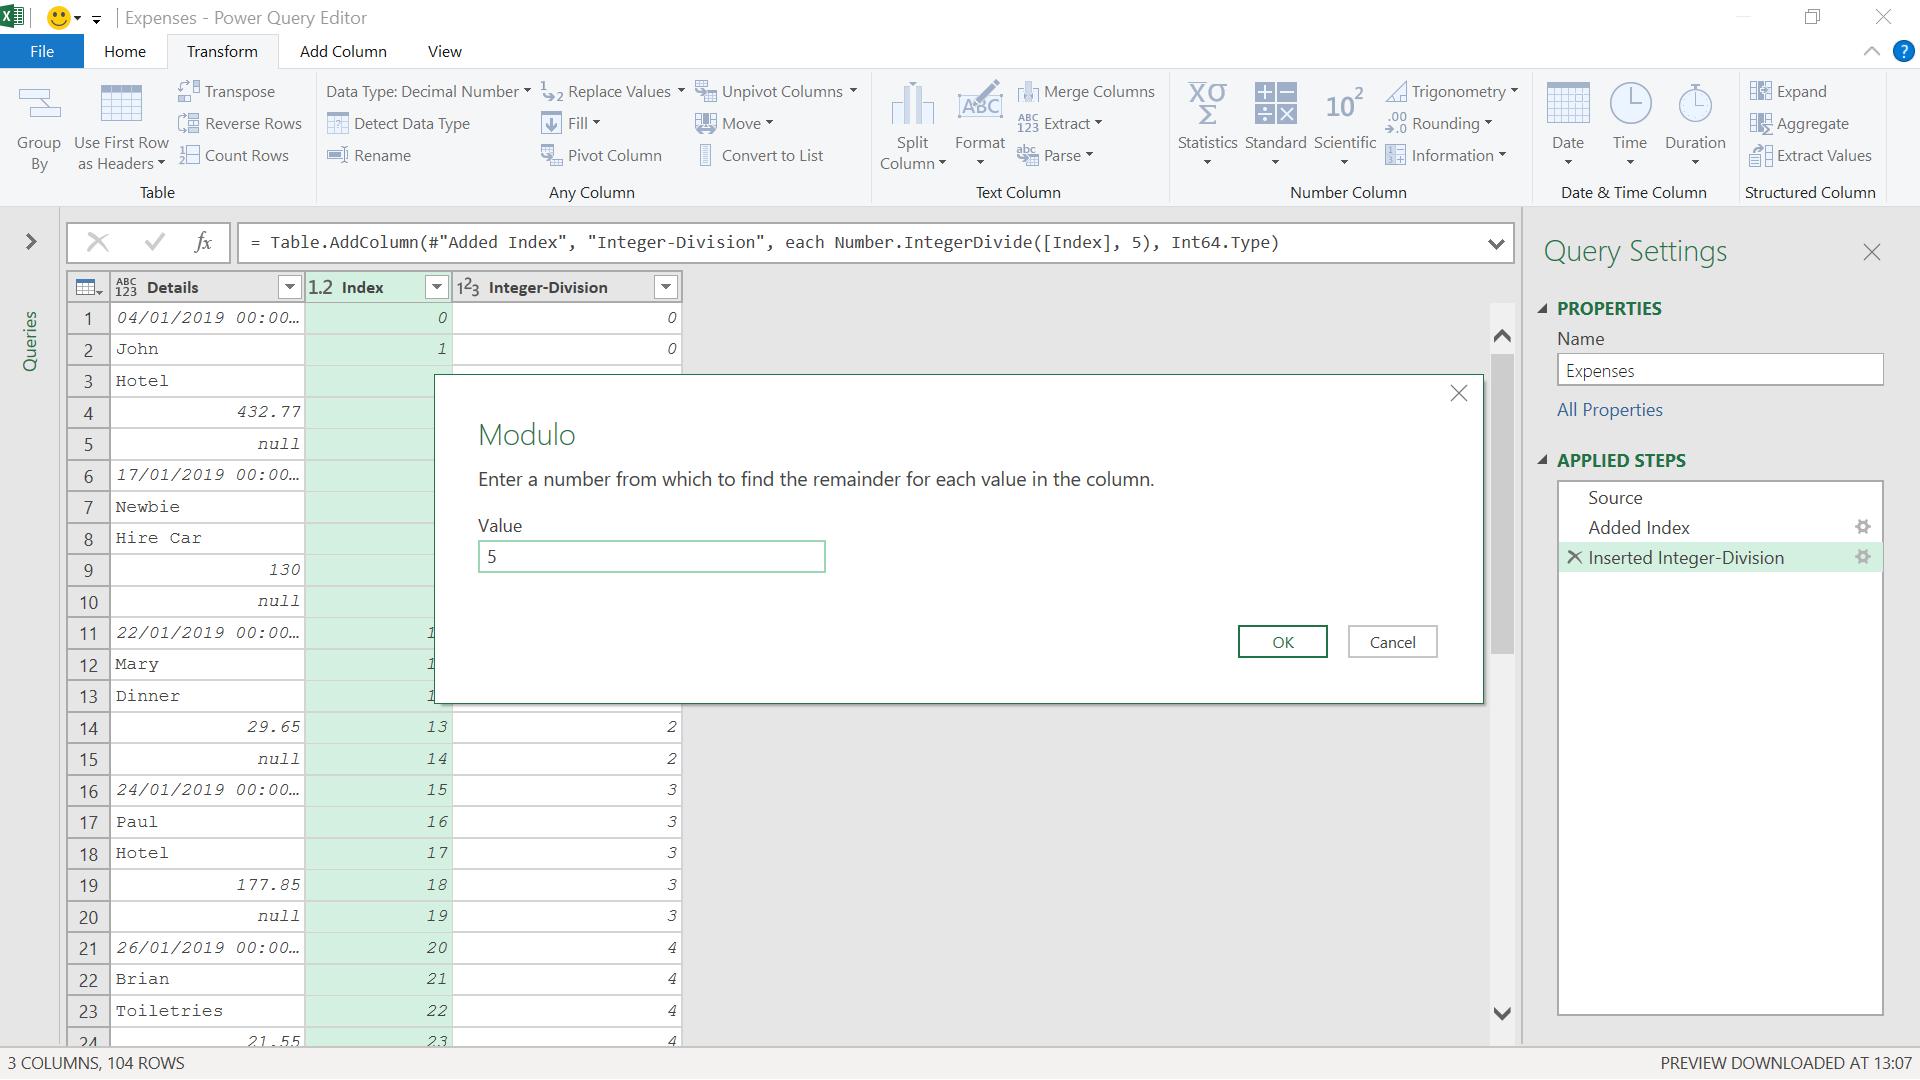
I click ‘OK’ to see the changes to my Index column.
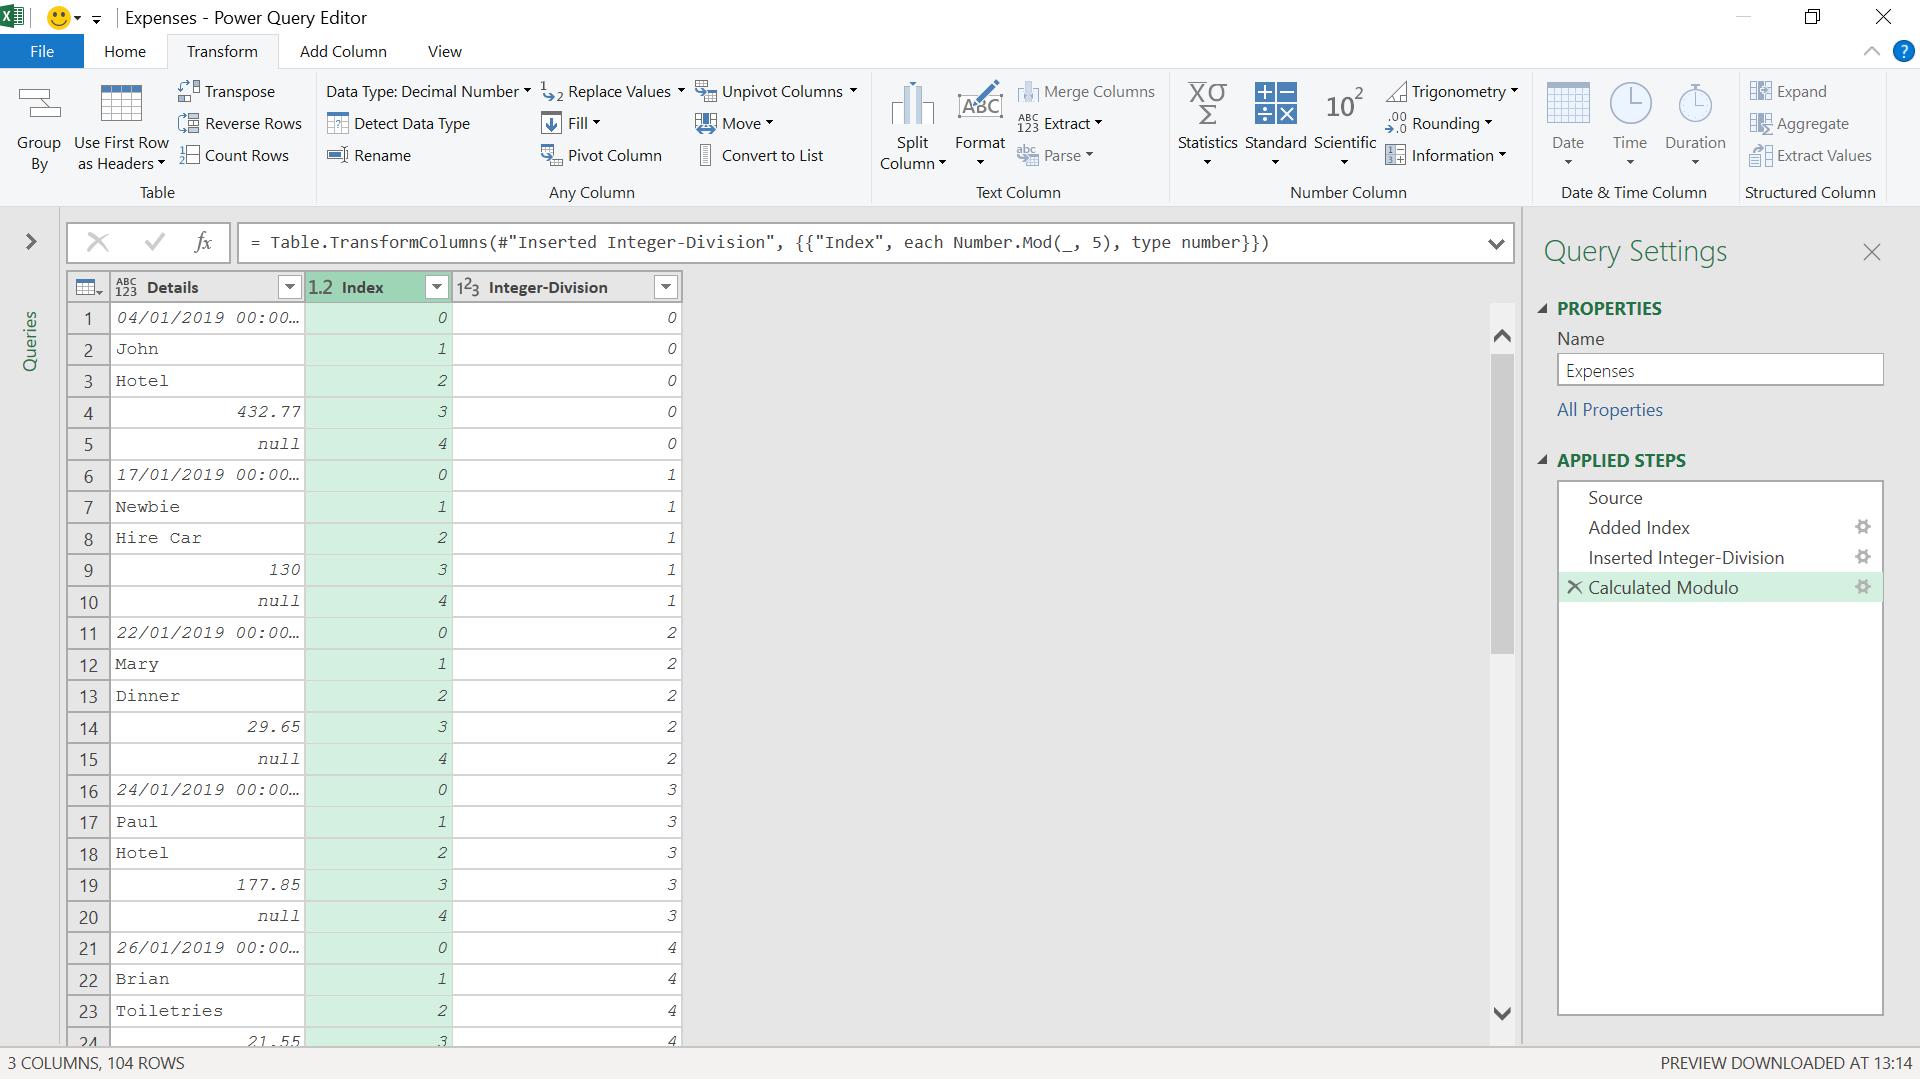
I now have each line in my data group numbered. I can use this to pivot my data. First, I move Integer Division to the first column place.

Second, I can select my Index column, and choose to ‘Pivot Column’ from the ‘Any Column’ section of the Transform tab.

I want to use the values in Details, and I don’t need to aggregate them in any way.

This is looking more promising. I just need to tidy up my data by removing excess columns and by renaming my remaining columns.

My data is now in a format where I can merge it with other expense data.
Come back next time for more ways to use Power Query!