
Power Query: Riveting Results Part 7
26 January 2022
Welcome to our Power Query blog. This week, I insert parameters from Excel cells into my query.
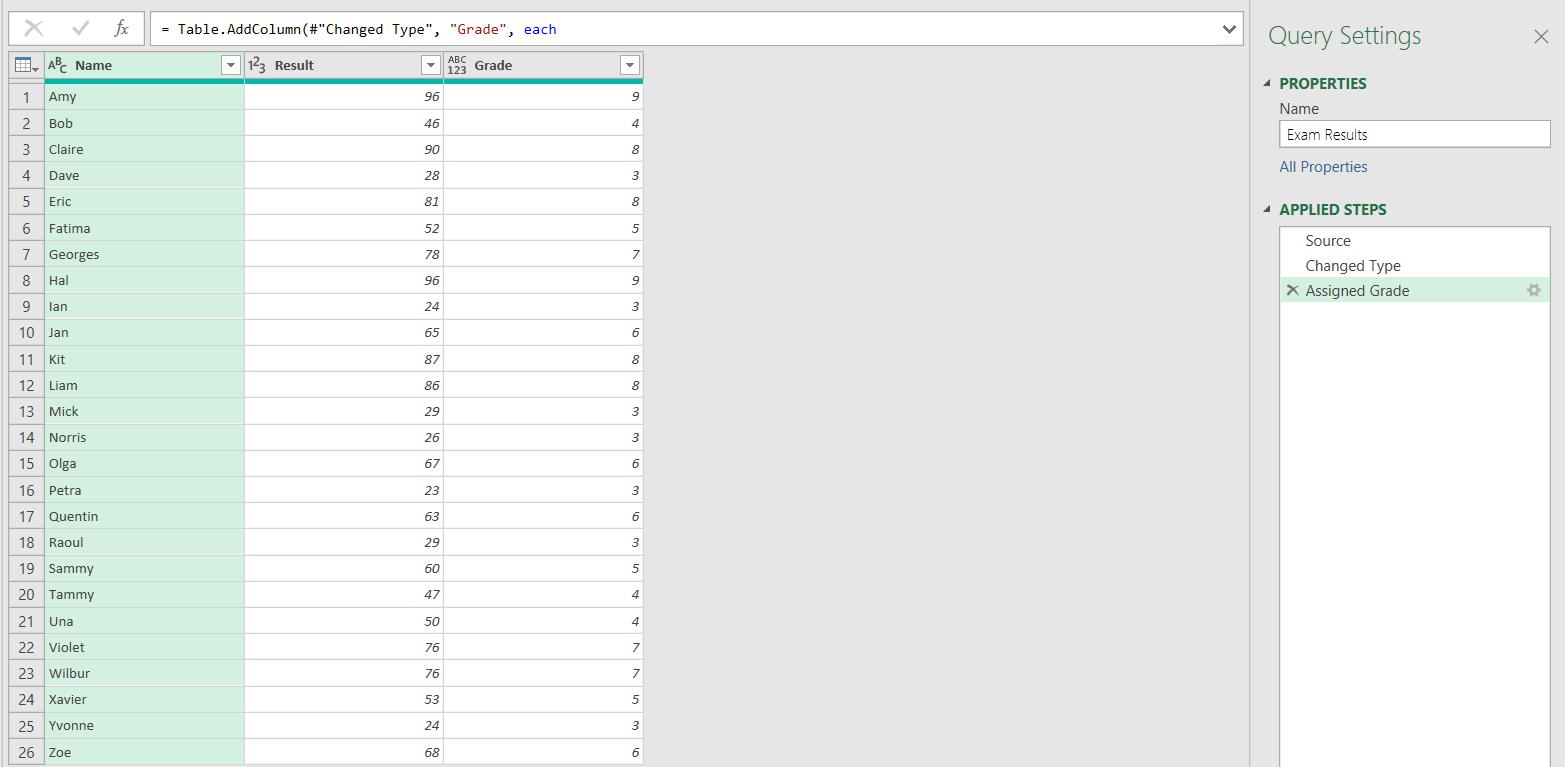
My salespeople are in self-isolation. This week, I continue looking at the exam results I created in Power Query: Riveting Results Part 1:
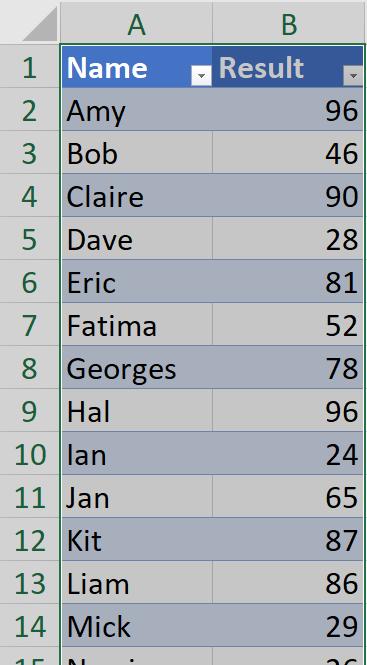
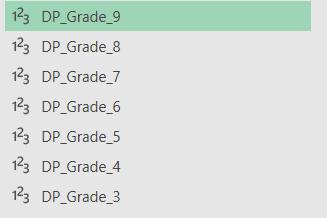
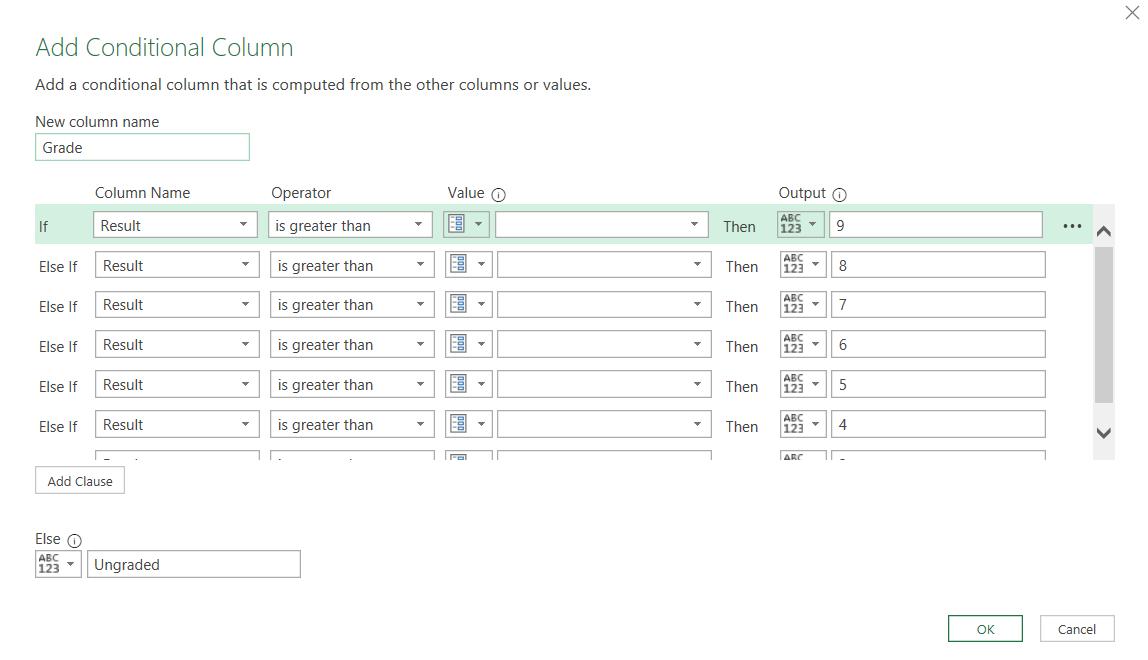
I will be grading the results, and I will be using this example to explore parameters. Last week, I defined named cells for the other grading bands and created queries for each band:
I will now apply these parameters to the Exam Results query and check that any changes to the Excel cells affect the outcome of the query.
I return to the Exam Results query.
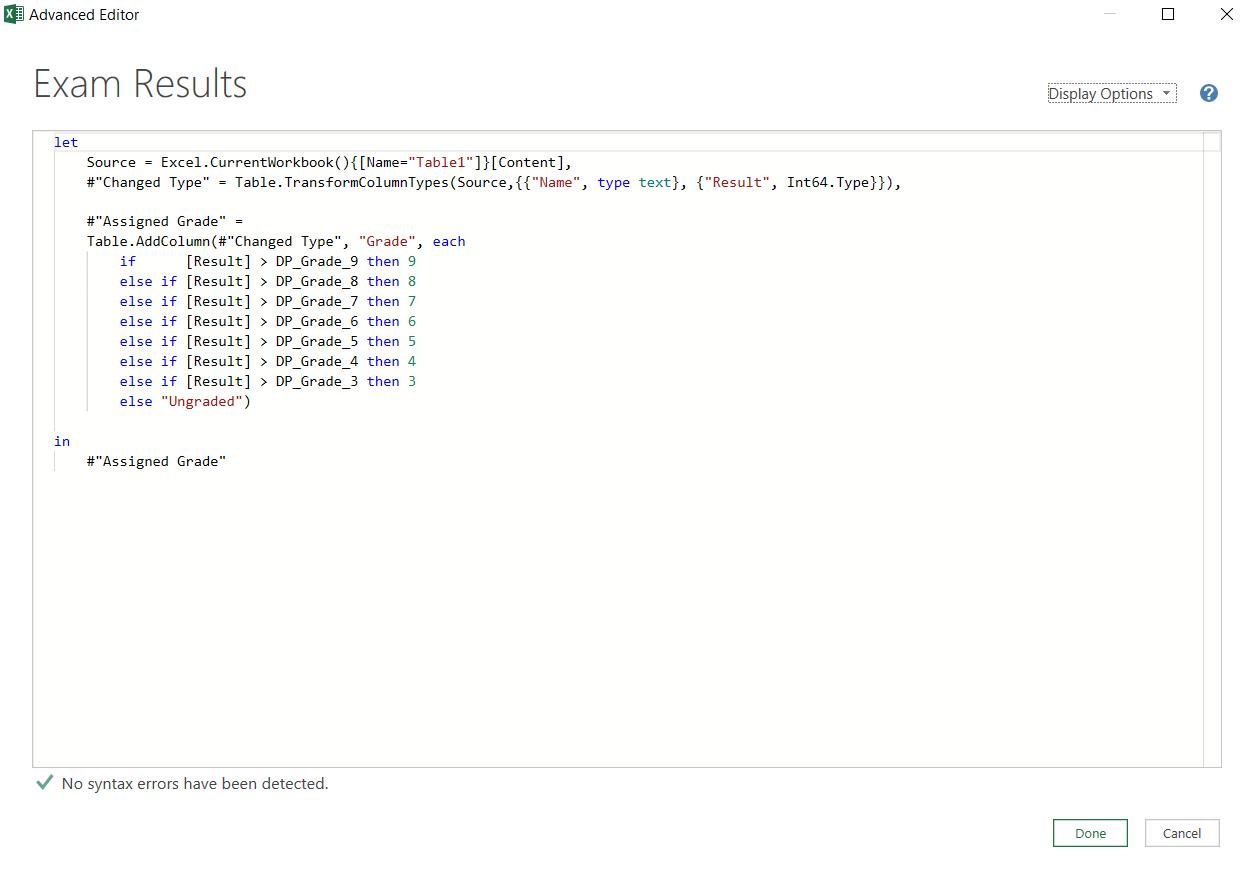
The easiest way to change the query to use the Excel controlled parameters is by editing in the Advanced Editor, which I can access from the Home tab:

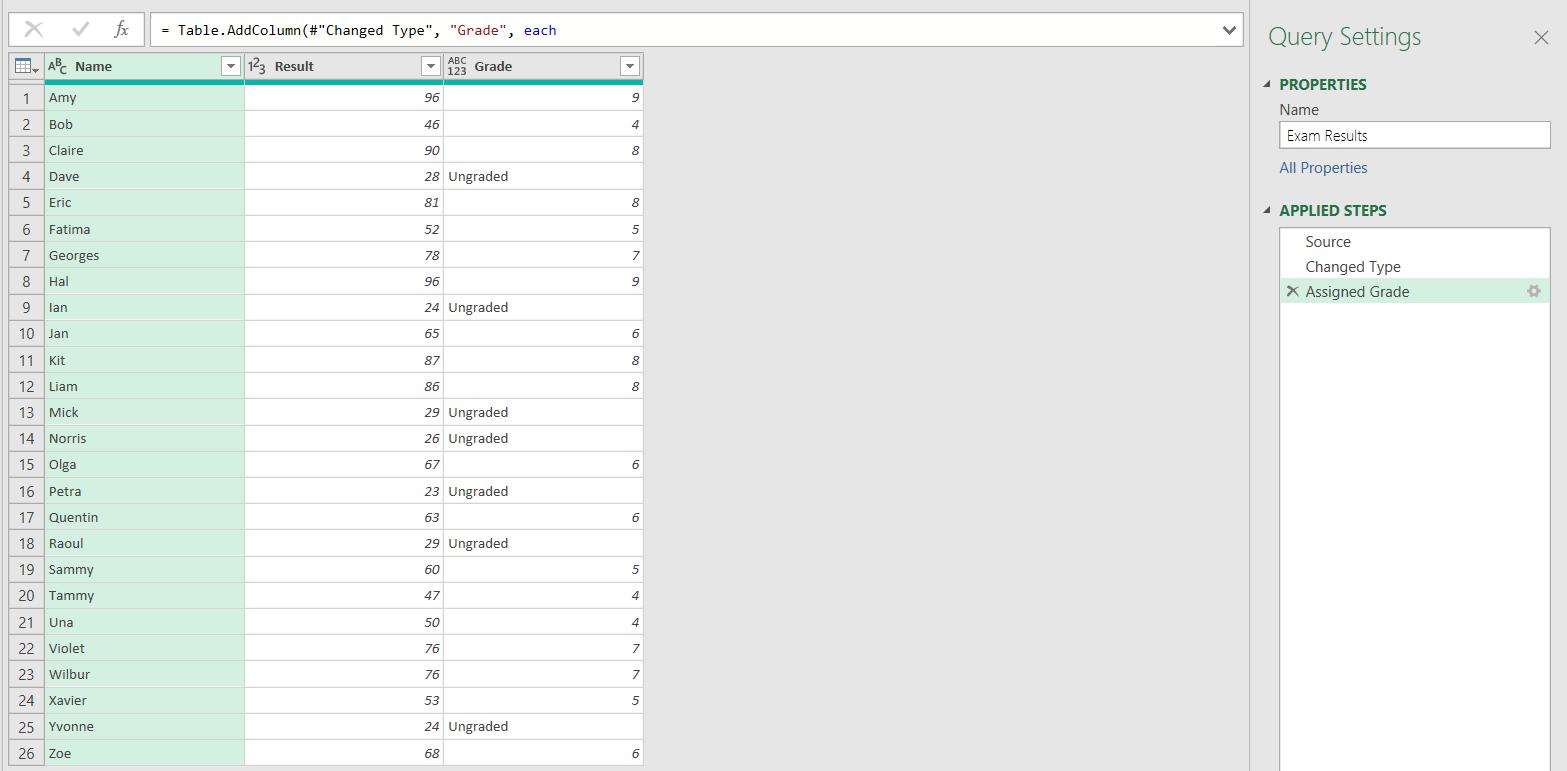
The ‘Assigned Grade’ step is changed from:
#"Assigned Grade" =
Table.AddColumn(#"Changed Type", "Grade", each
if [Result] > P_Grade_9 then 9
else if [Result] > P_Grade_8 then 8
else if [Result] > P_Grade_7 then 7
else if [Result] > P_Grade_6 then 6
else if [Result] > P_Grade_5 then 5
else if [Result] > P_Grade_4 then 4
else if [Result] > P_Grade_3 then 3
else "Ungraded")
to
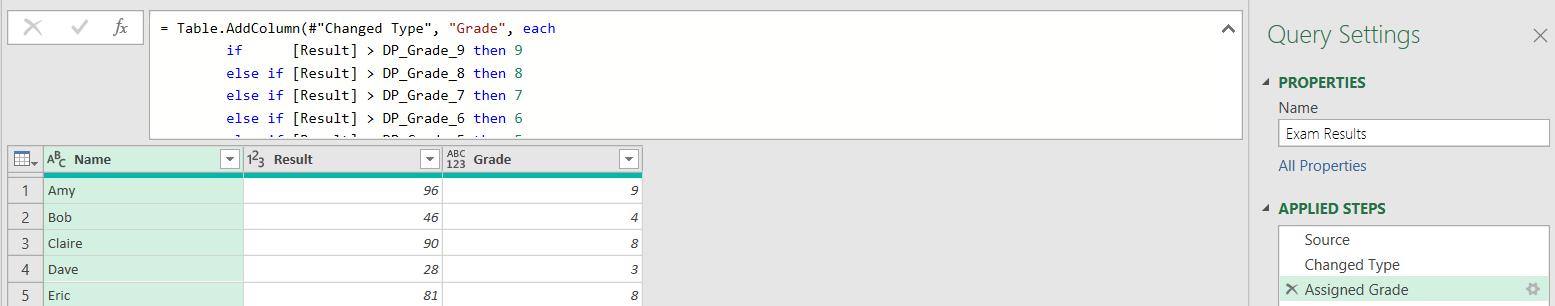
#"Assigned Grade" =
Table.AddColumn(#"Changed Type", "Grade", each
if [Result] > DP_Grade_9 then 9
else if [Result] > DP_Grade_8 then 8
else if [Result] > DP_Grade_7 then 7
else if [Result] > DP_Grade_6 then 6
else if [Result] > DP_Grade_5 then 5
else if [Result] > DP_Grade_4 then 4
else if [Result] > DP_Grade_3 then 3
else "Ungraded")
This works because each ‘DP_’ query represents one value:
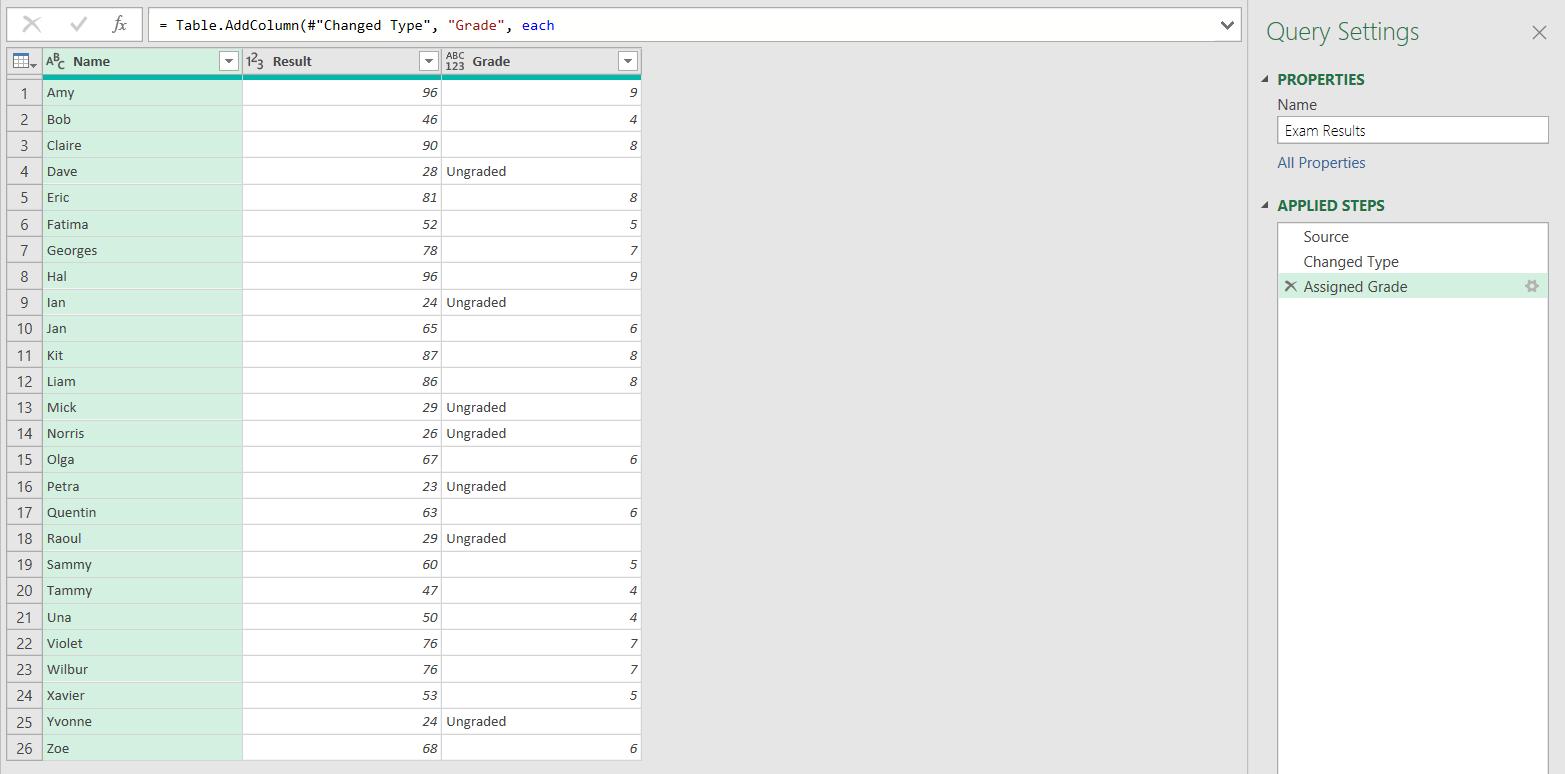
This currently has no effect on the results of the query, since the values are the same:
However, it does have an effect on the screen accessed by clicking on the cog (gear icon) next to the ‘Assigned Grade’ step:
Note that I cannot view the Value column now. Any changes must be made directly to the M code, either from the Advanced Editor or the Formula Bar:
Back in Excel, if I change the Named cell Grade_3 from 30 to 20 percent, the outcome will change when I refresh the Exam Results query:
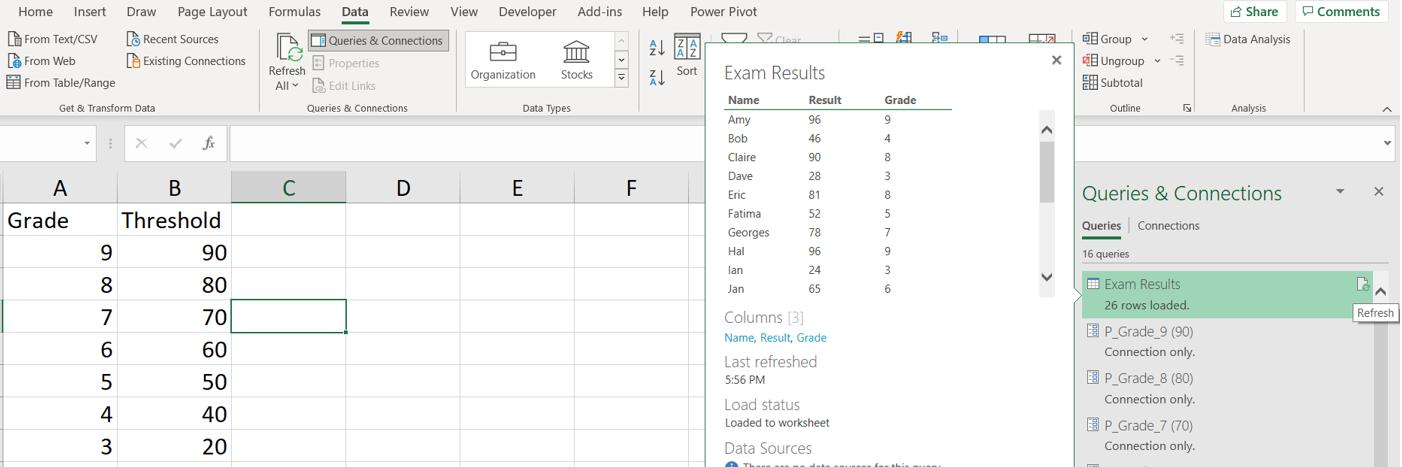
If I go back to Exam Results and view all the data, I can see that everyone has passed now!
Come back next time for more ways to use Power Query!