
Power Query: Row by Row
1 April 2020
Welcome to our Power Query blog. This week, I look at how to add a table of data to an existing query.
I need to create a table for my imaginary salespeople, but I only get one record at a time.
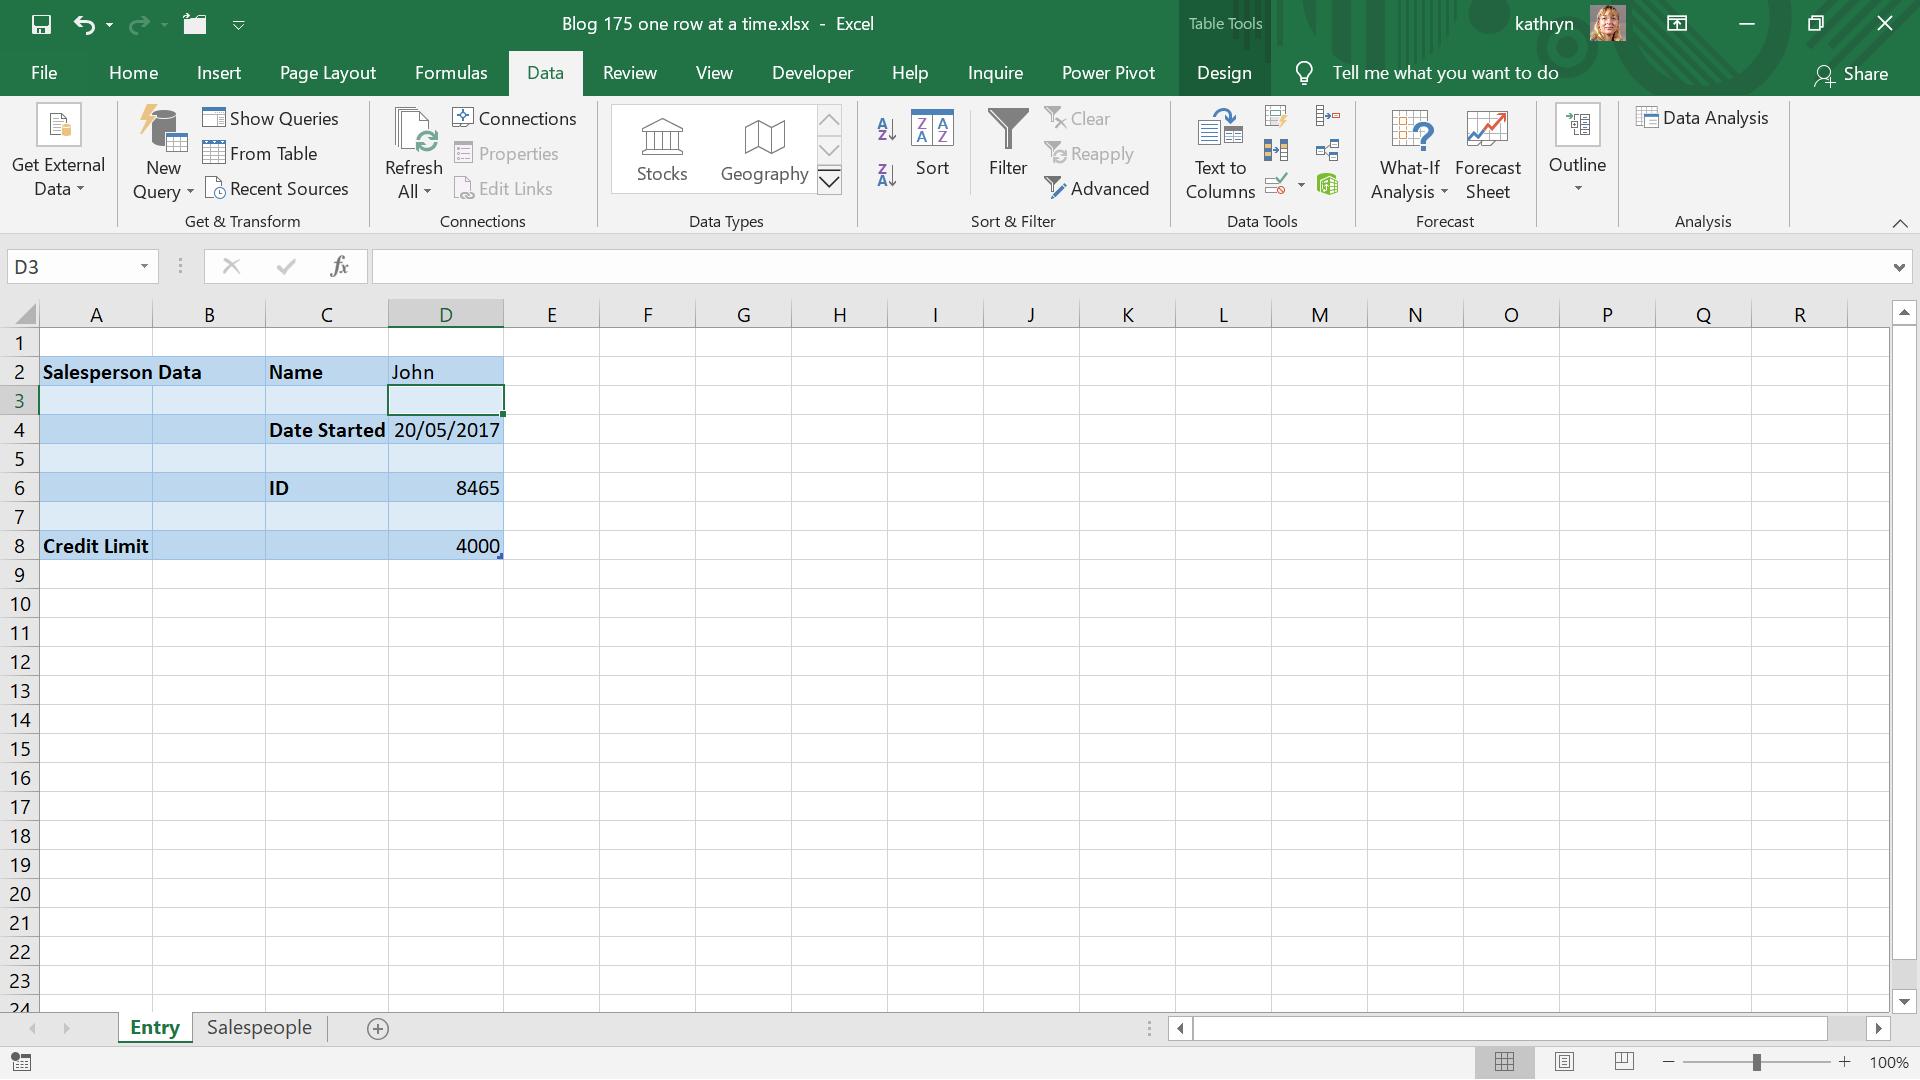
To set my table up, first I create a query for this data. I extract my data to Power Query using the ‘From Table’ option in the ‘Get & Transform’ section of the Data tab.
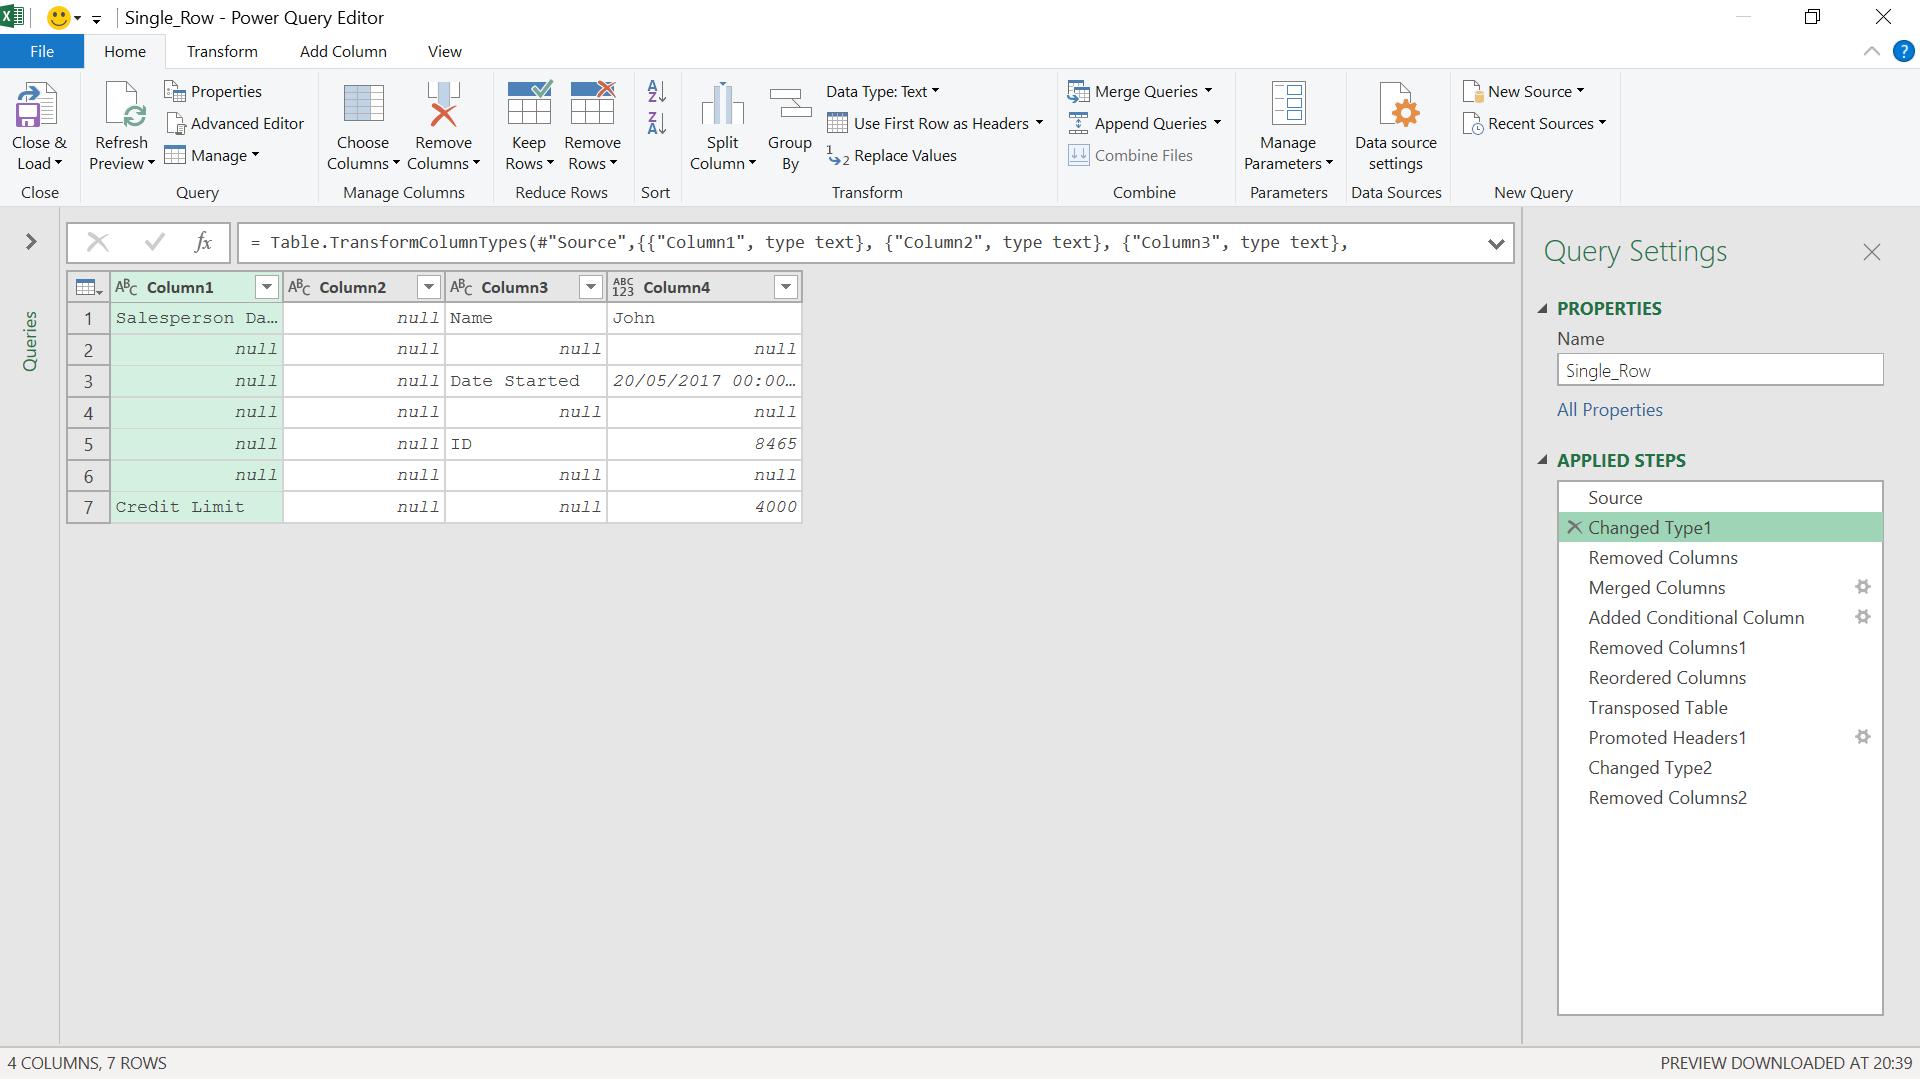
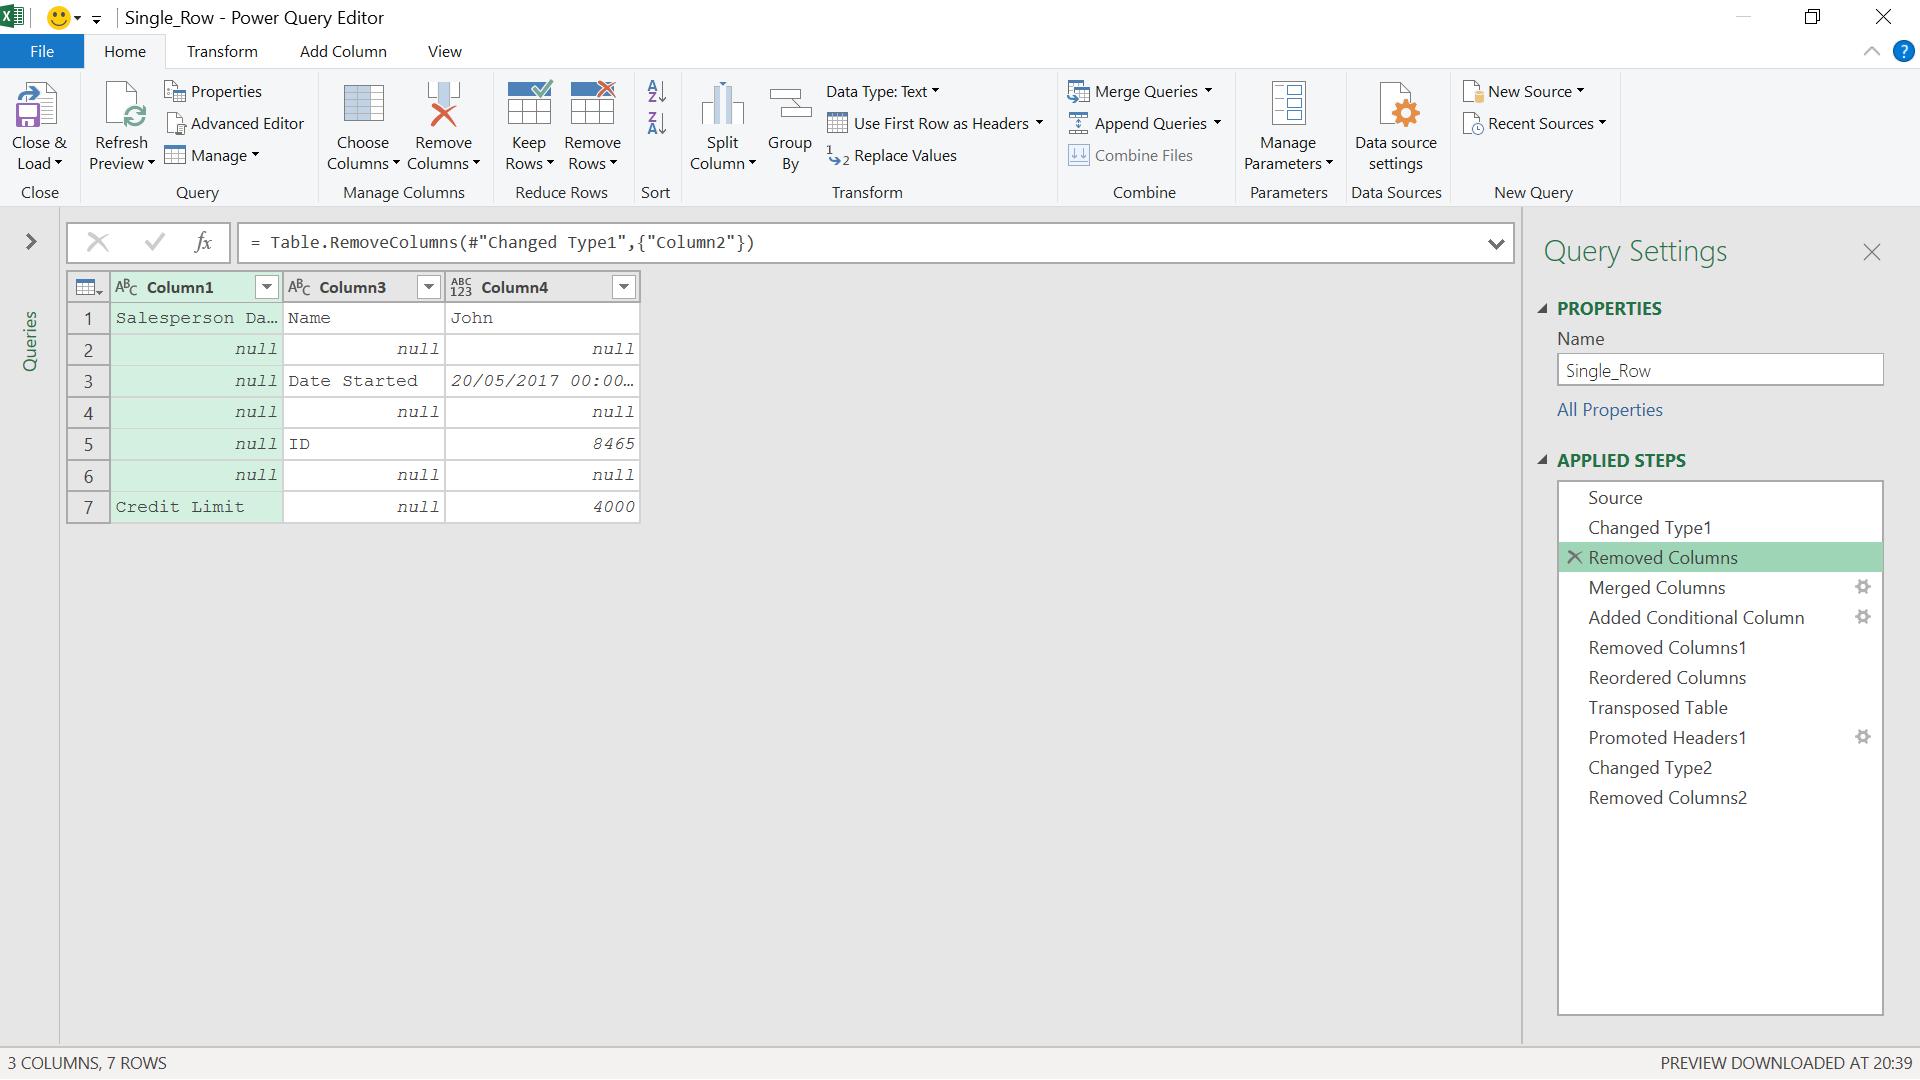
I need to get my data into a neat format with each piece of data in a separate column. I can see that I don’t need all my columns, so I remove Column2 by right-clicking that column, and choosing ‘Remove’.
Column1 and Column3 both contain header information, so I select them both by holding CTRL down and selecting ‘Merge Columns’ from the Transform tab.
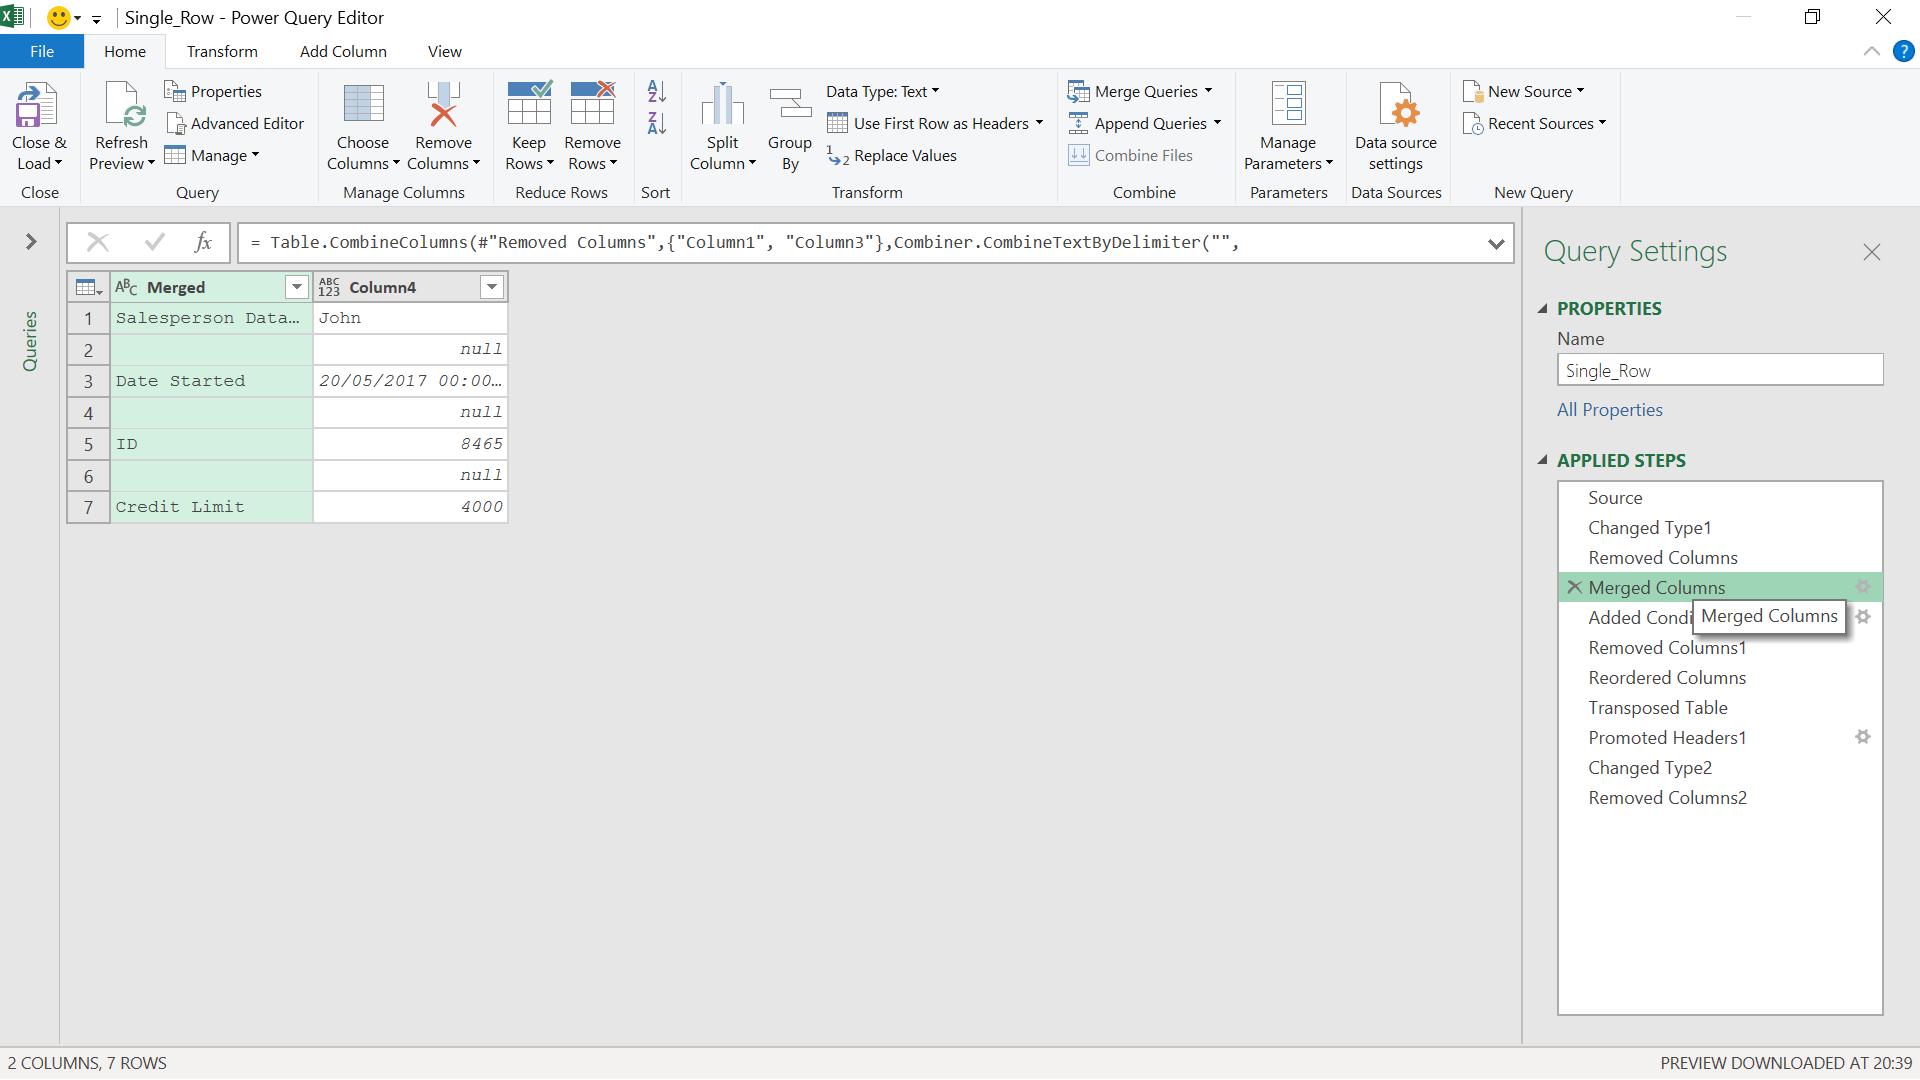
I change ‘Salesperson DataName’ to ‘Name’ by creating a conditional column in the ‘Add Column’ tab. I can then delete Merged. I reorder my columns so that Custom appears first, since it has the headings.
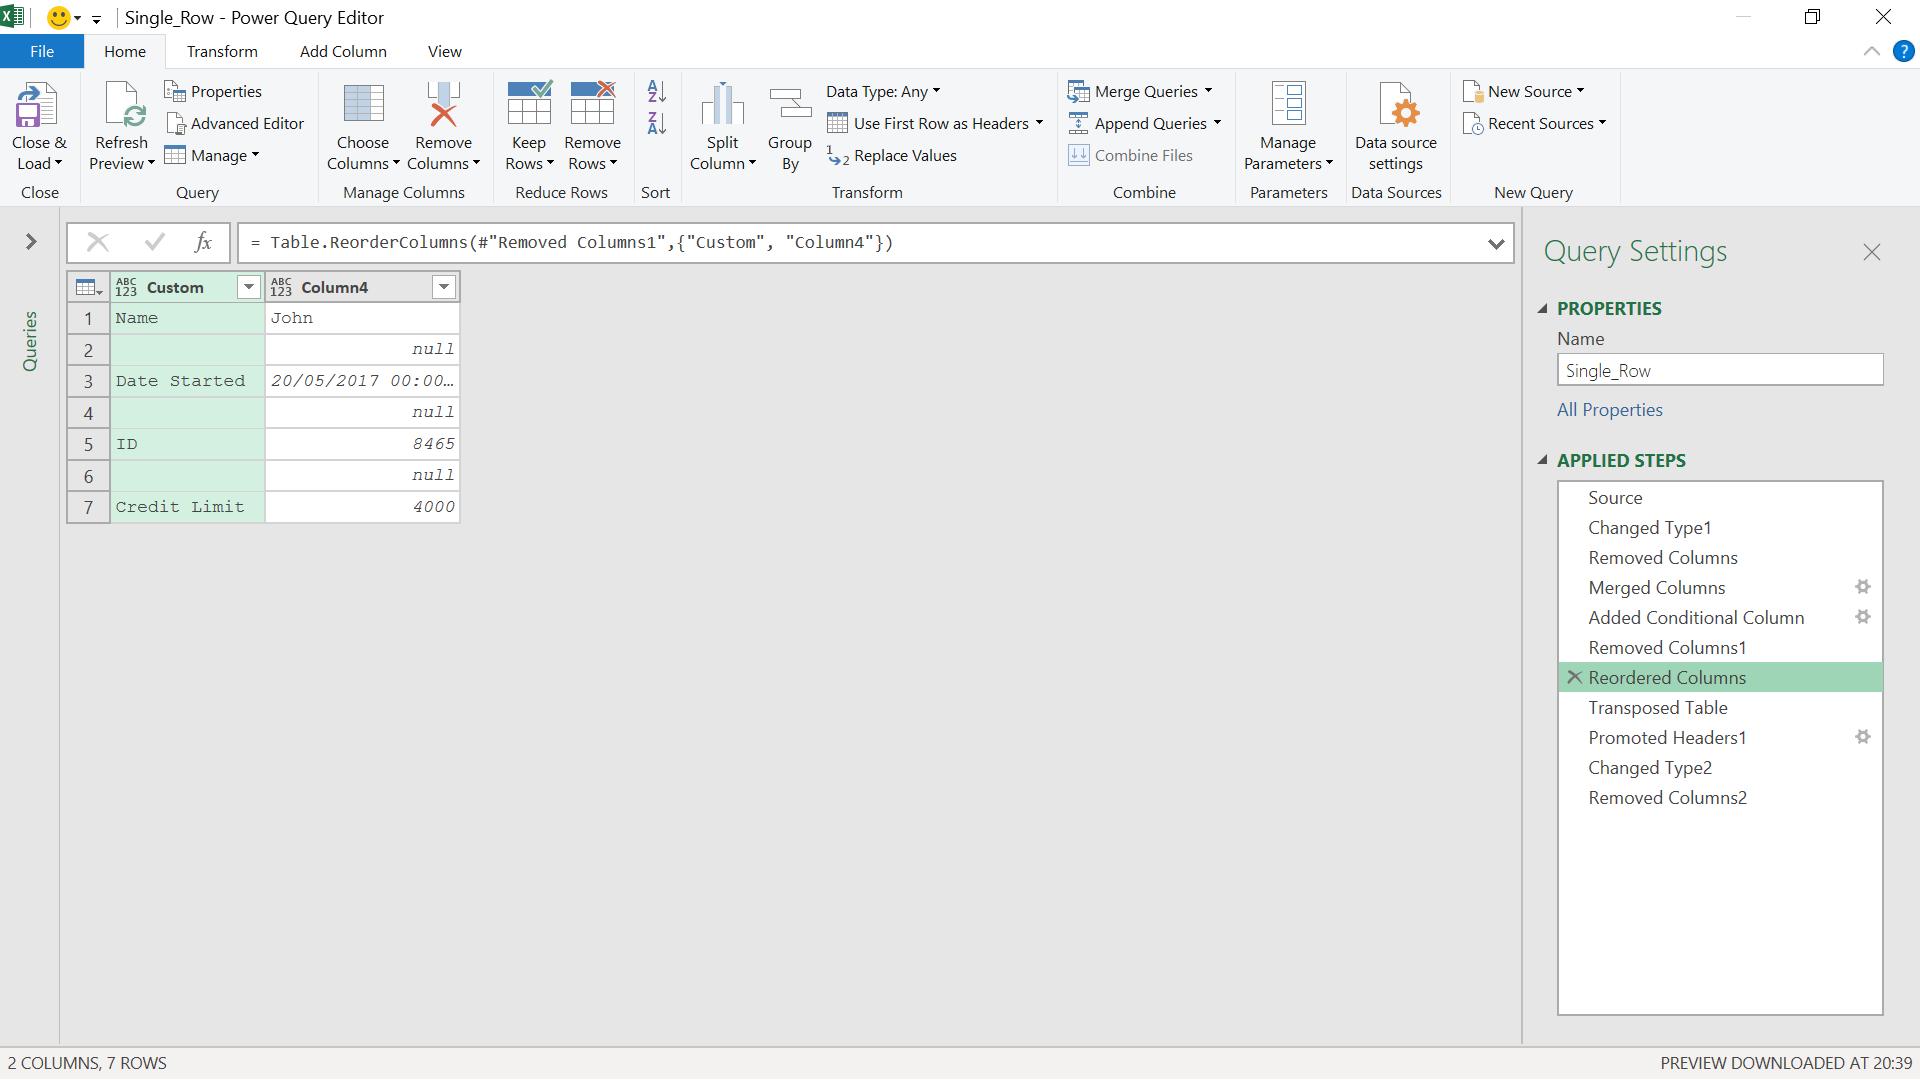
I transpose my table, from the Transform tab.
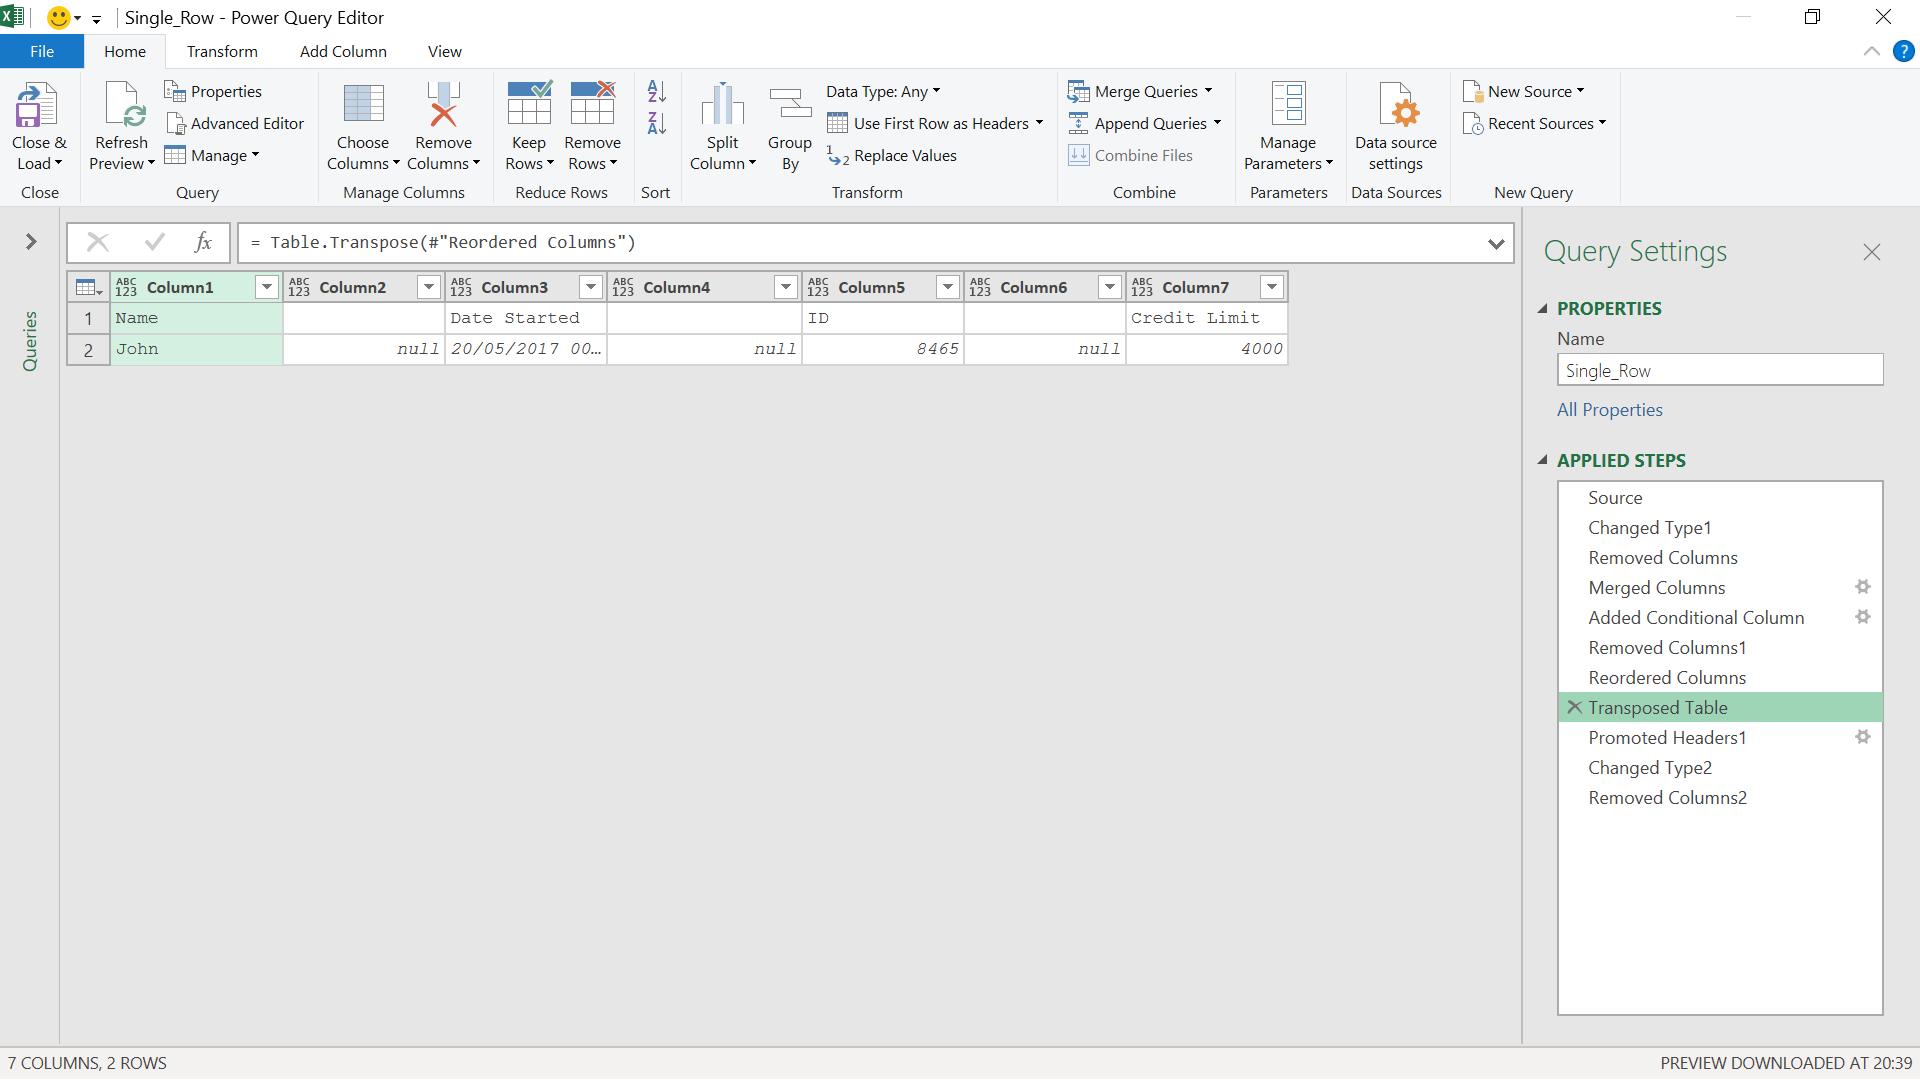
My data is nearly there – I promote the first row to headers and remove the empty columns.
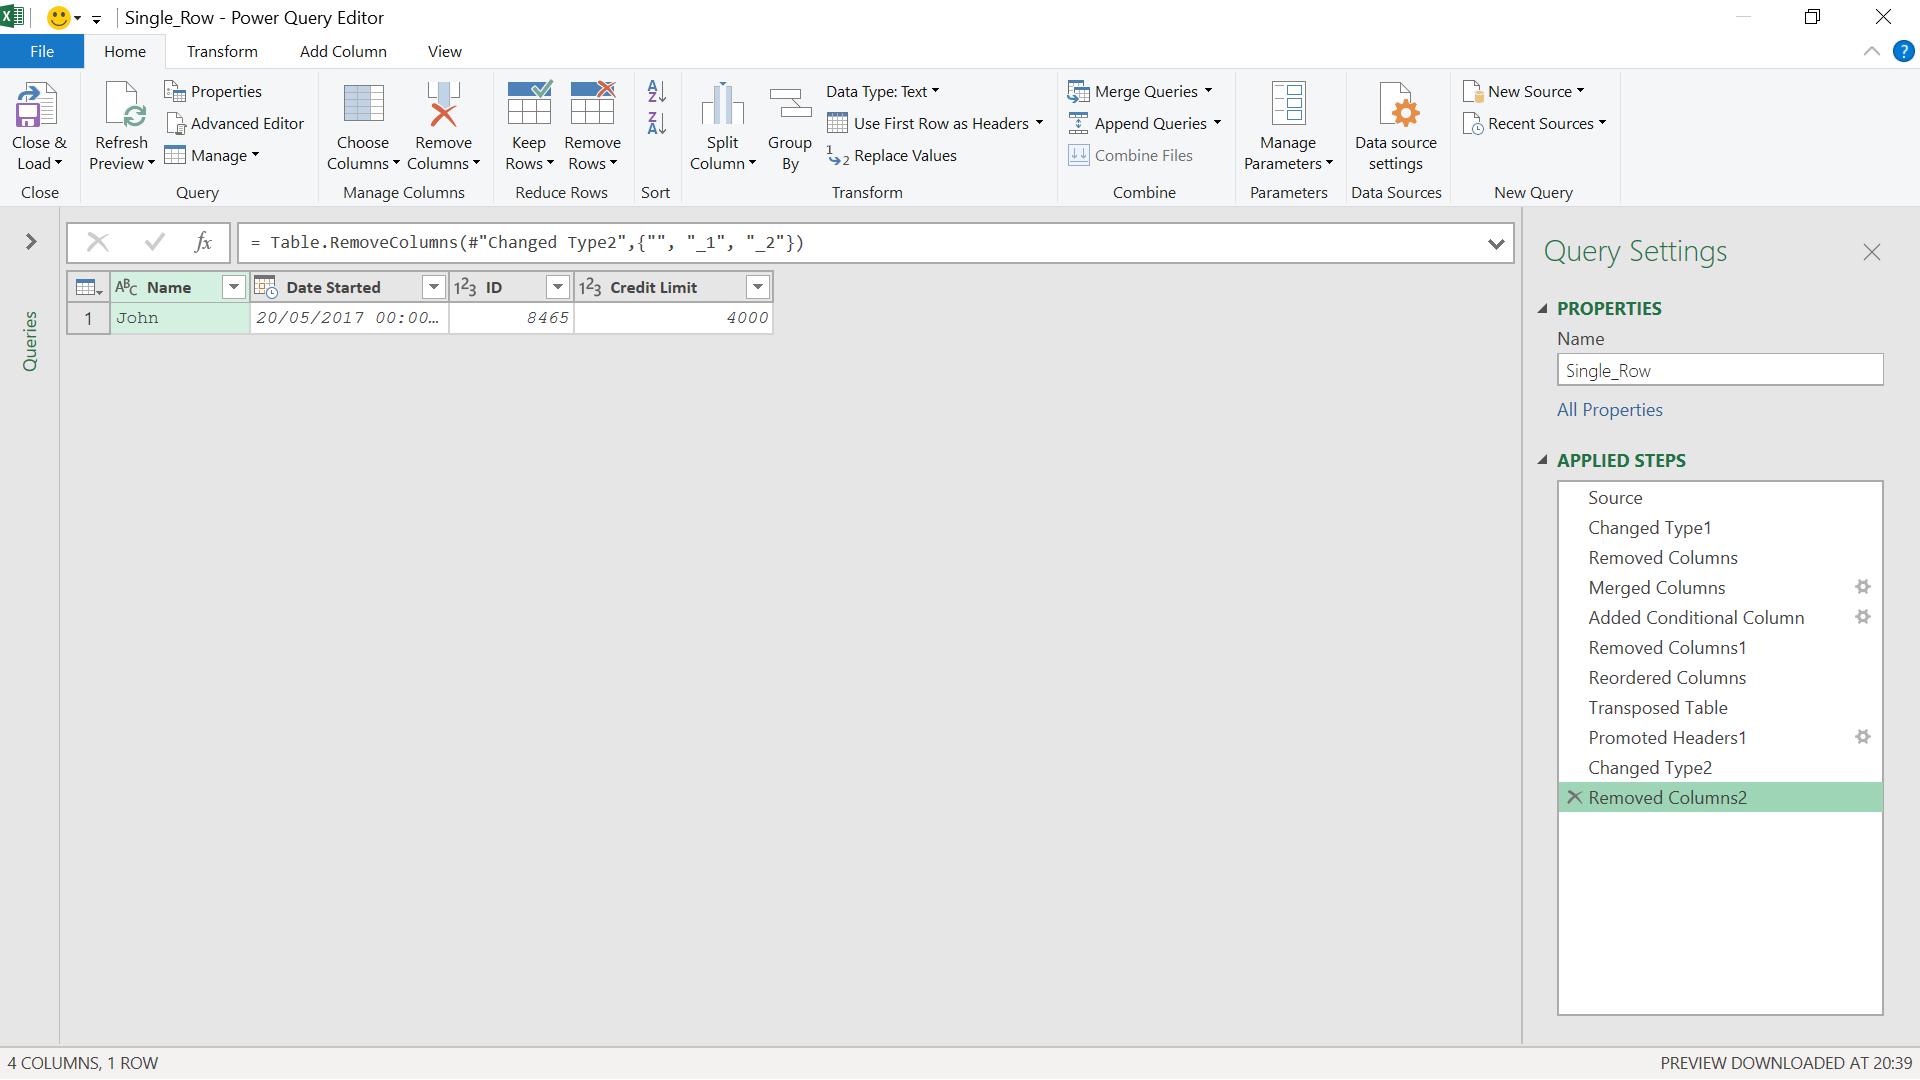
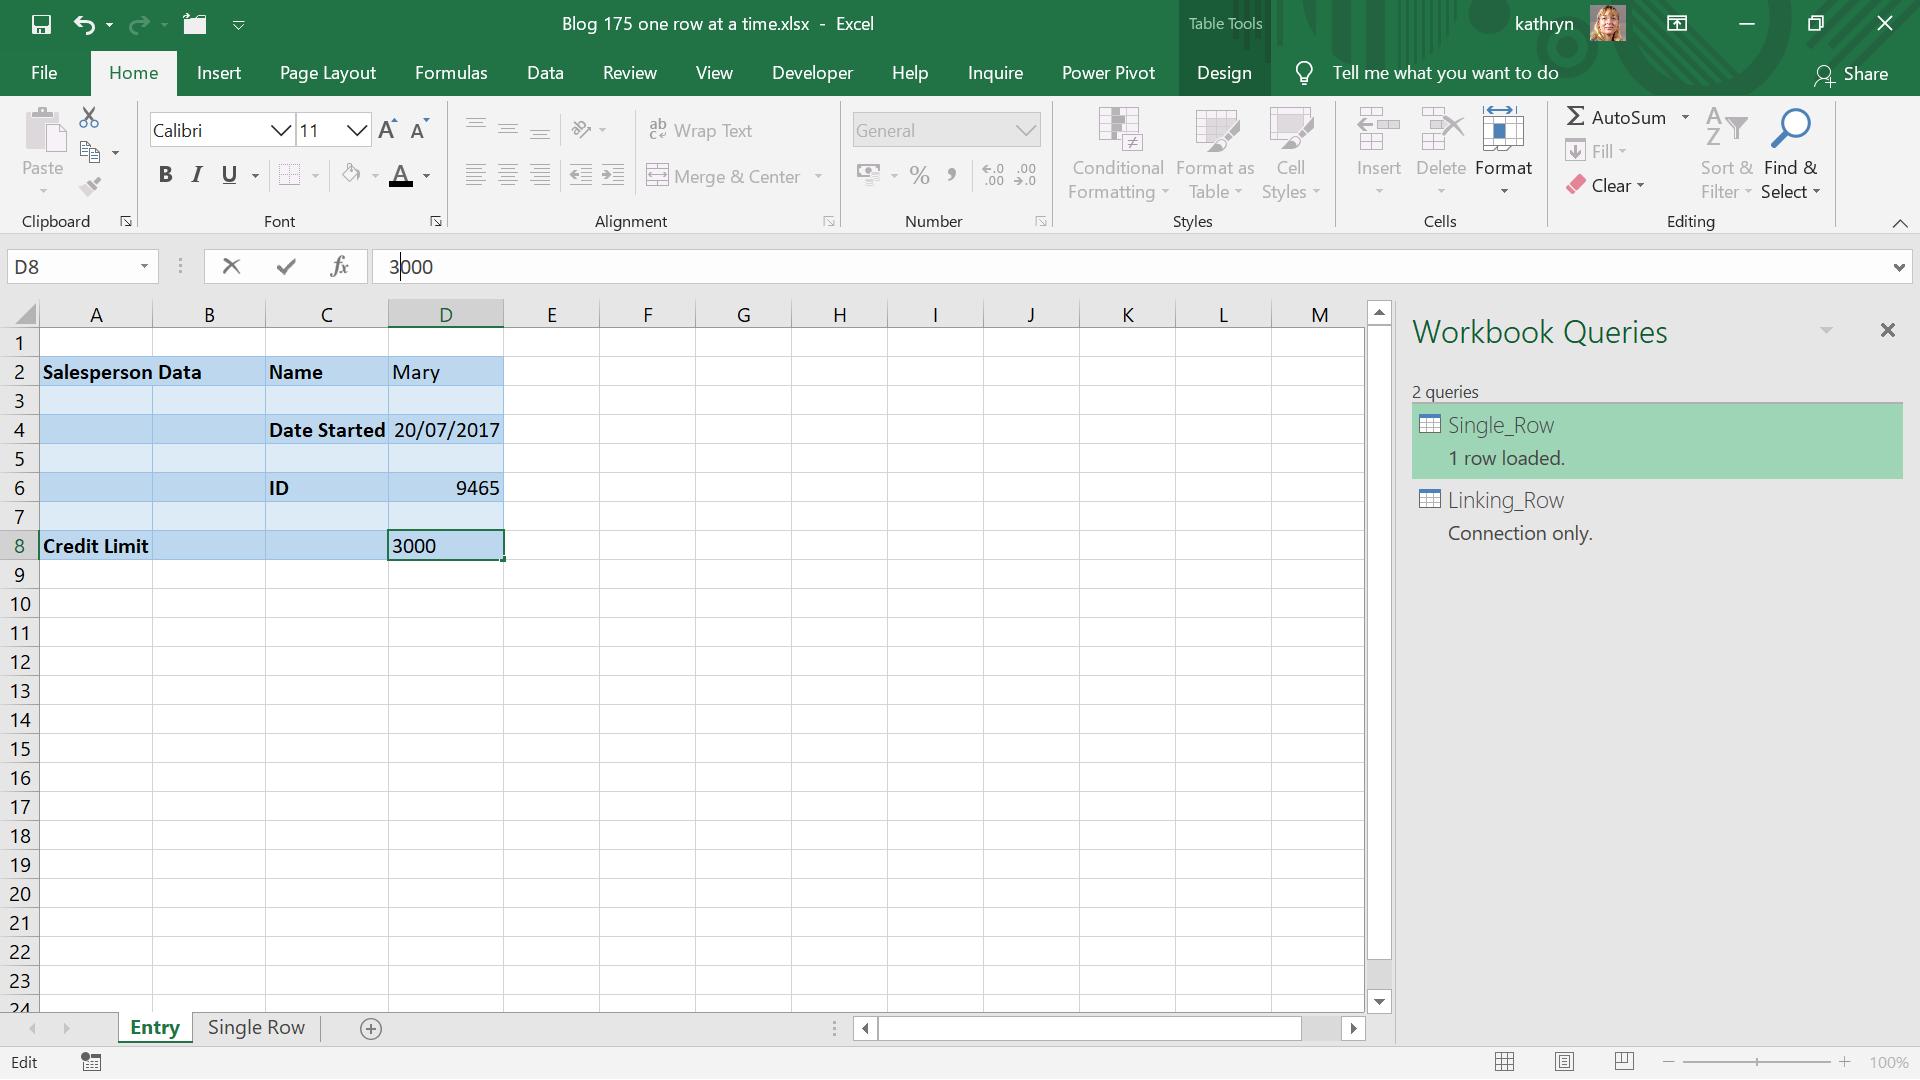
I have my Single_Row query, which I load to an Excel worksheet.
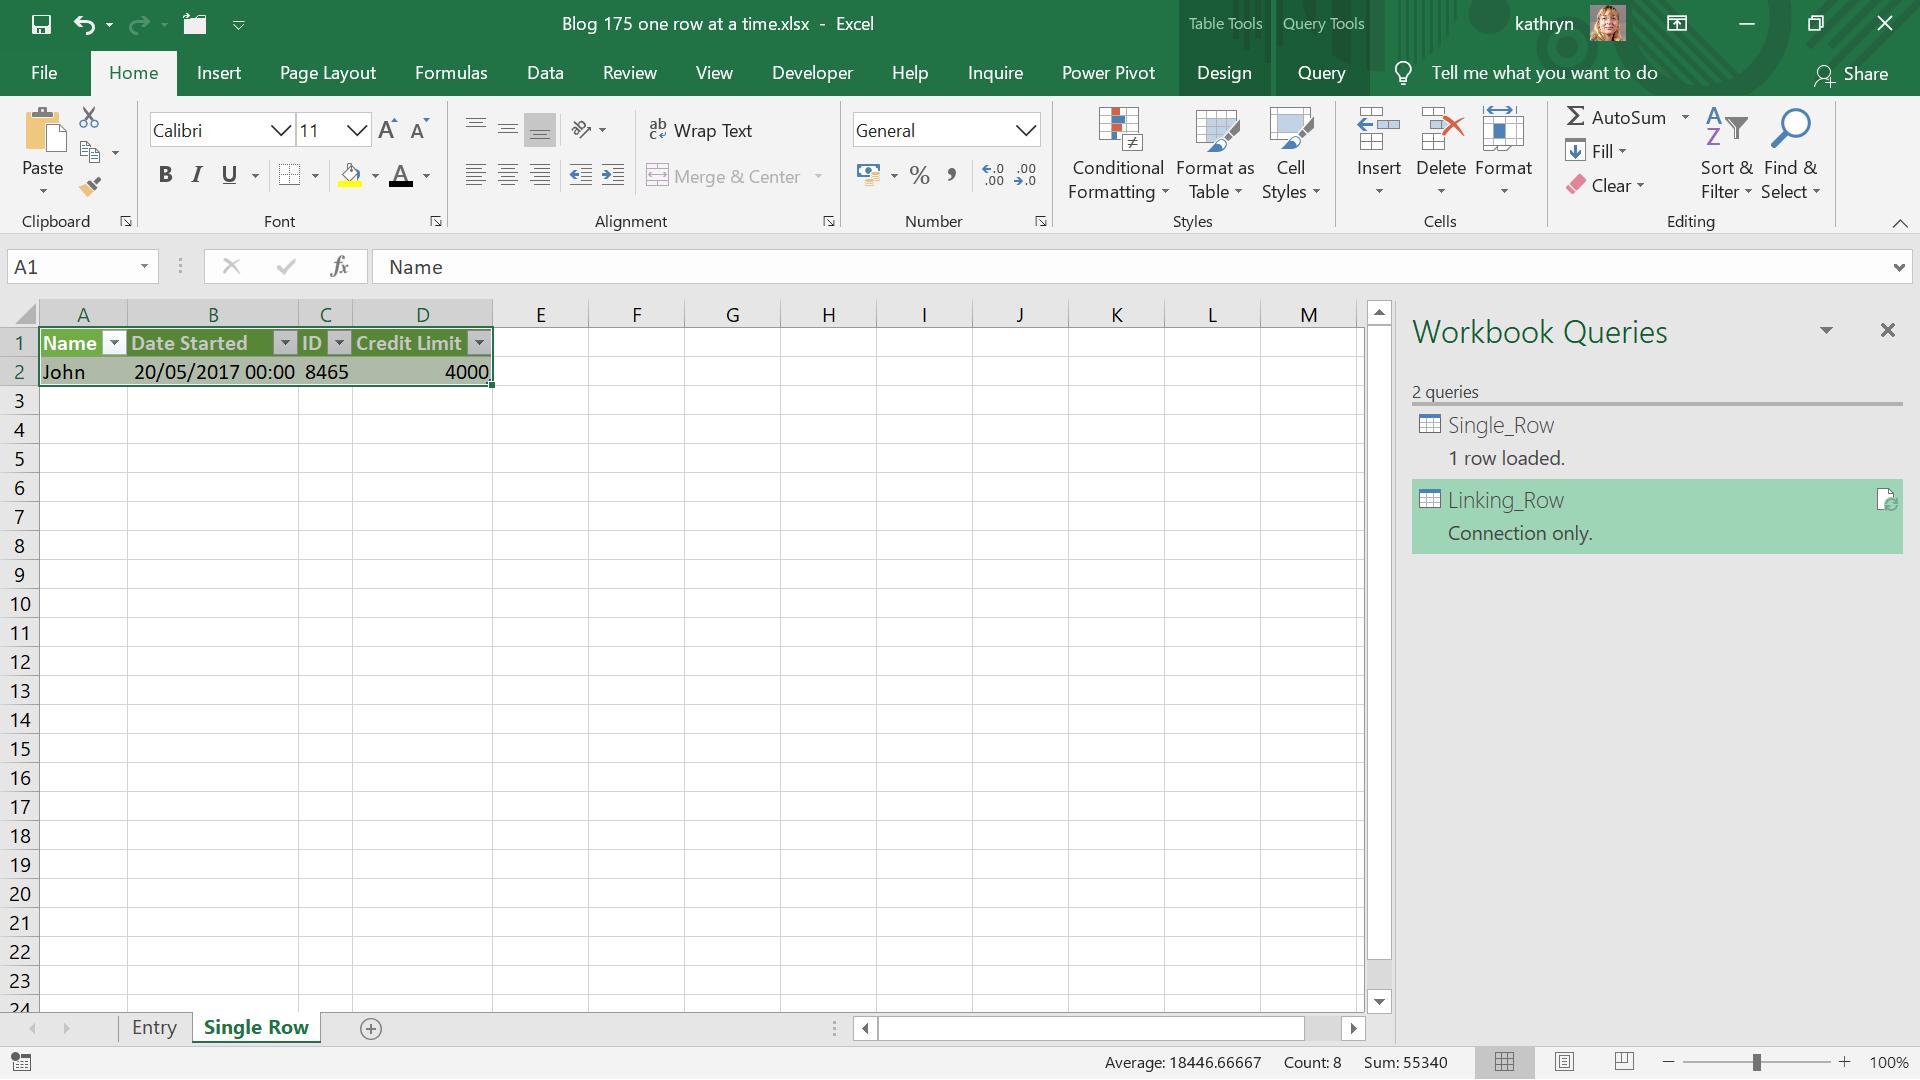
Next, I extract this table to a new query which I call Linking_Row, which I save as connection only. At this point Single_Row and Linking_Row contain the same data. With this in mind, I go back to ‘Single Row’:
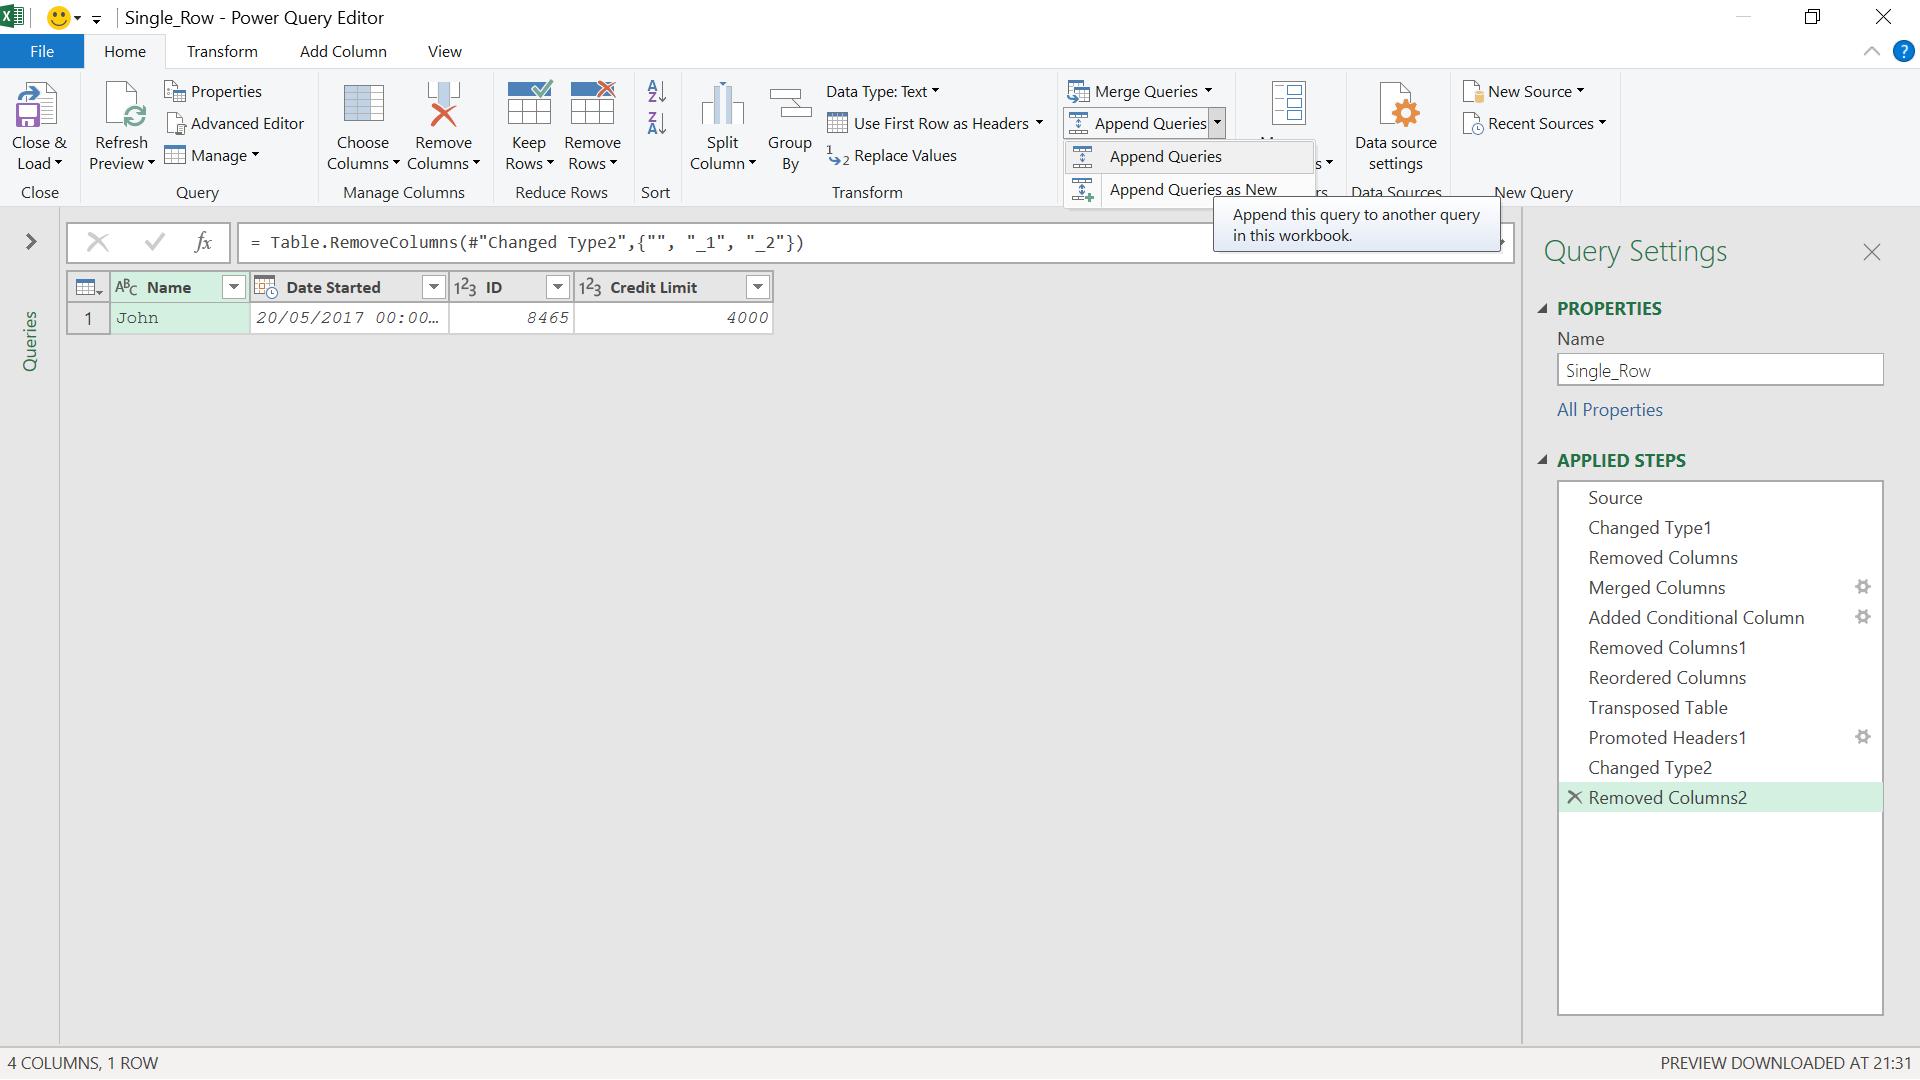
I choose to ‘Append Queries’ (not ‘as New’).
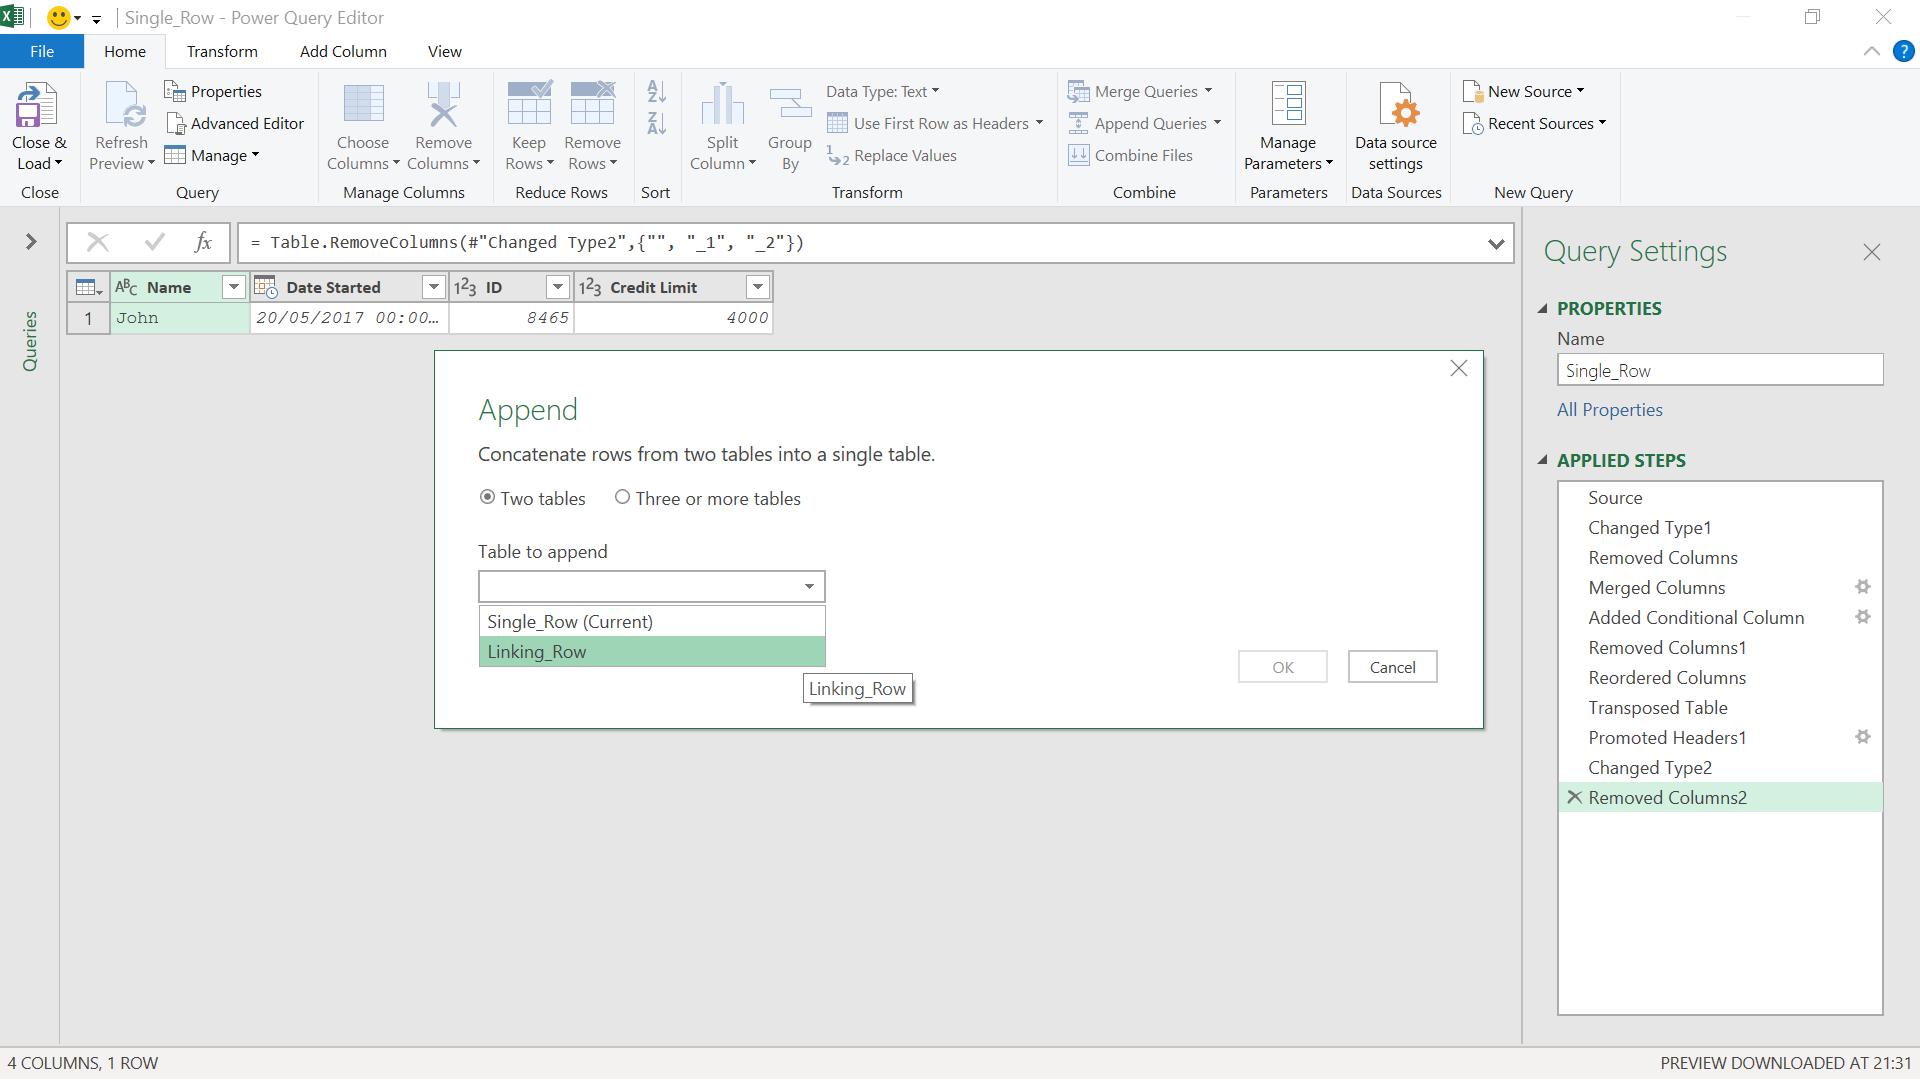
I append Linking_Row.
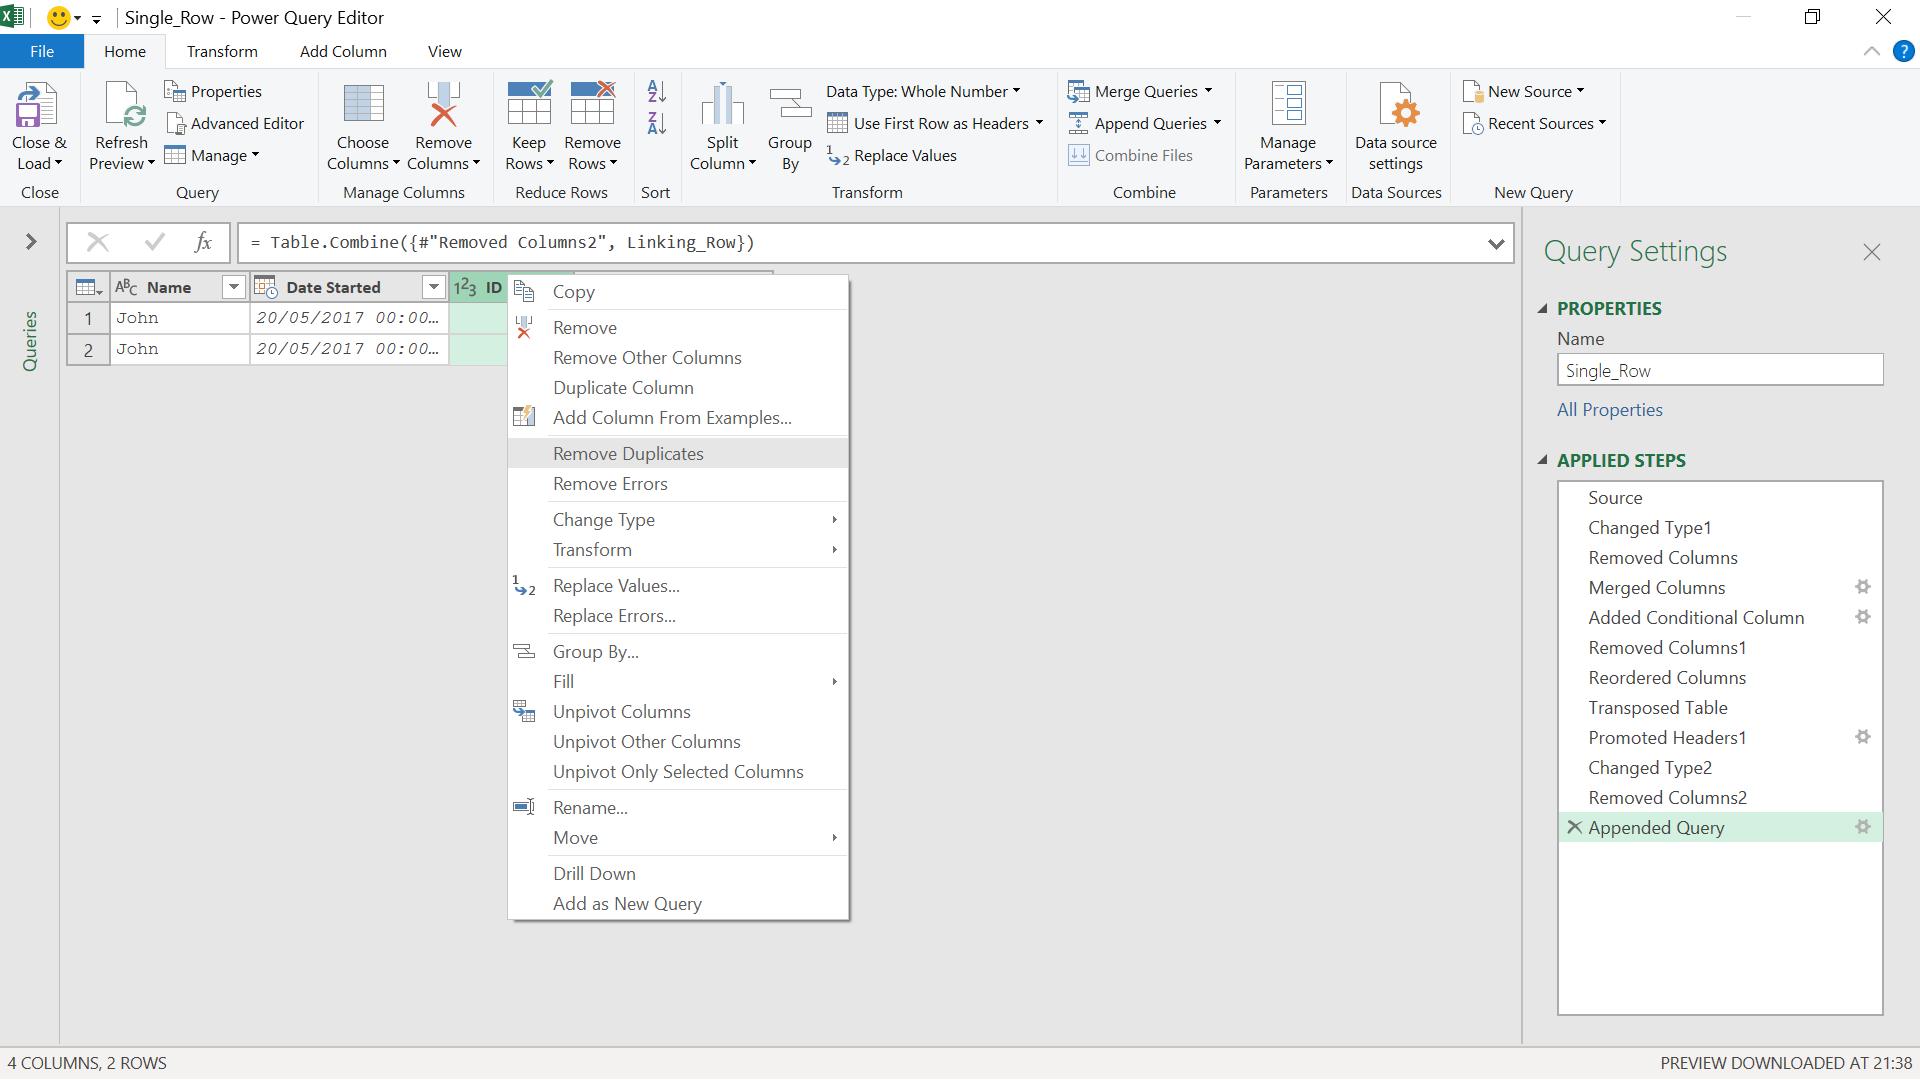
I now have two rows, and since the ID is unique, I can right-click ID and ‘Remove Duplicates’.
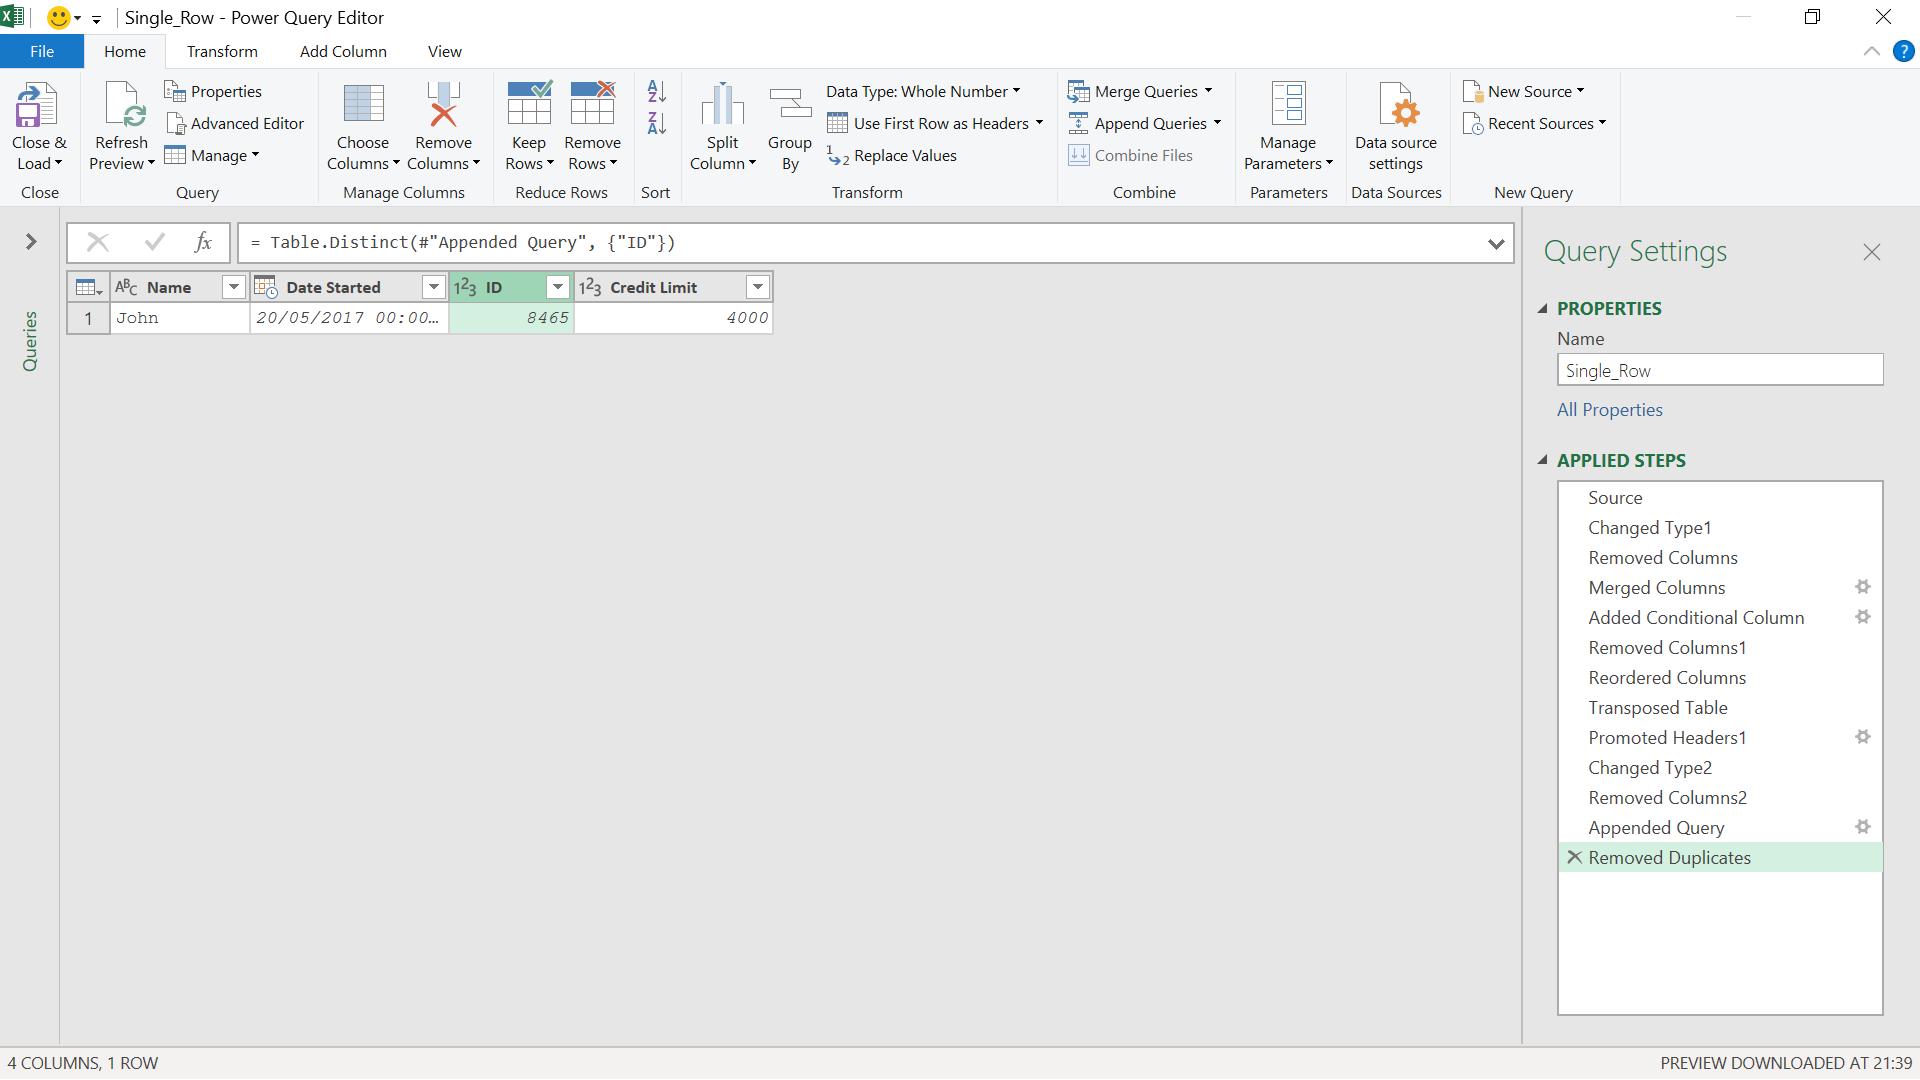
Now I am ready to enter more salespeople.
I enter Mary’s data, and now I refresh Single_Row.
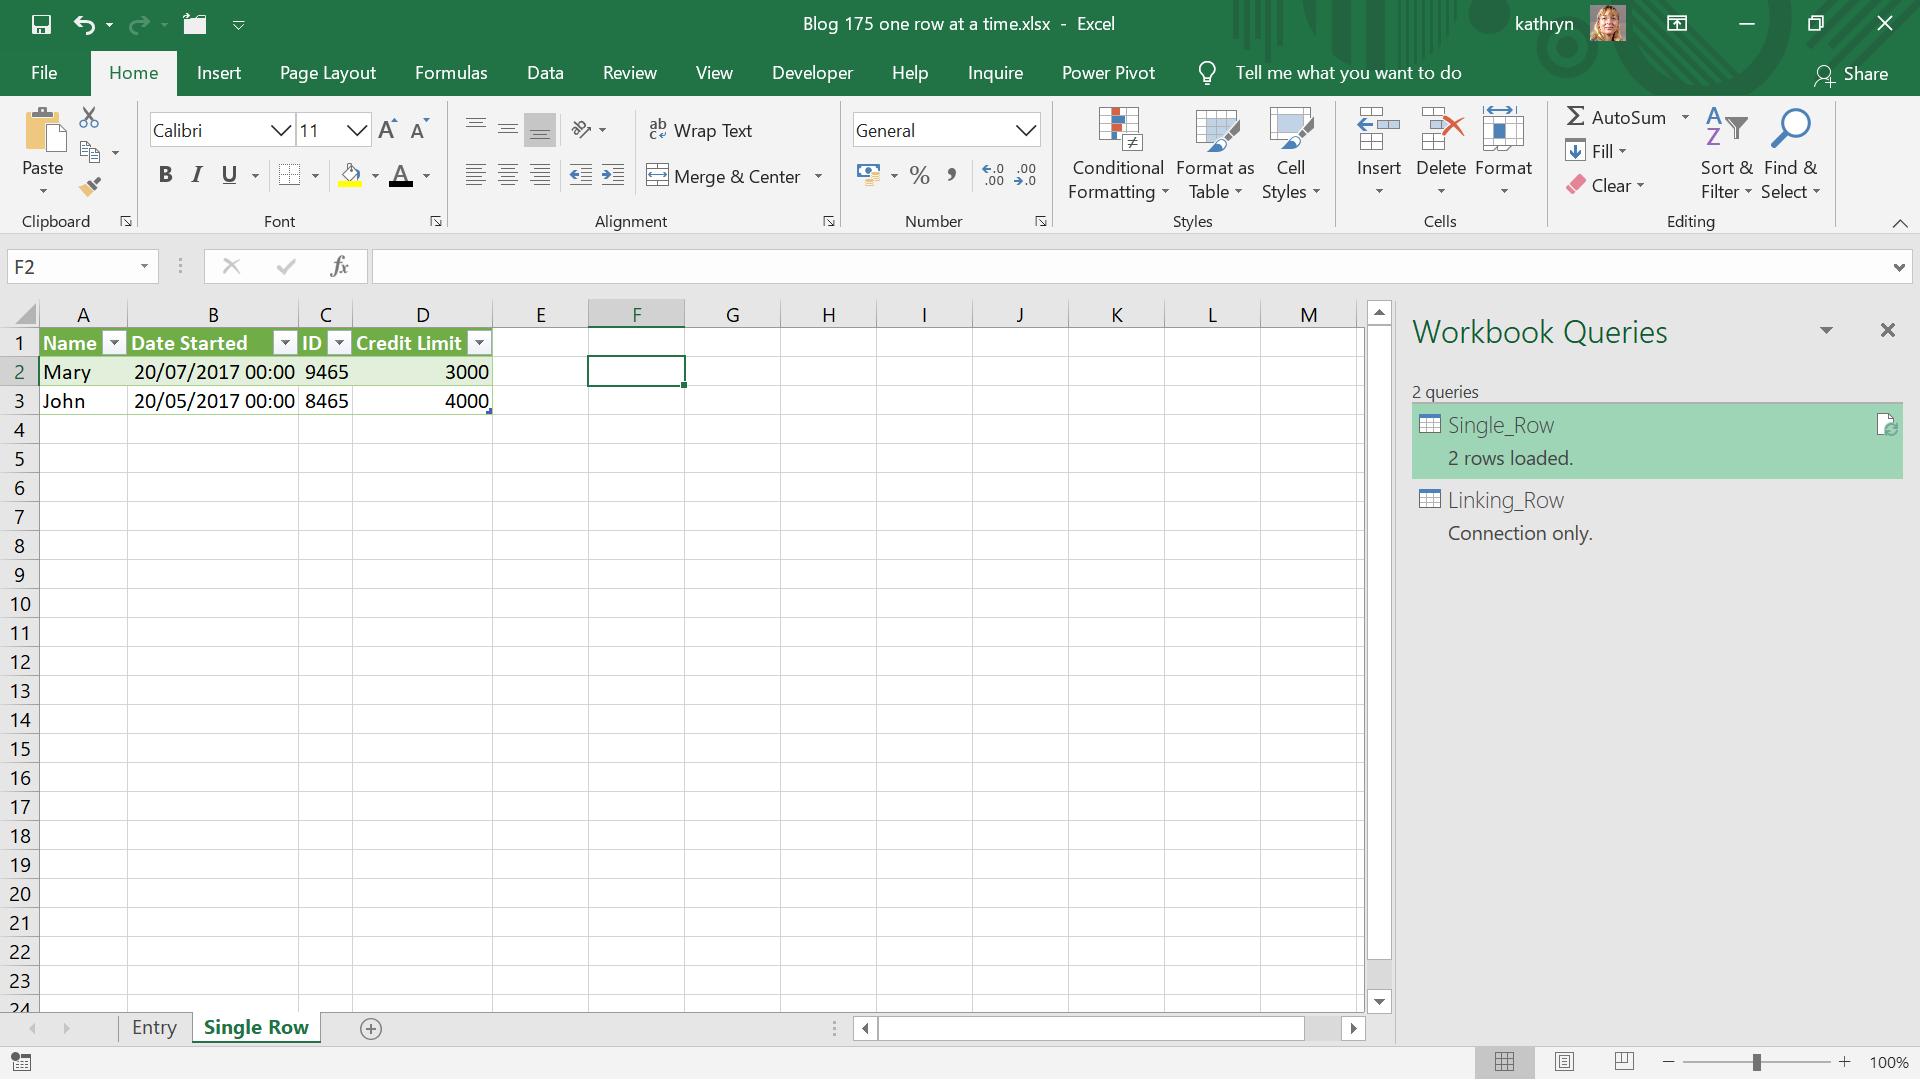
Mary’s data has been added. I can add another salesperson to check.
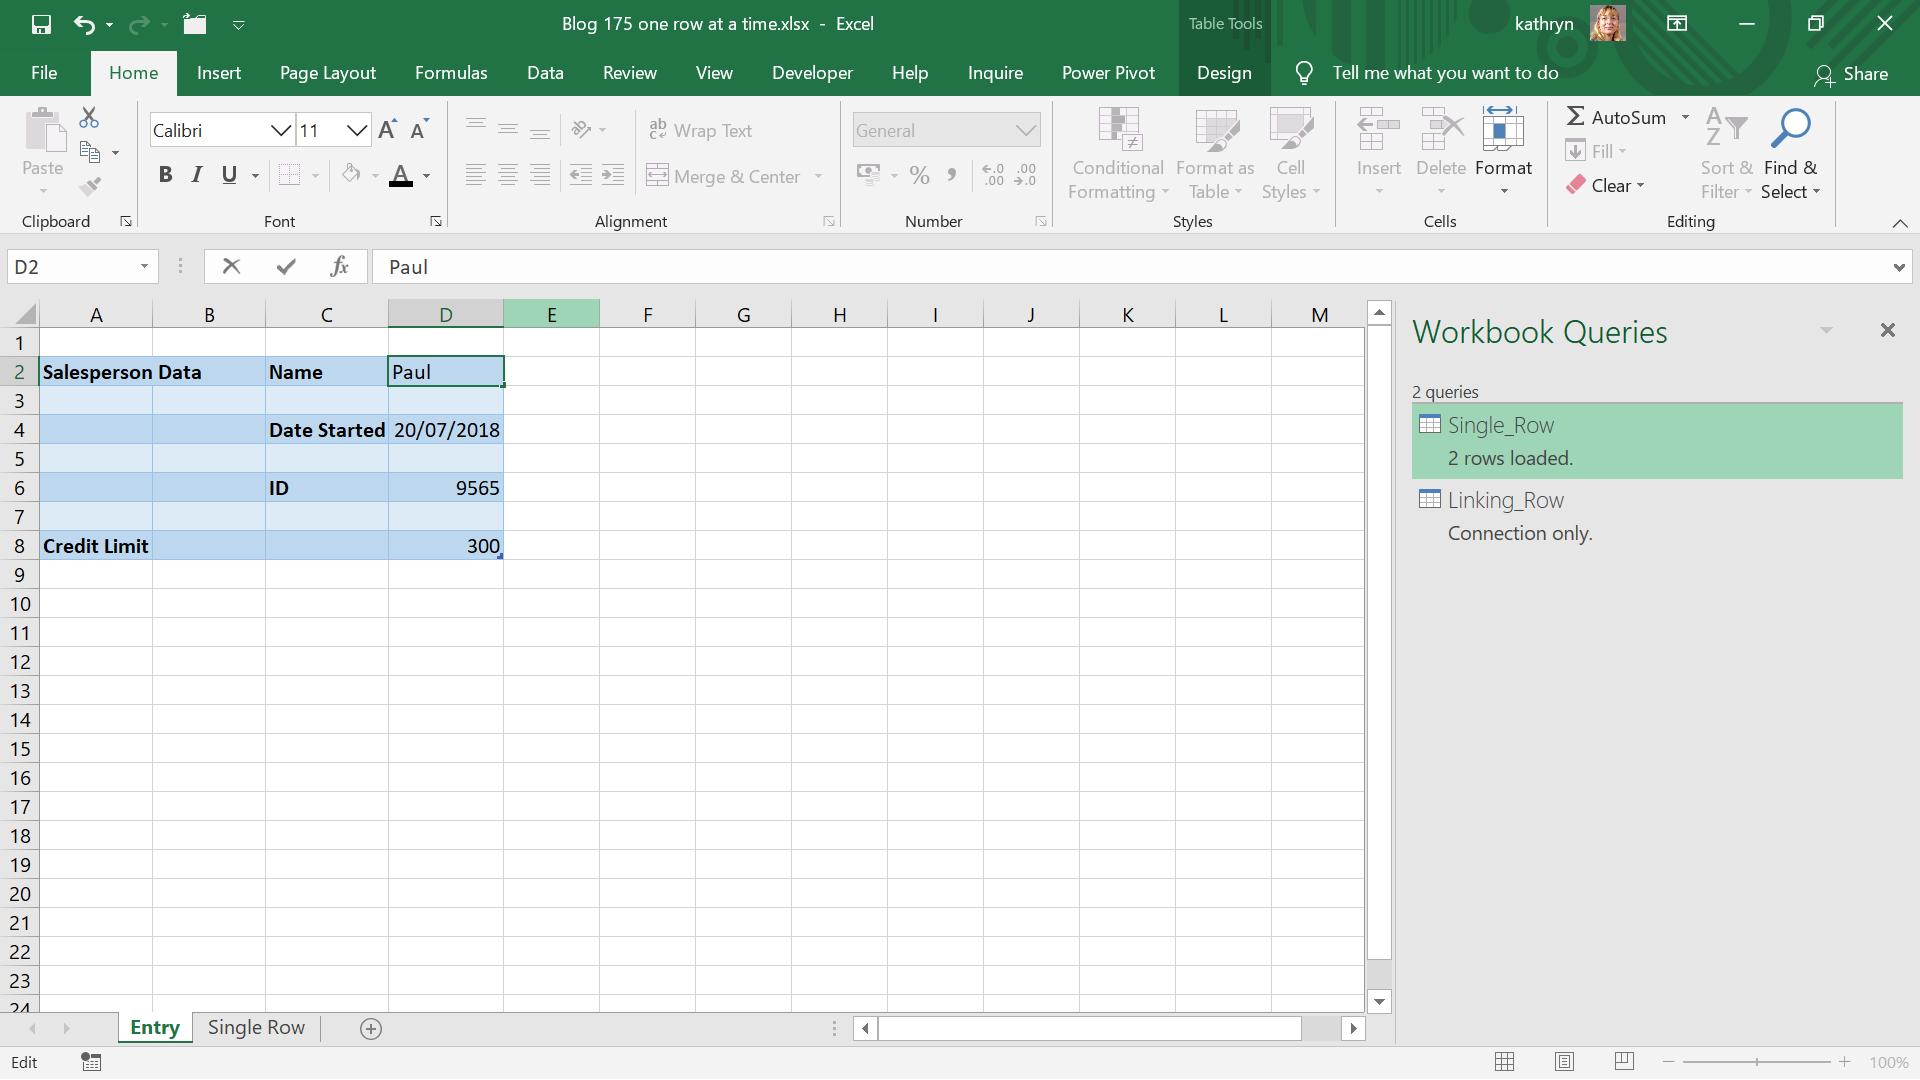
I update and refresh:
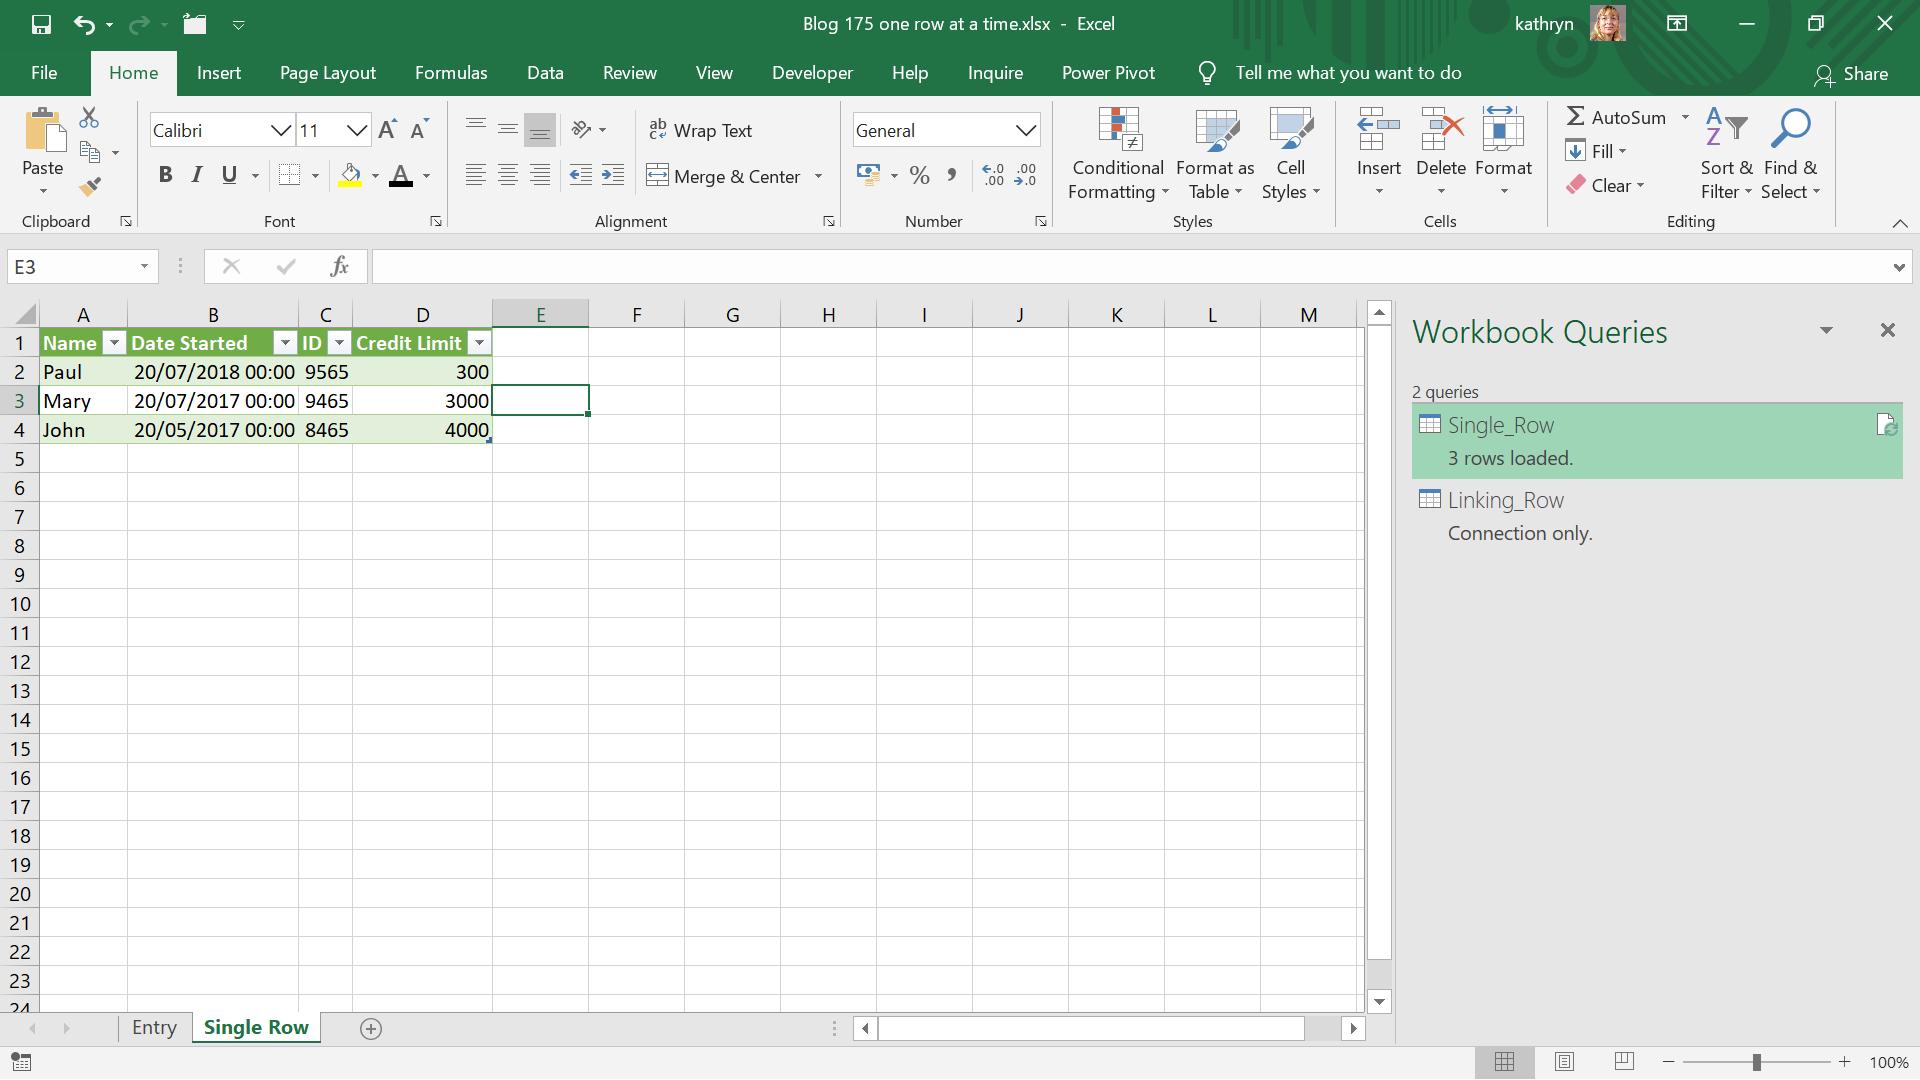
All my salespeople appear, and I can keep adding using the entry table I created.
Come back next time for more ways to use Power Query!