
Power Query: Splendid Splitting
23 May 2018
Welcome to our Power Query blog. This week, I look at splitting data using a variety of delimiters.
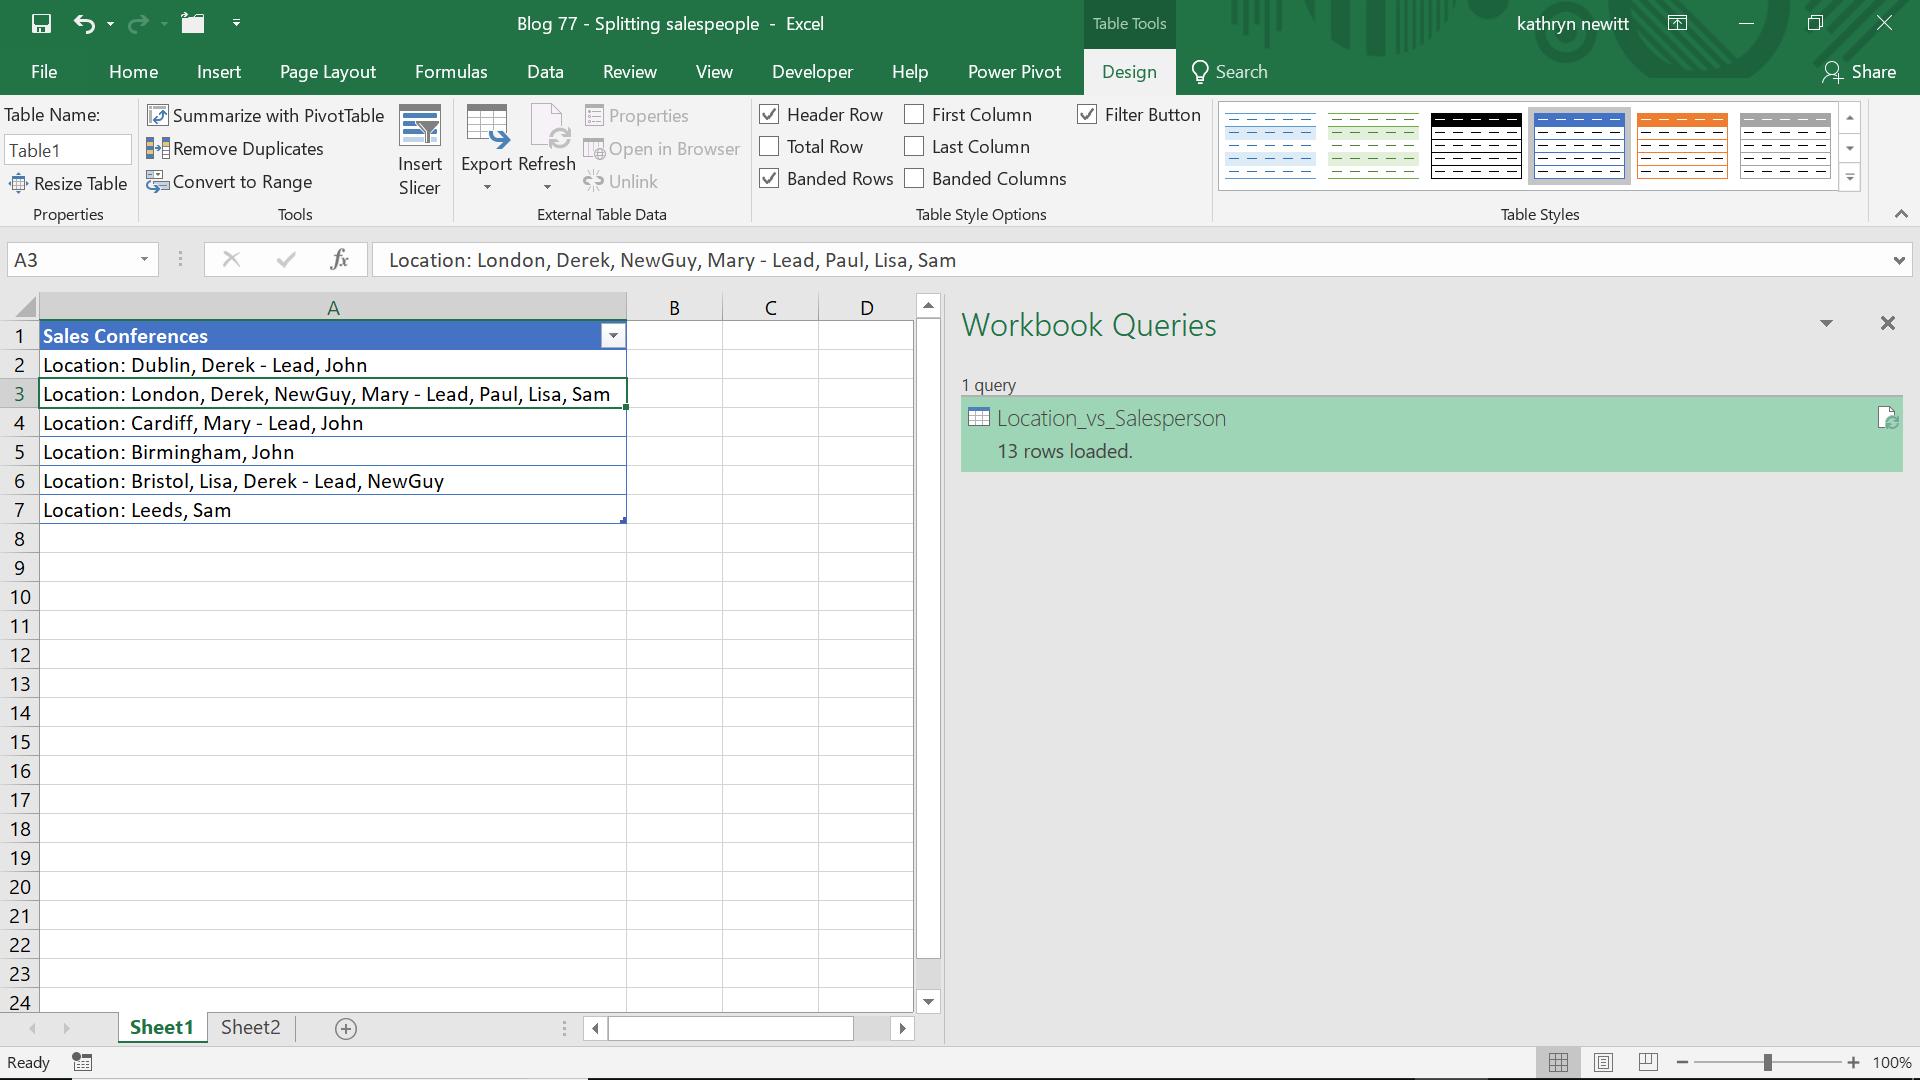
I have some data for my ever-reliable fictional salespeople. As usual, the data is not in a format I would like!
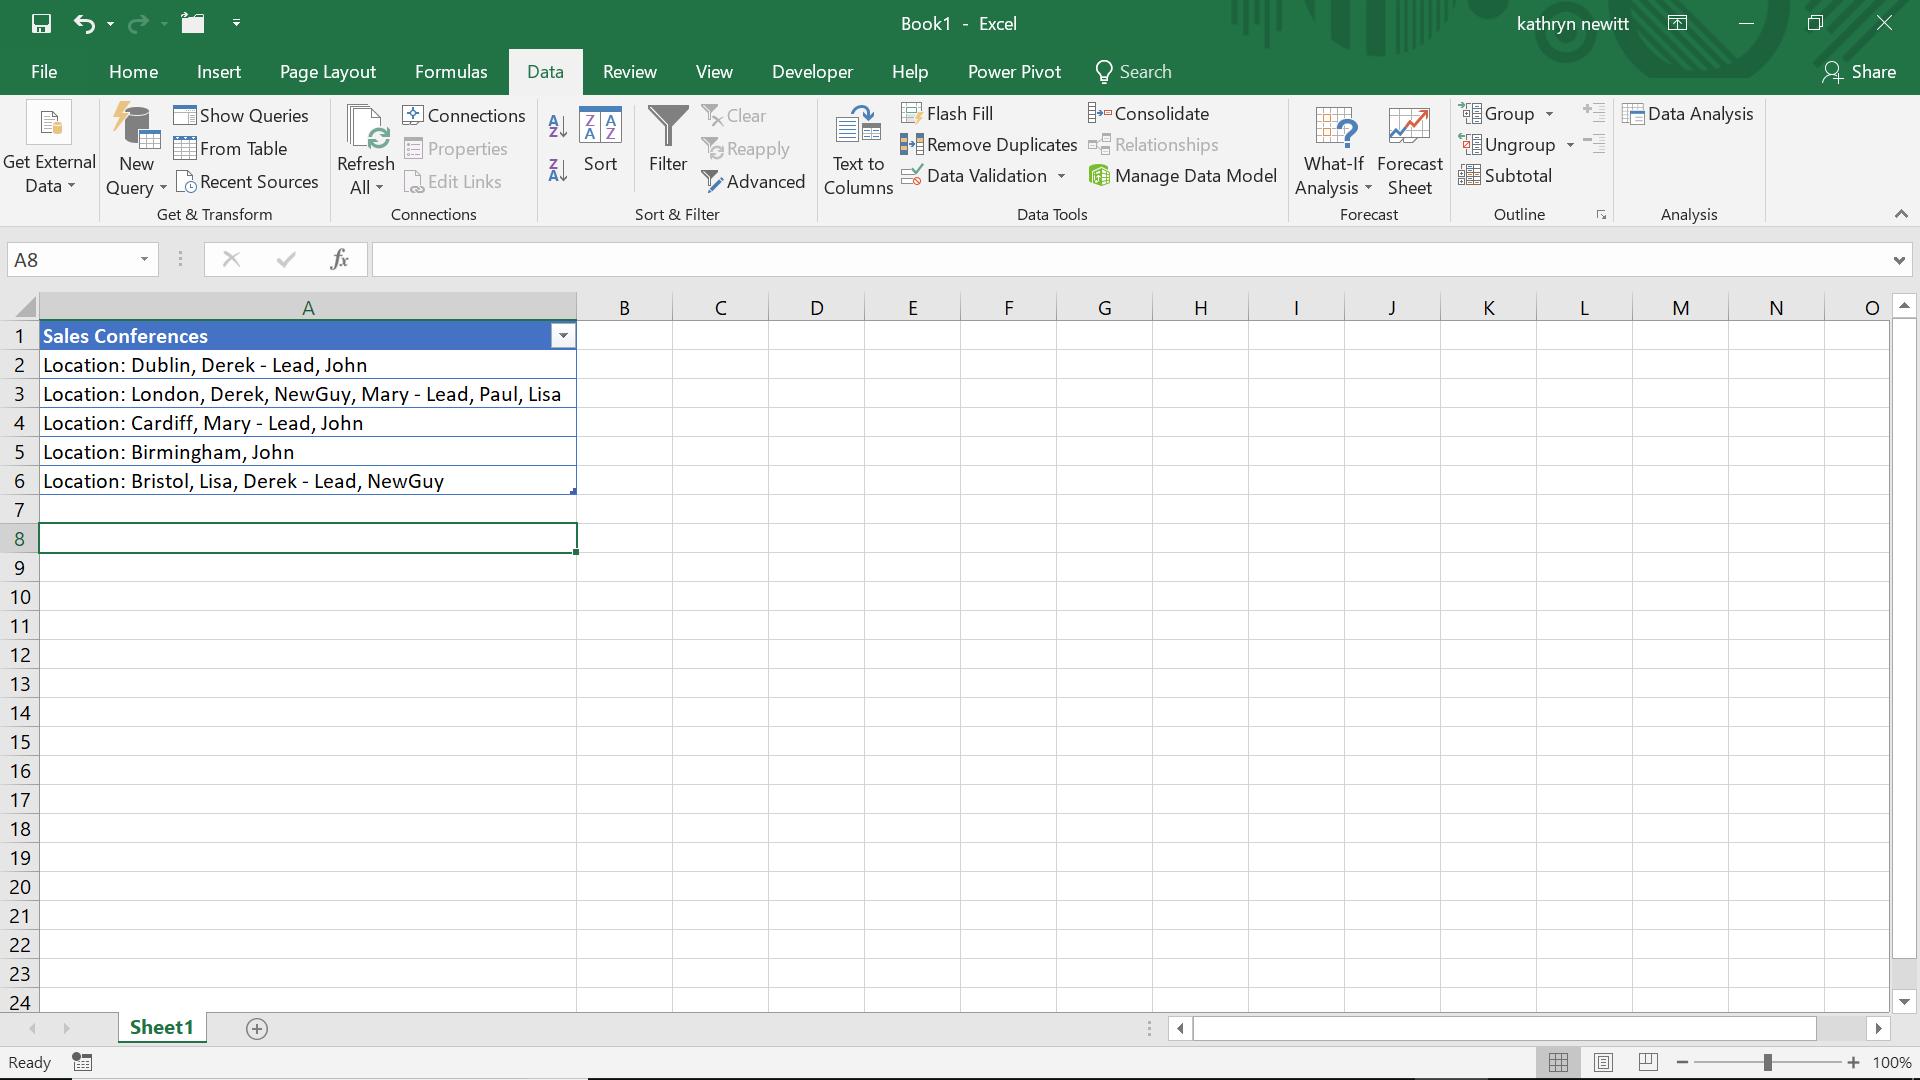
Basically, I have a list of which salespeople are attending sales conferences and who is in charge at each one. Naturally, I’d like to put this data into a more useful table. What I would prefer is a list of pairings. I need to make sure I have a way of identifying which data is my sales conference location, which I why I have put ‘Location:’ before each city. I start by creating a query ‘From Table’ in the ‘Get and Transform’ section on the ‘Data’ tab.
I want to convert this data into a list of pairings, and the best way for me to do this is to tell Power Query what the delimiter is. However, I don’t want to actually split the column up at this point, so I won’t be using the ‘Split Column’ on the UI (user interface). Instead, I will be using some M code. The function I am using is
Table.TransformColumns(table as table, transformOperations as list, optional defaultTransformation as nullable function, optional missingField as nullable number) as table
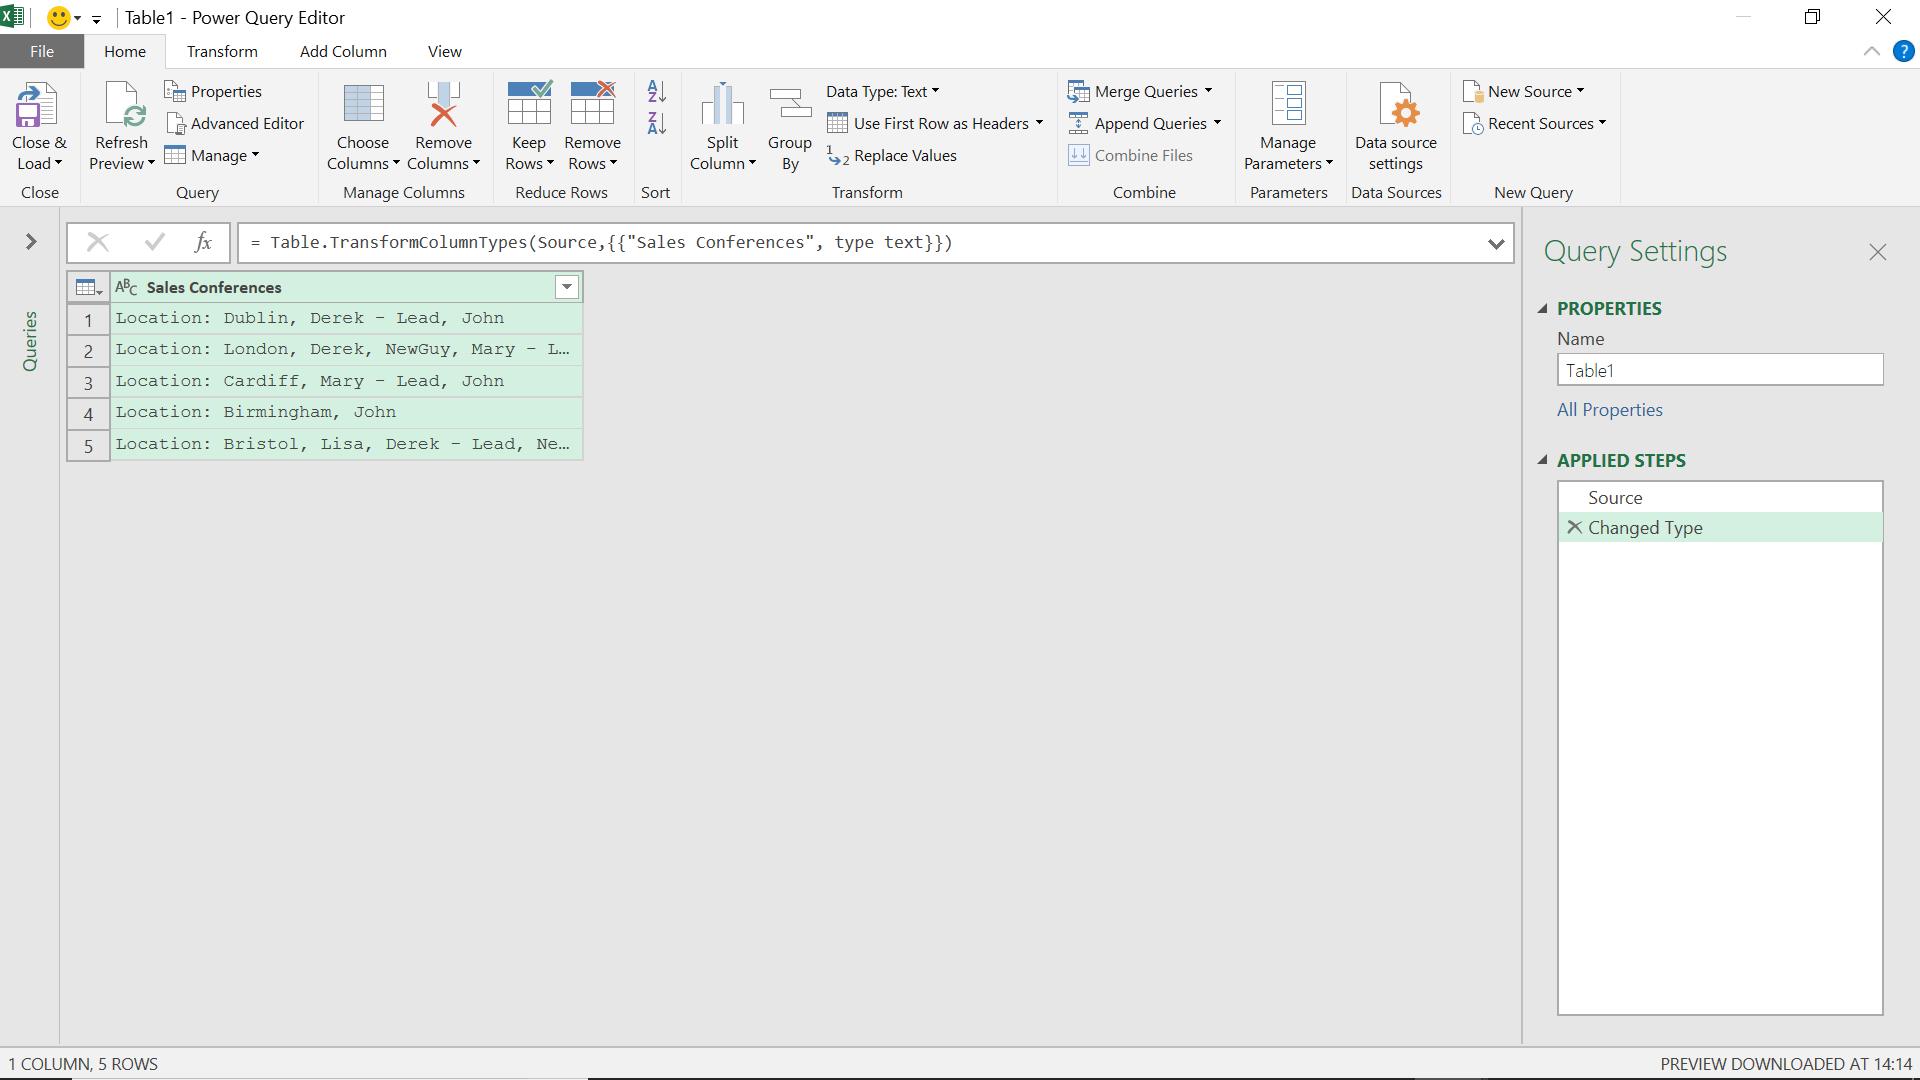
I have a similar step already created for me to change the type (shown on the previous screenshot), so I can work out what my function needs to be.
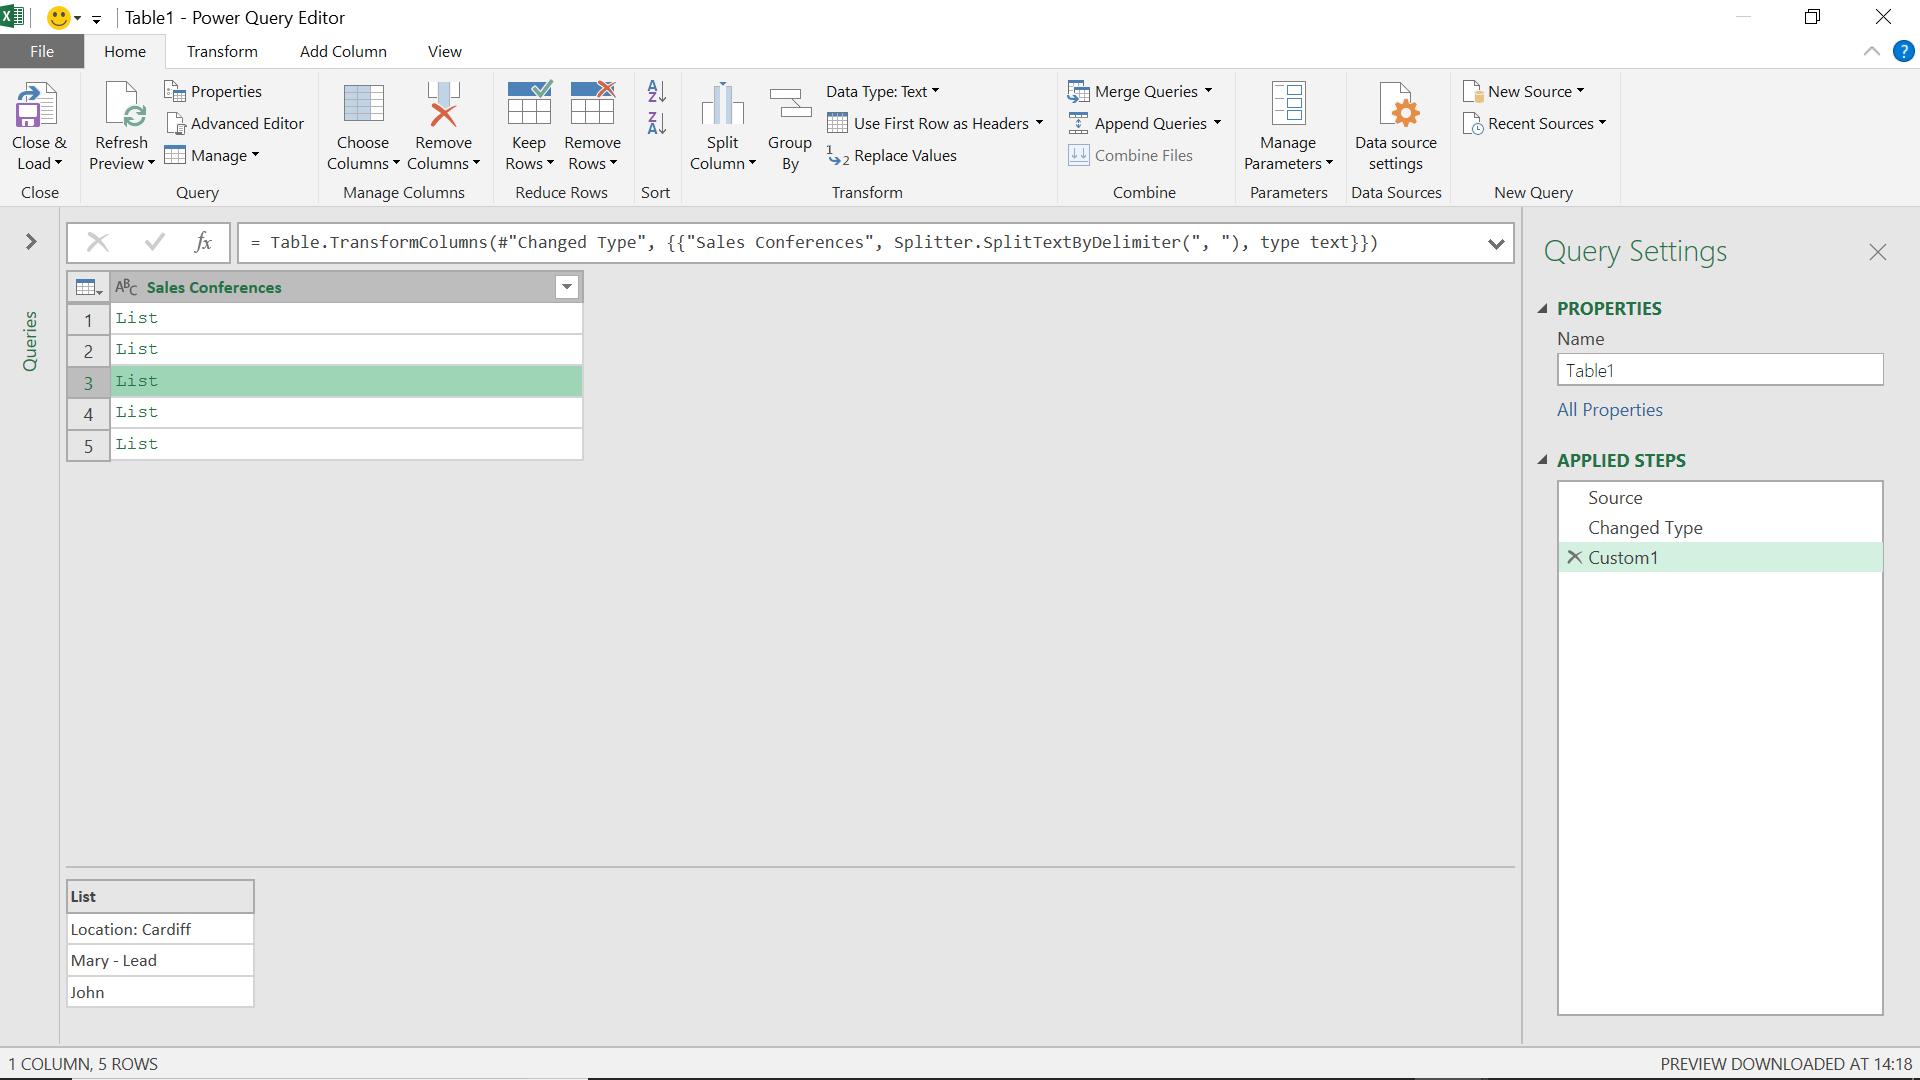
= Table.TransformColumns(#”Changed Type”, {{"Sales Conferences", Splitter.SplitTextBy Delimiter(“, “), type text}})
This converts each of my column entries into a list as shown below:
Now I need to extend this so that I have a long list, with all my lists contained within. In order to do this, I convert my table to a list in the ‘Transform’ tab.
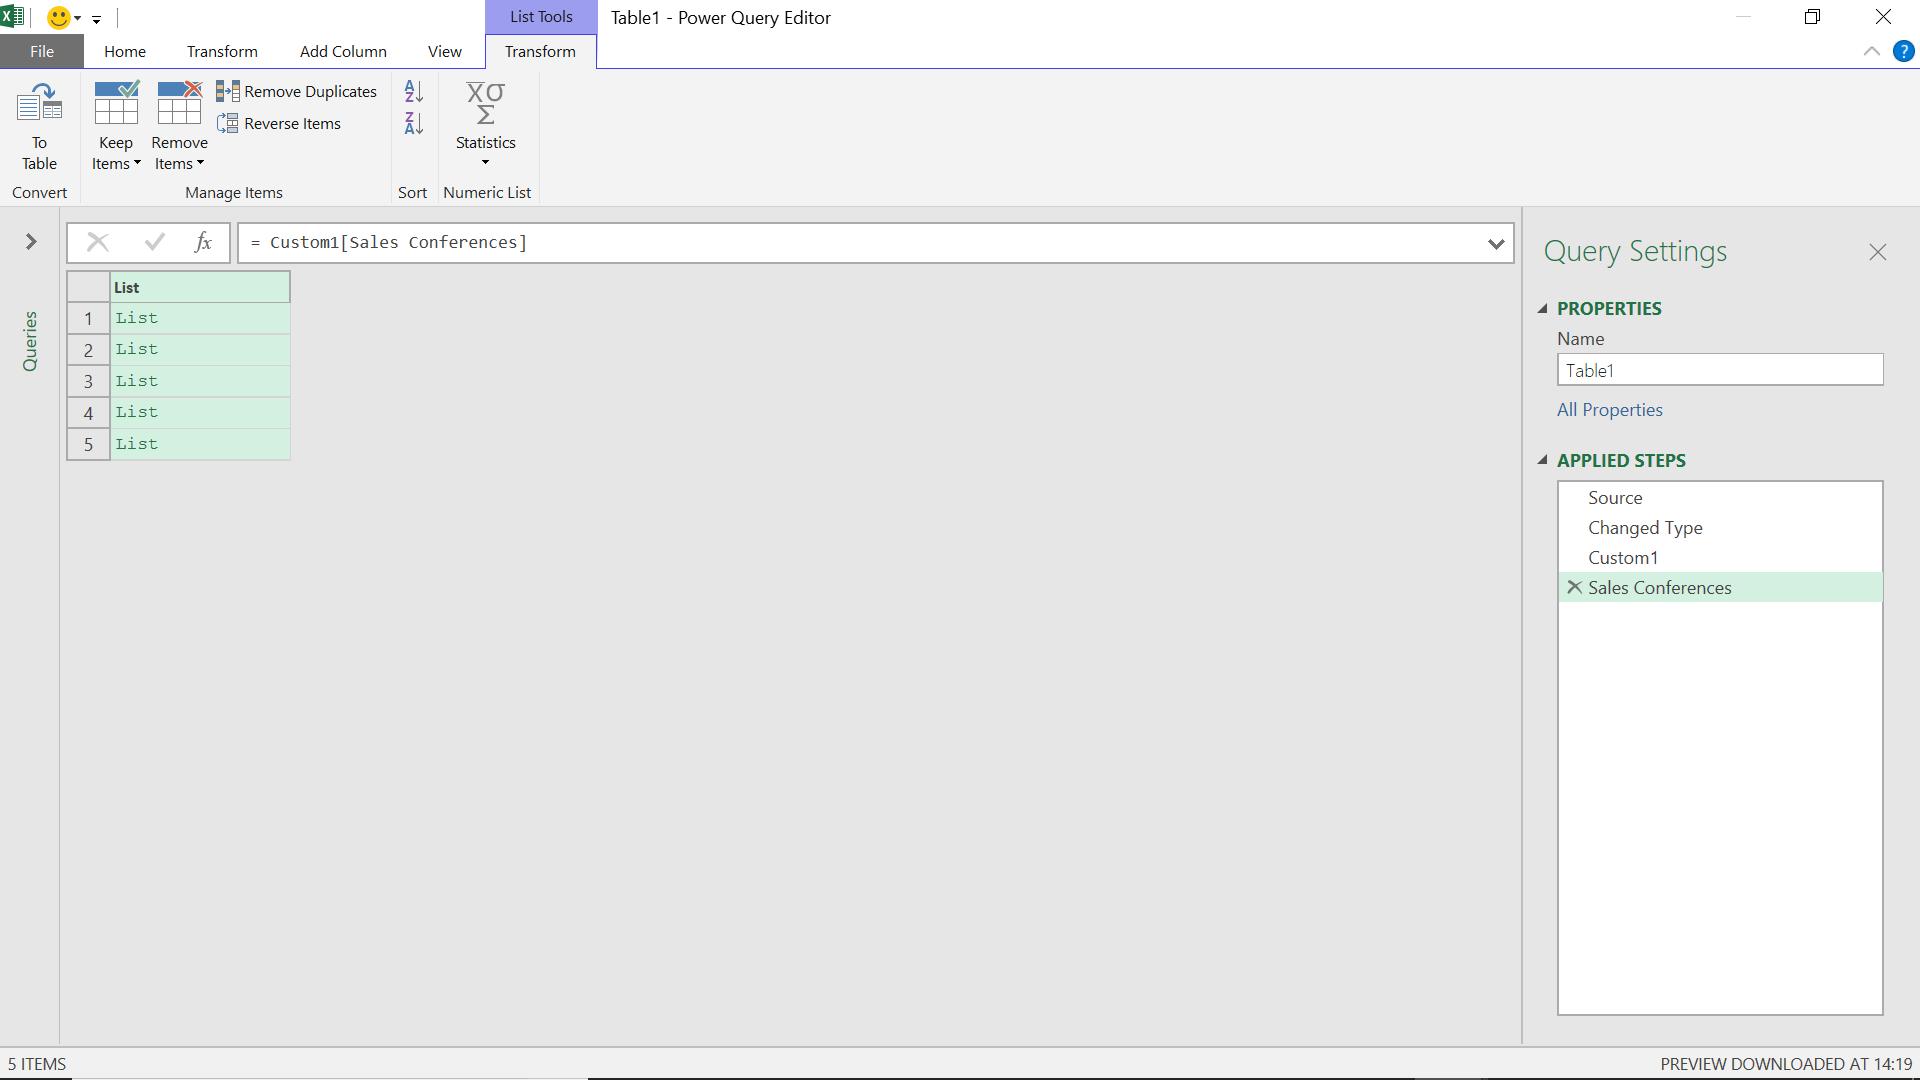
My data is now a list of lists, and I need to convert it back to a table so that I can have one long list. This is made possible by the ability to expand the data, as I will show shortly.
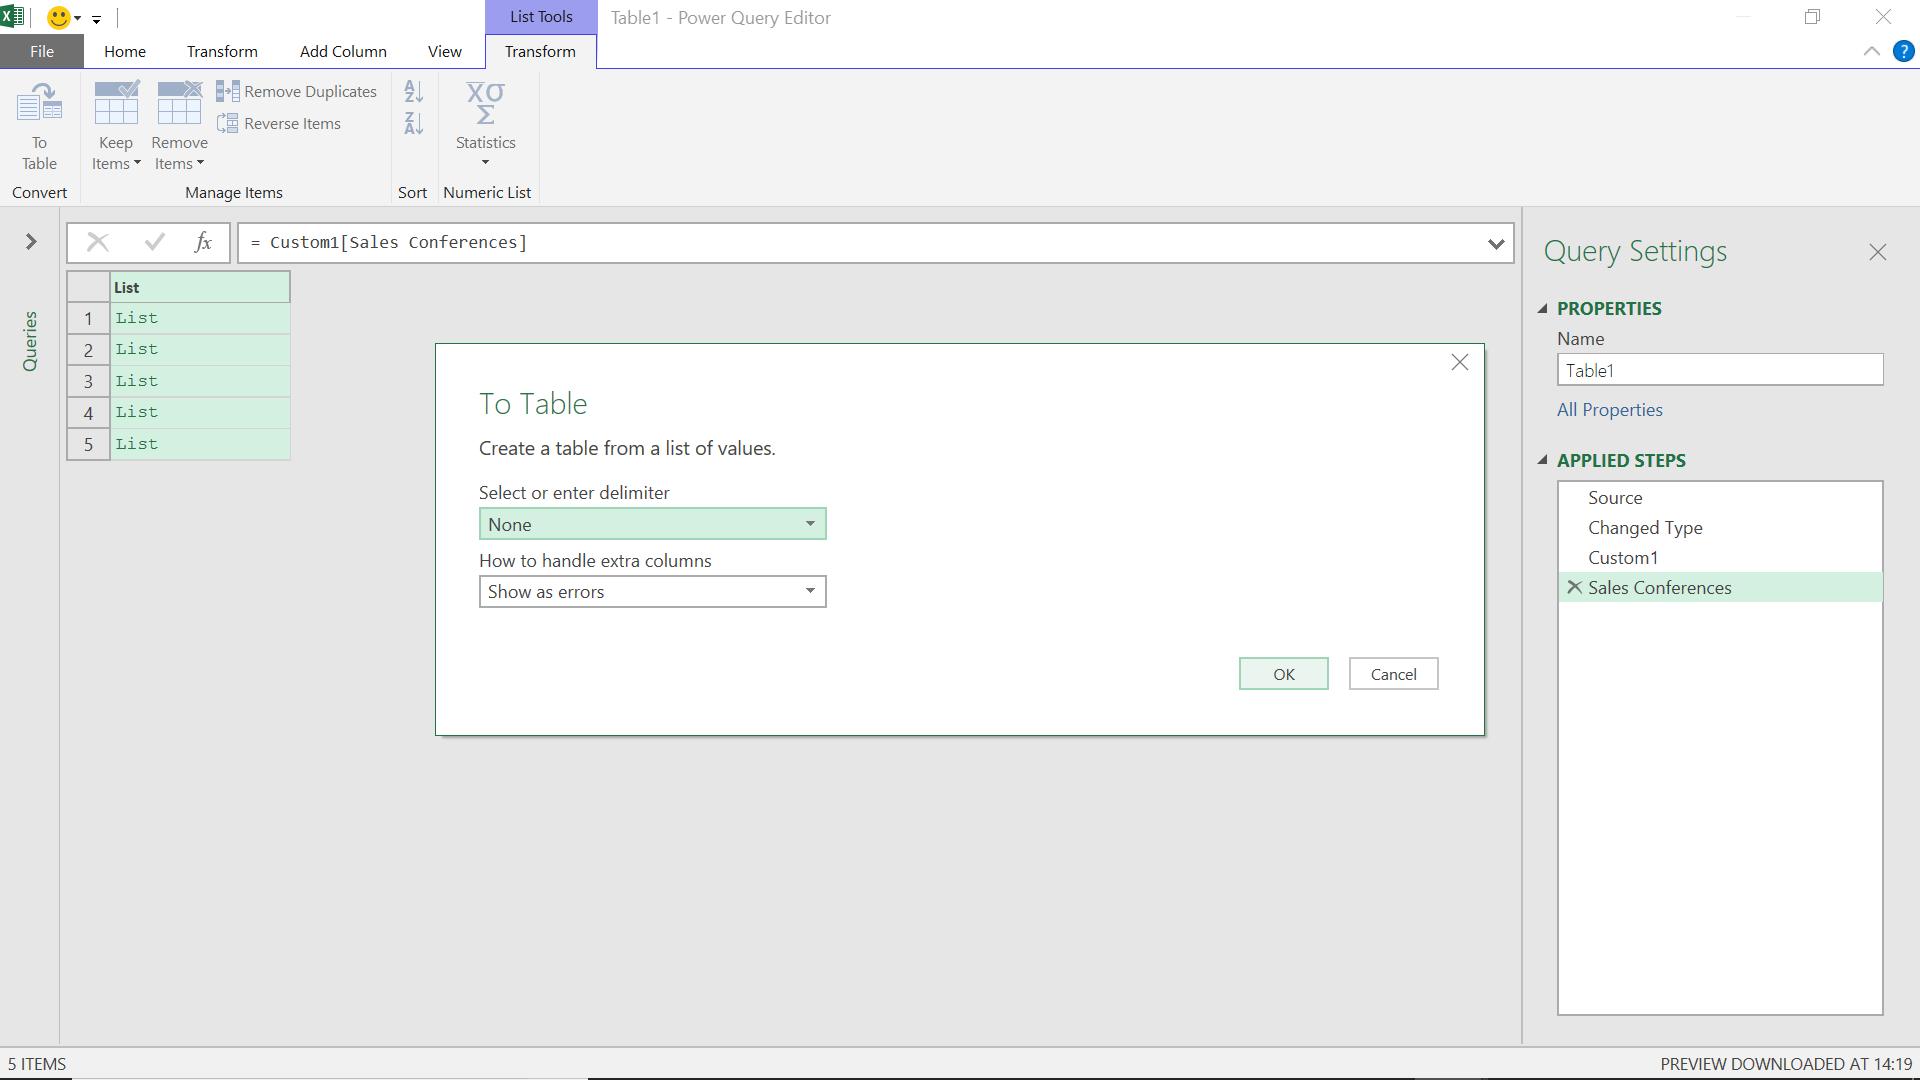
I don’t need a delimiter for this part, so I take the defaults.
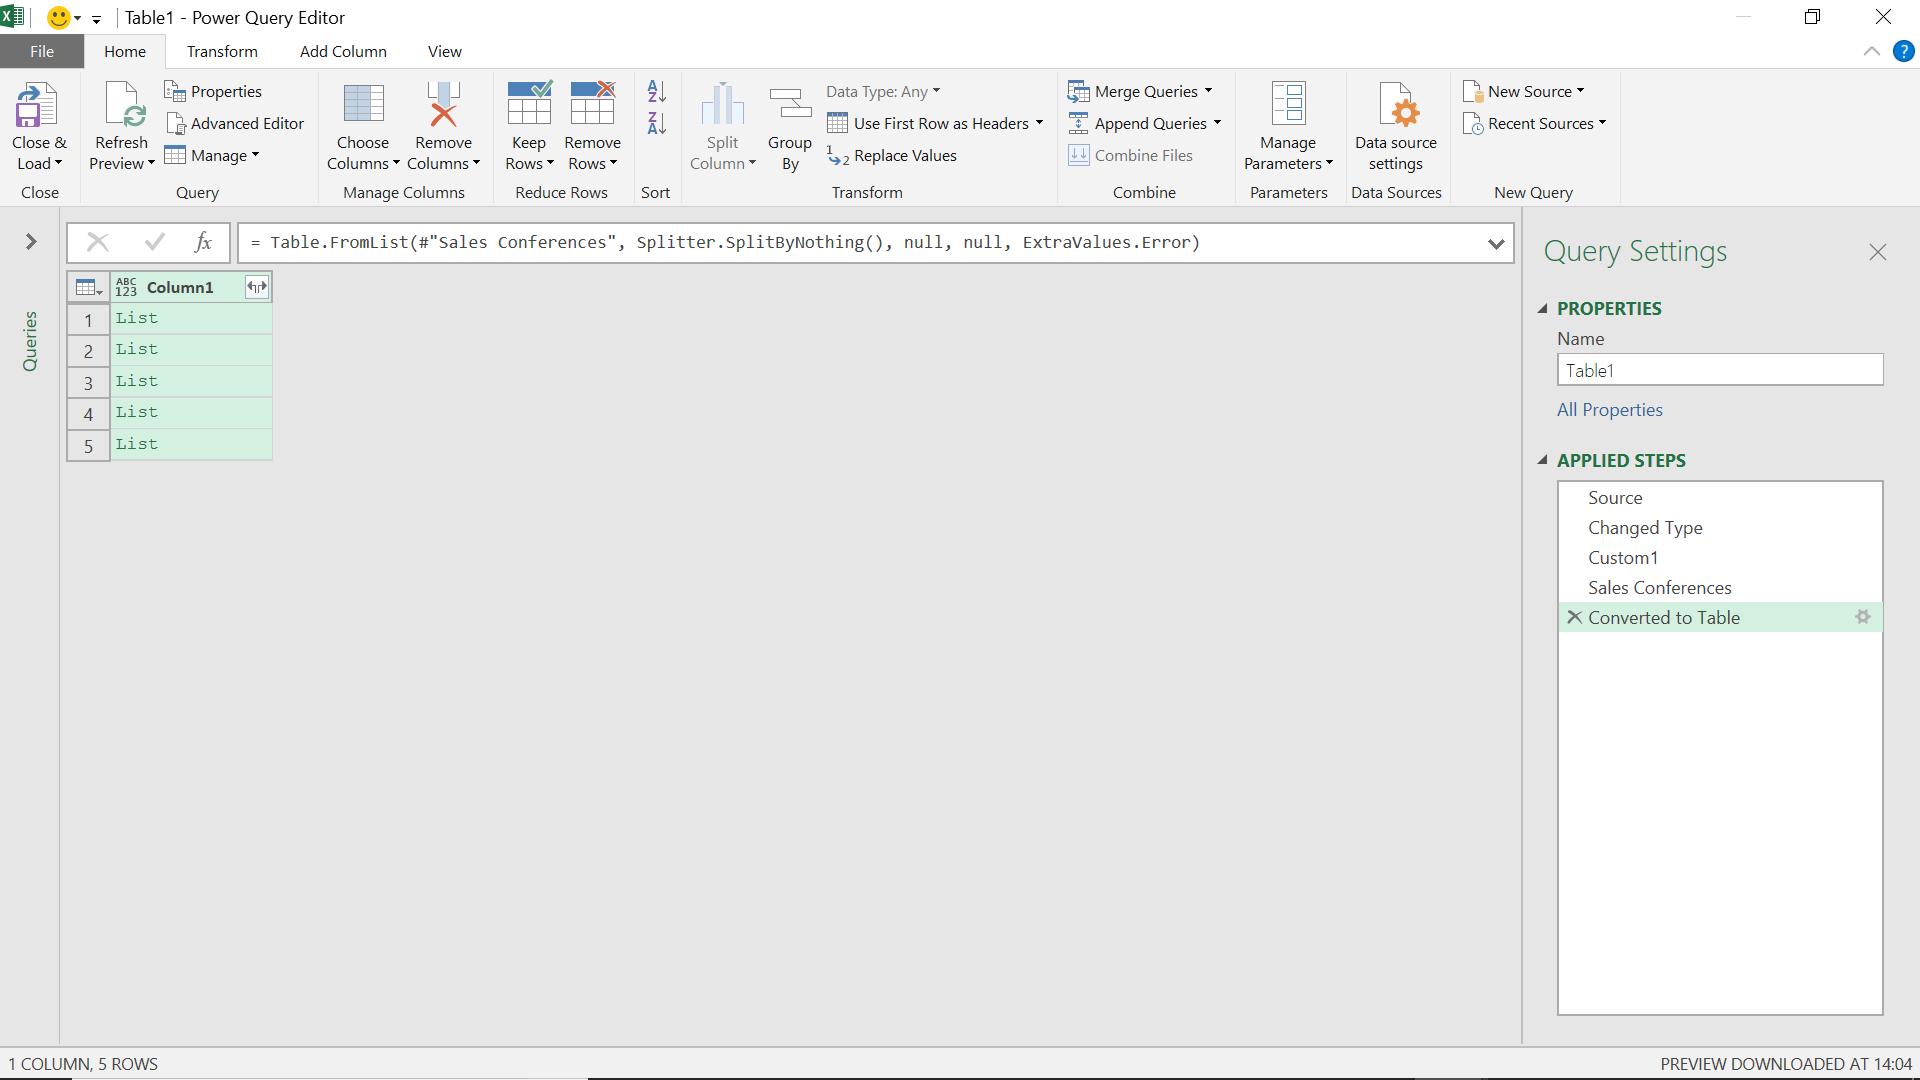
Now I have my table again, but I have the option to expand my columns, allowing me to view my separated data in one long column.
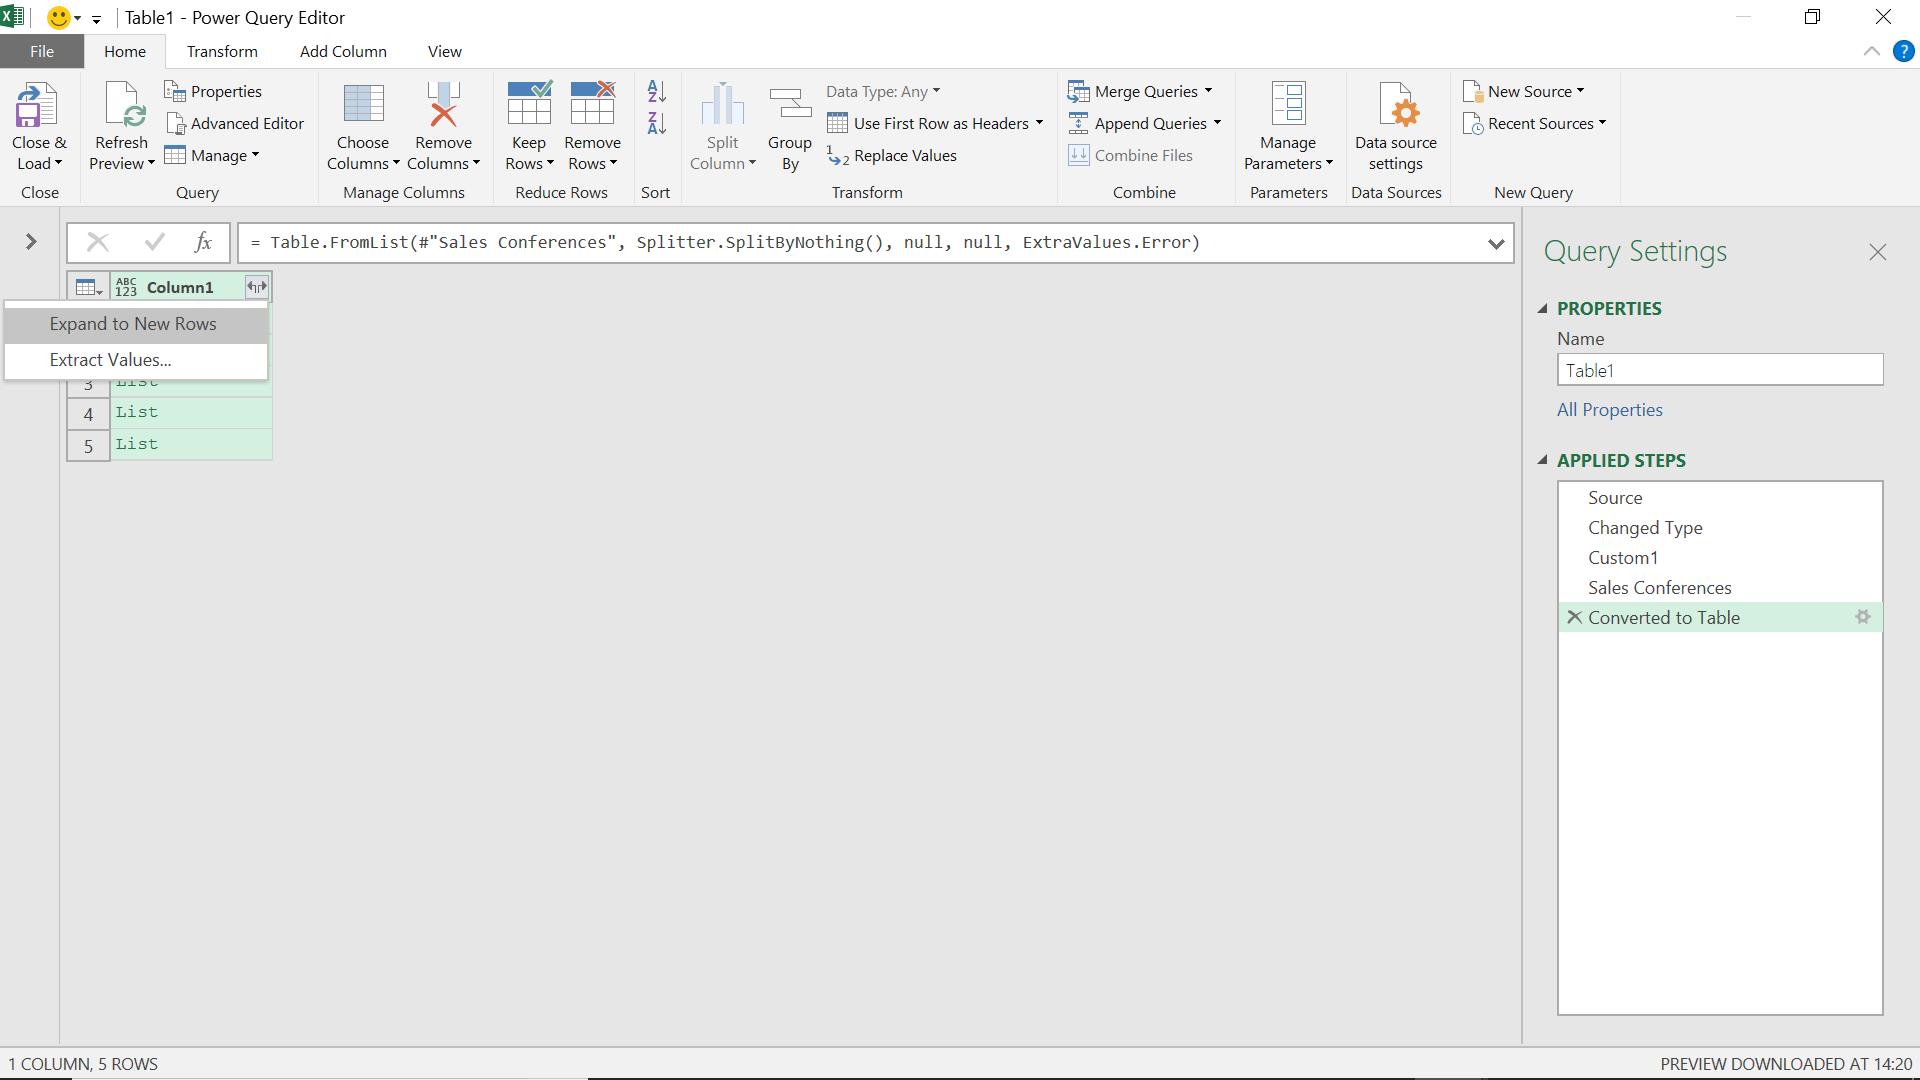
Once I ‘Expand to New Rows’ I can see all of my data.
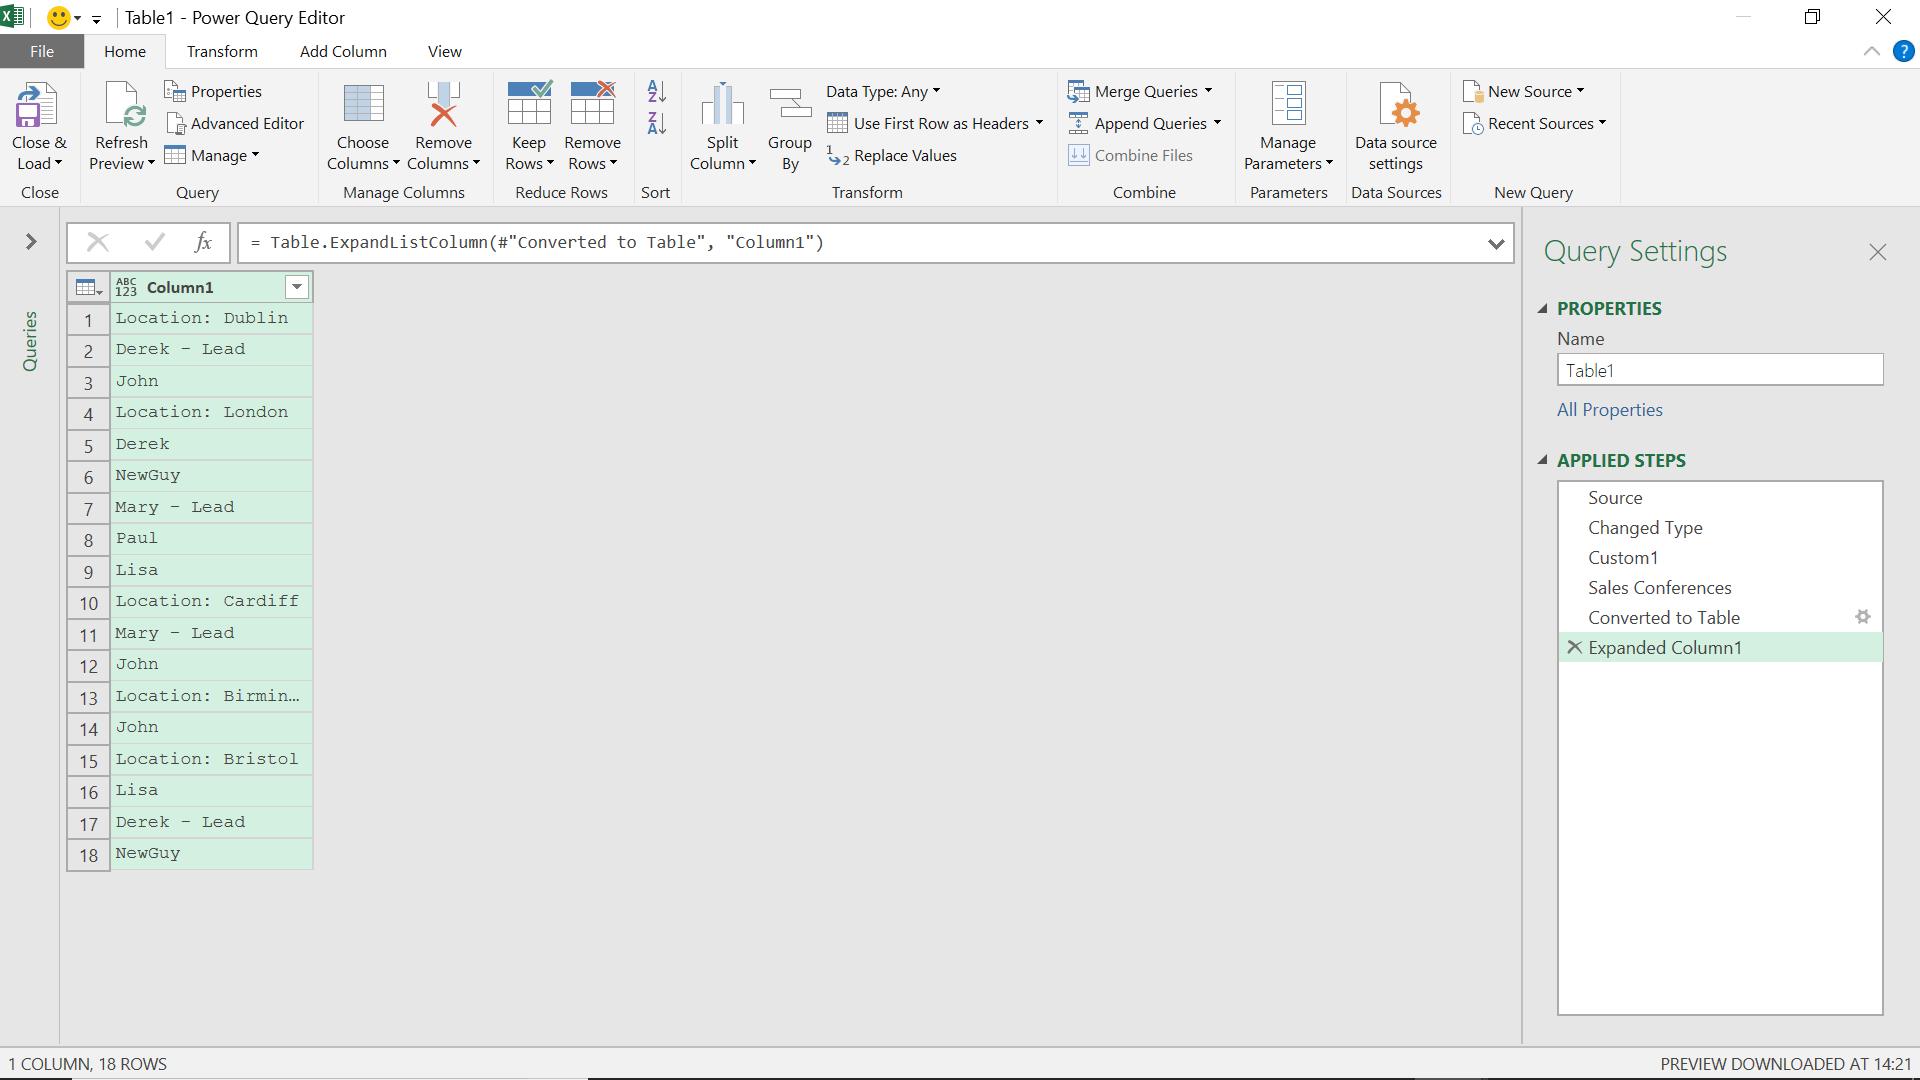
I need to pull out the sales conference locations and to do this I create a ‘Conditional Column’ from the ‘Add Column’ tab.
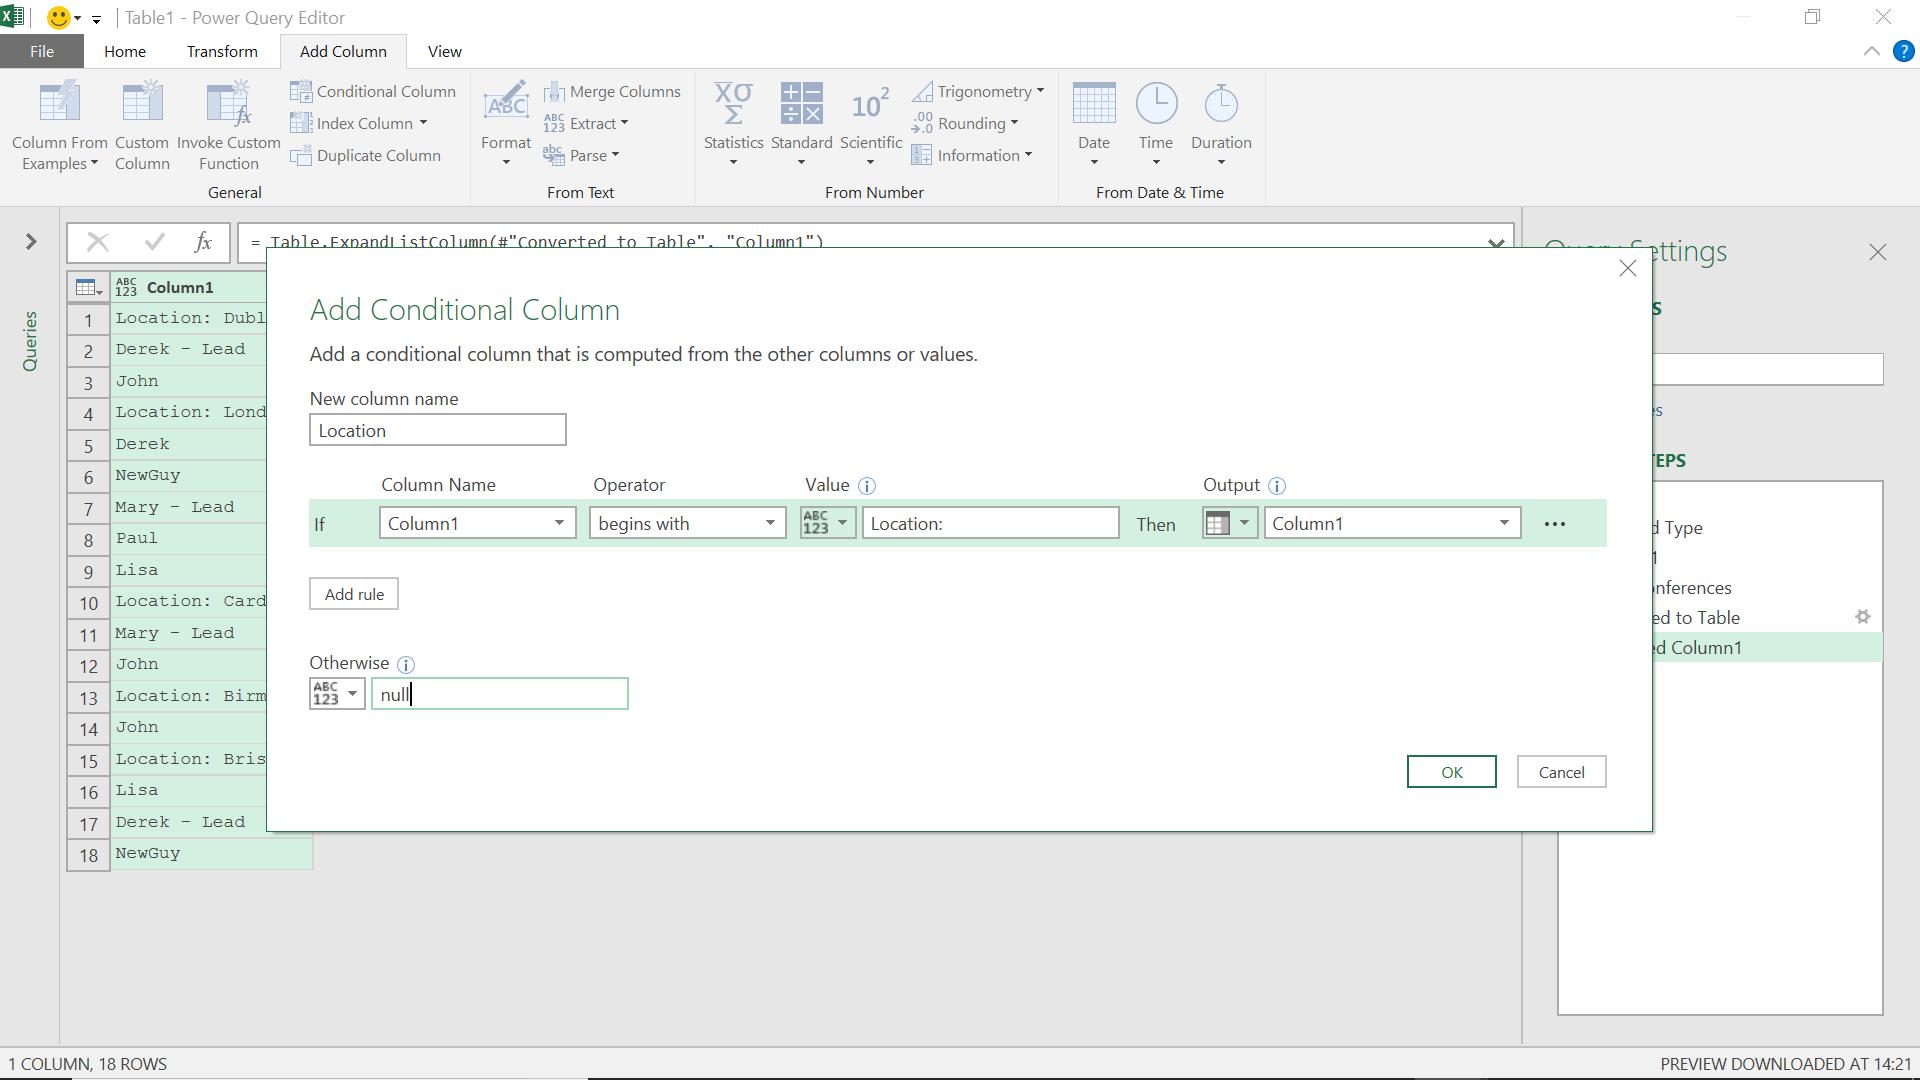
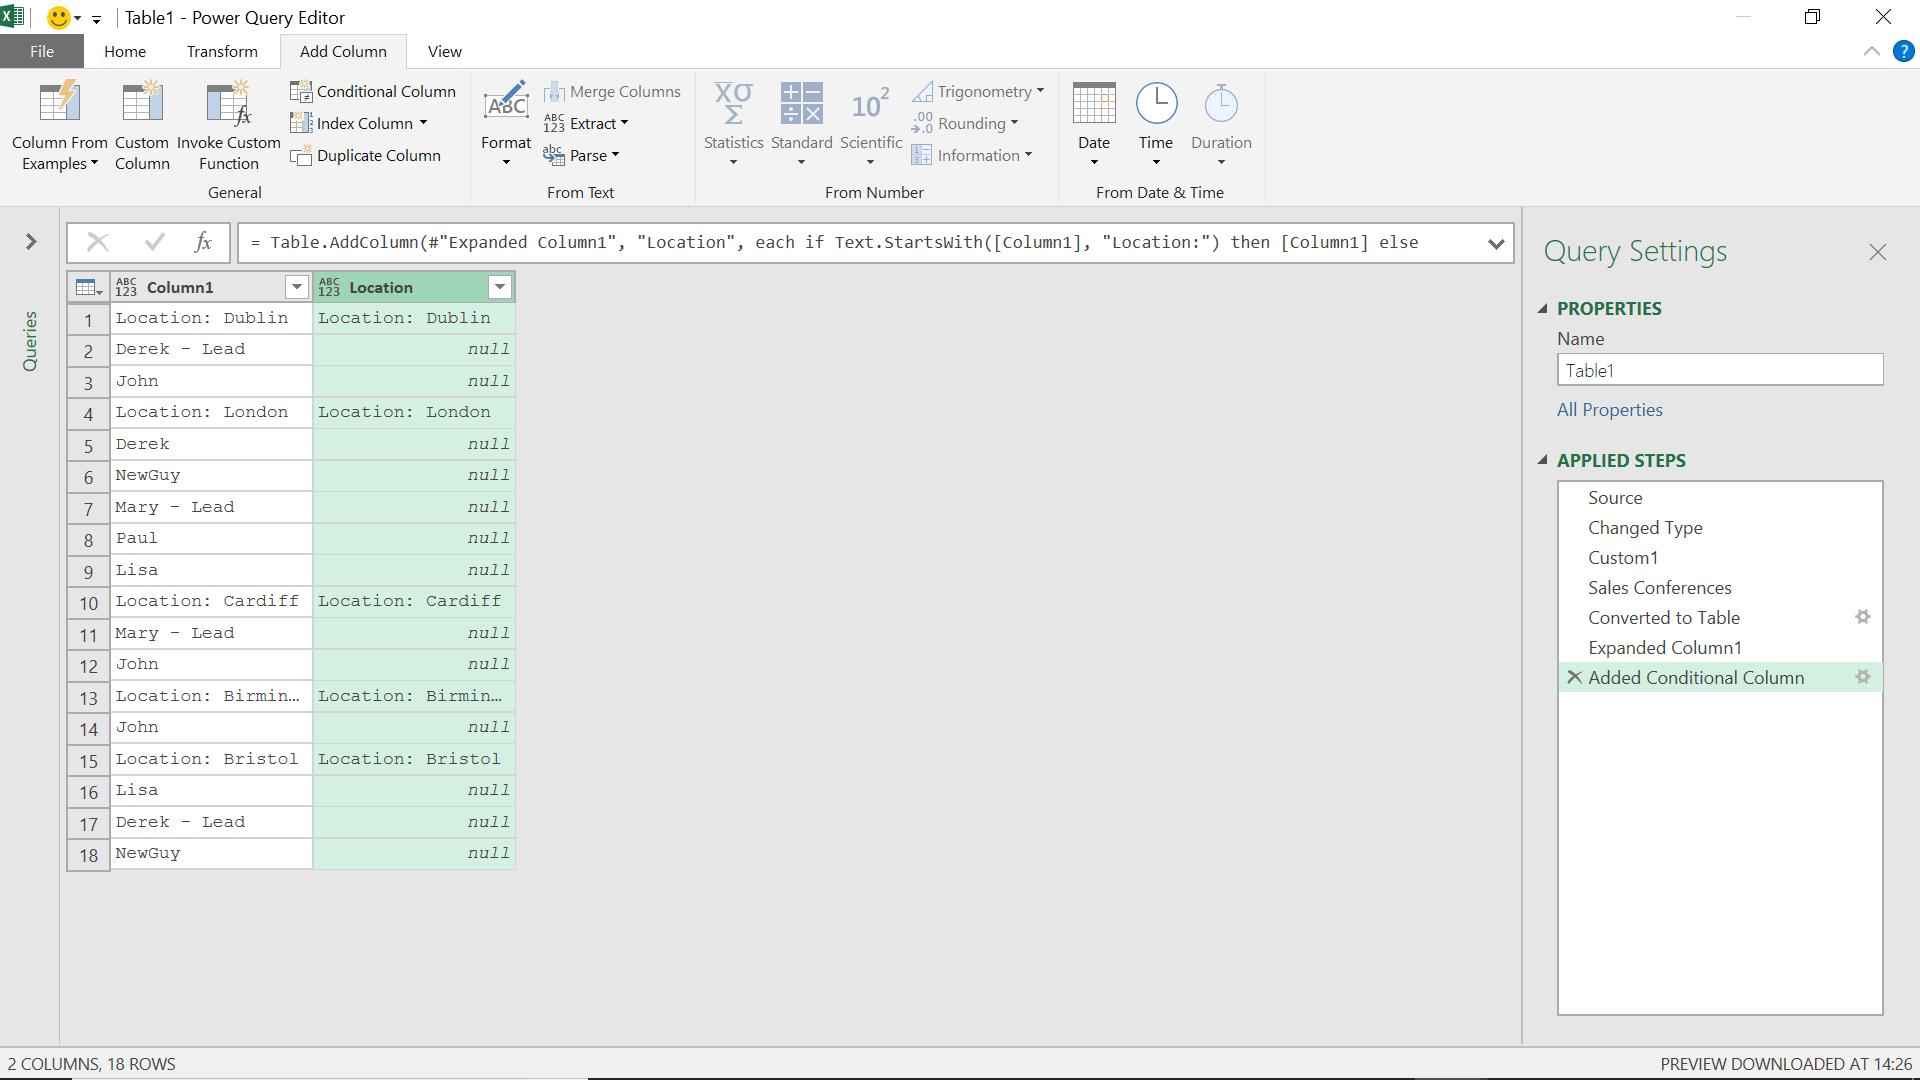
This new column will be populated with my location if the text contains ‘Location:’
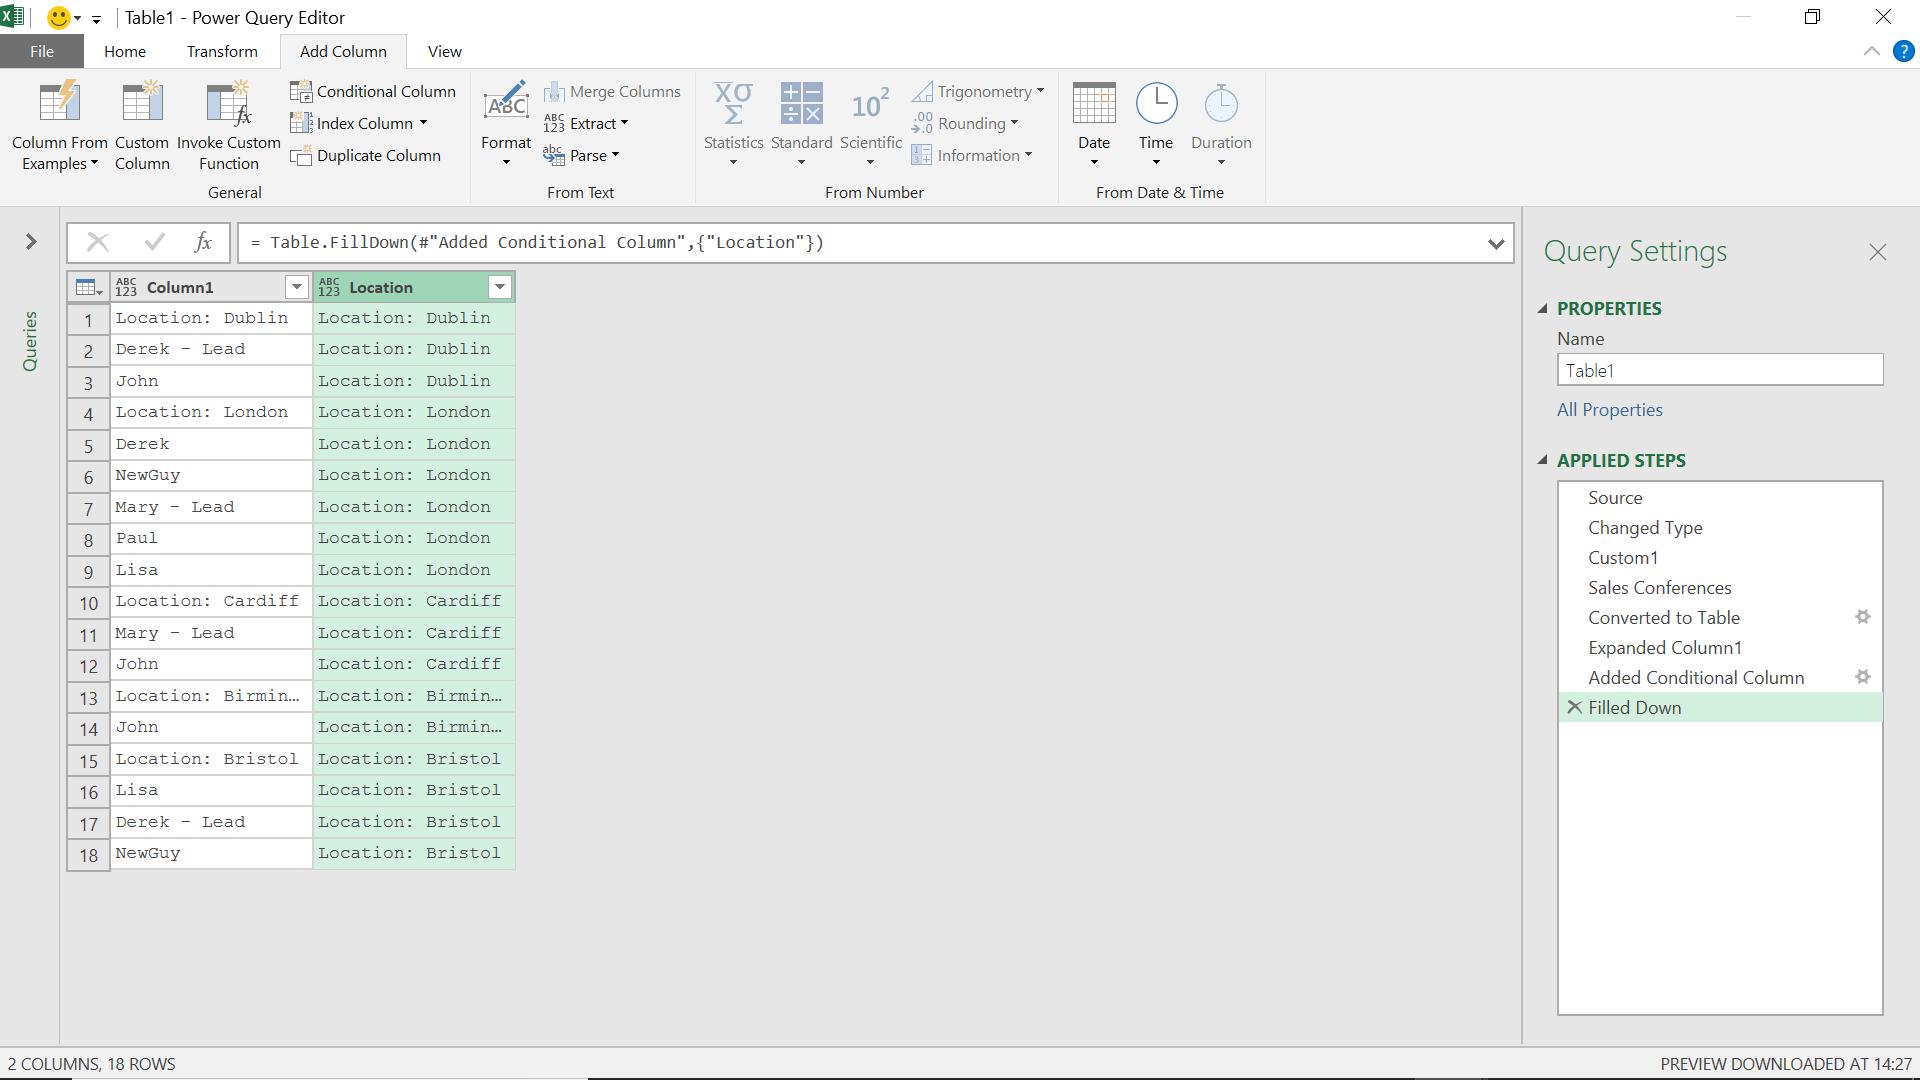
I can right click on my new column and ‘Fill Down’.
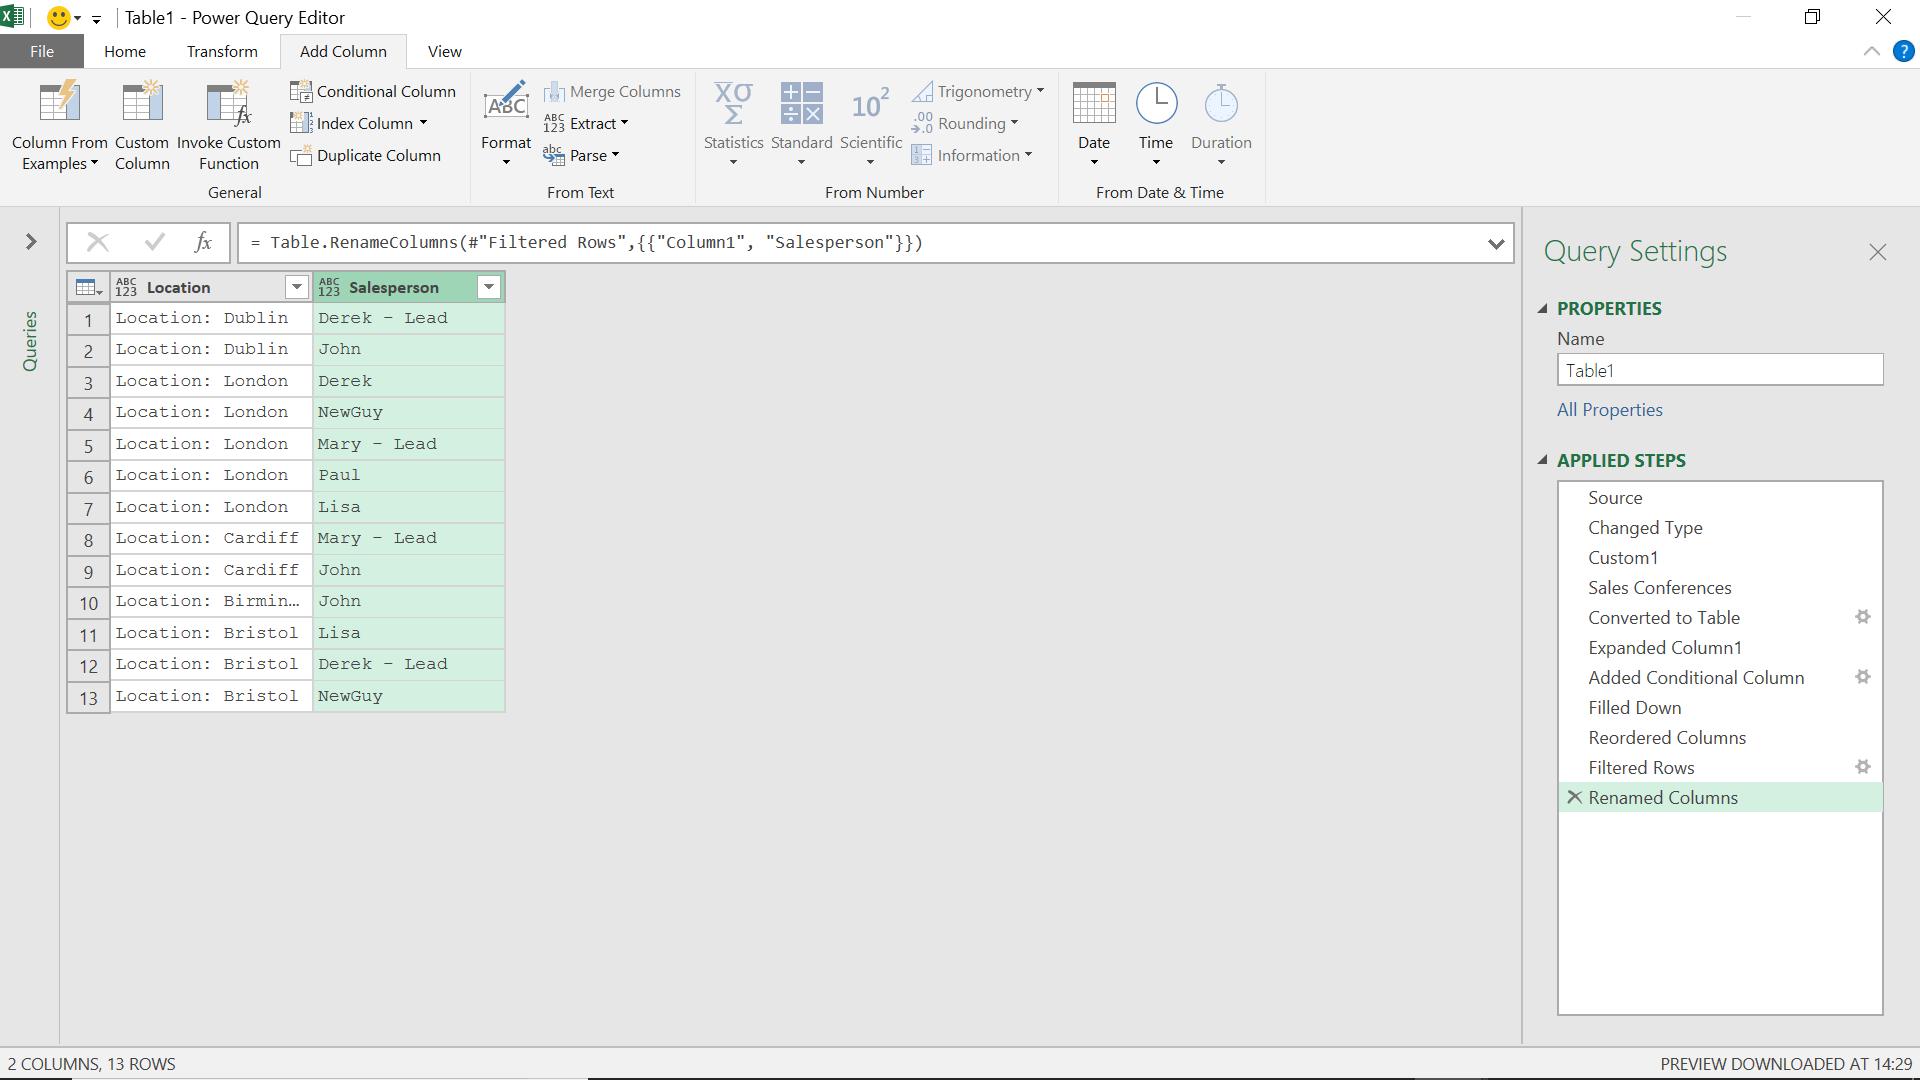
This is starting to look like my goal. Now I may swap my columns around and remove anything where Column1 contains ‘Location:’. I then rename Column1.
I decide that the ‘Location:’ has been useful to identify the cities, but now it has to go! I split the column by delimiter (right click or use the transform menu).
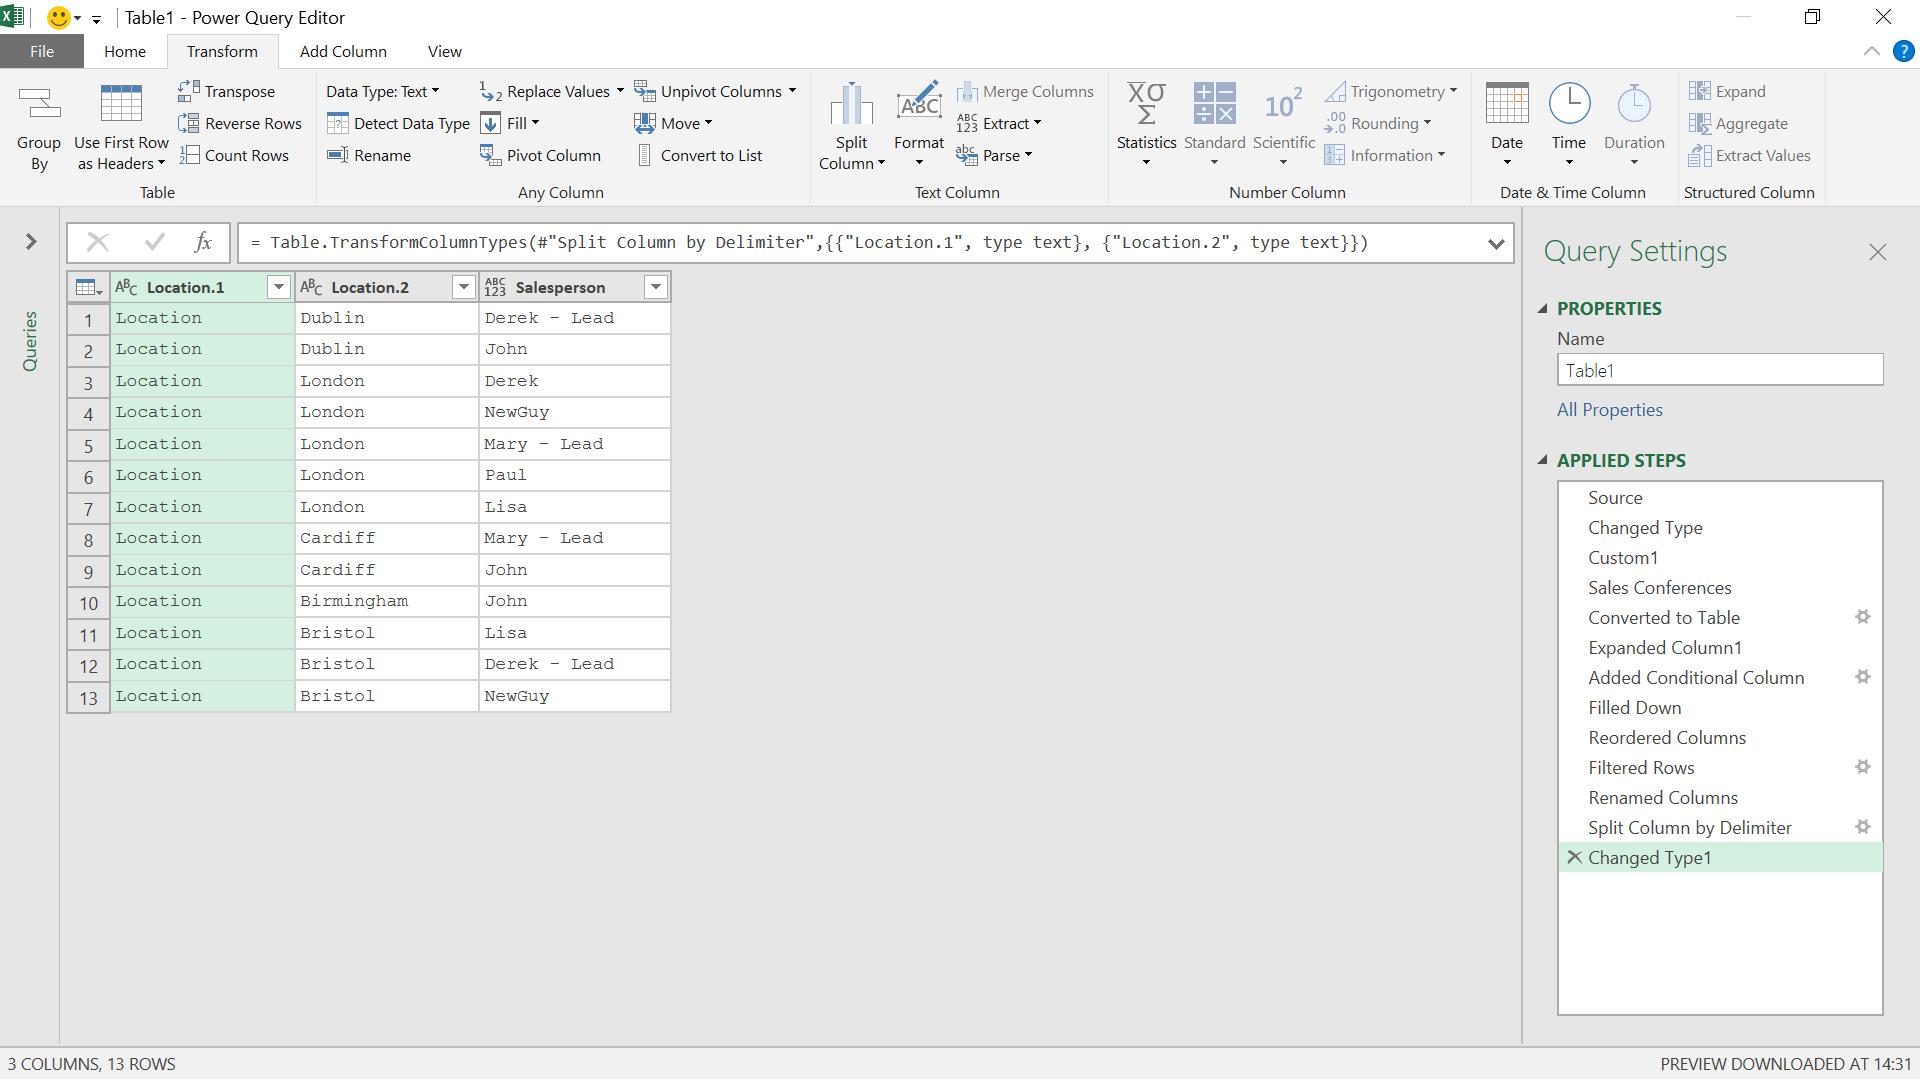
I can now get rid of the Location.1 column and rename the other location column. I ‘Close & Load’ to Excel.
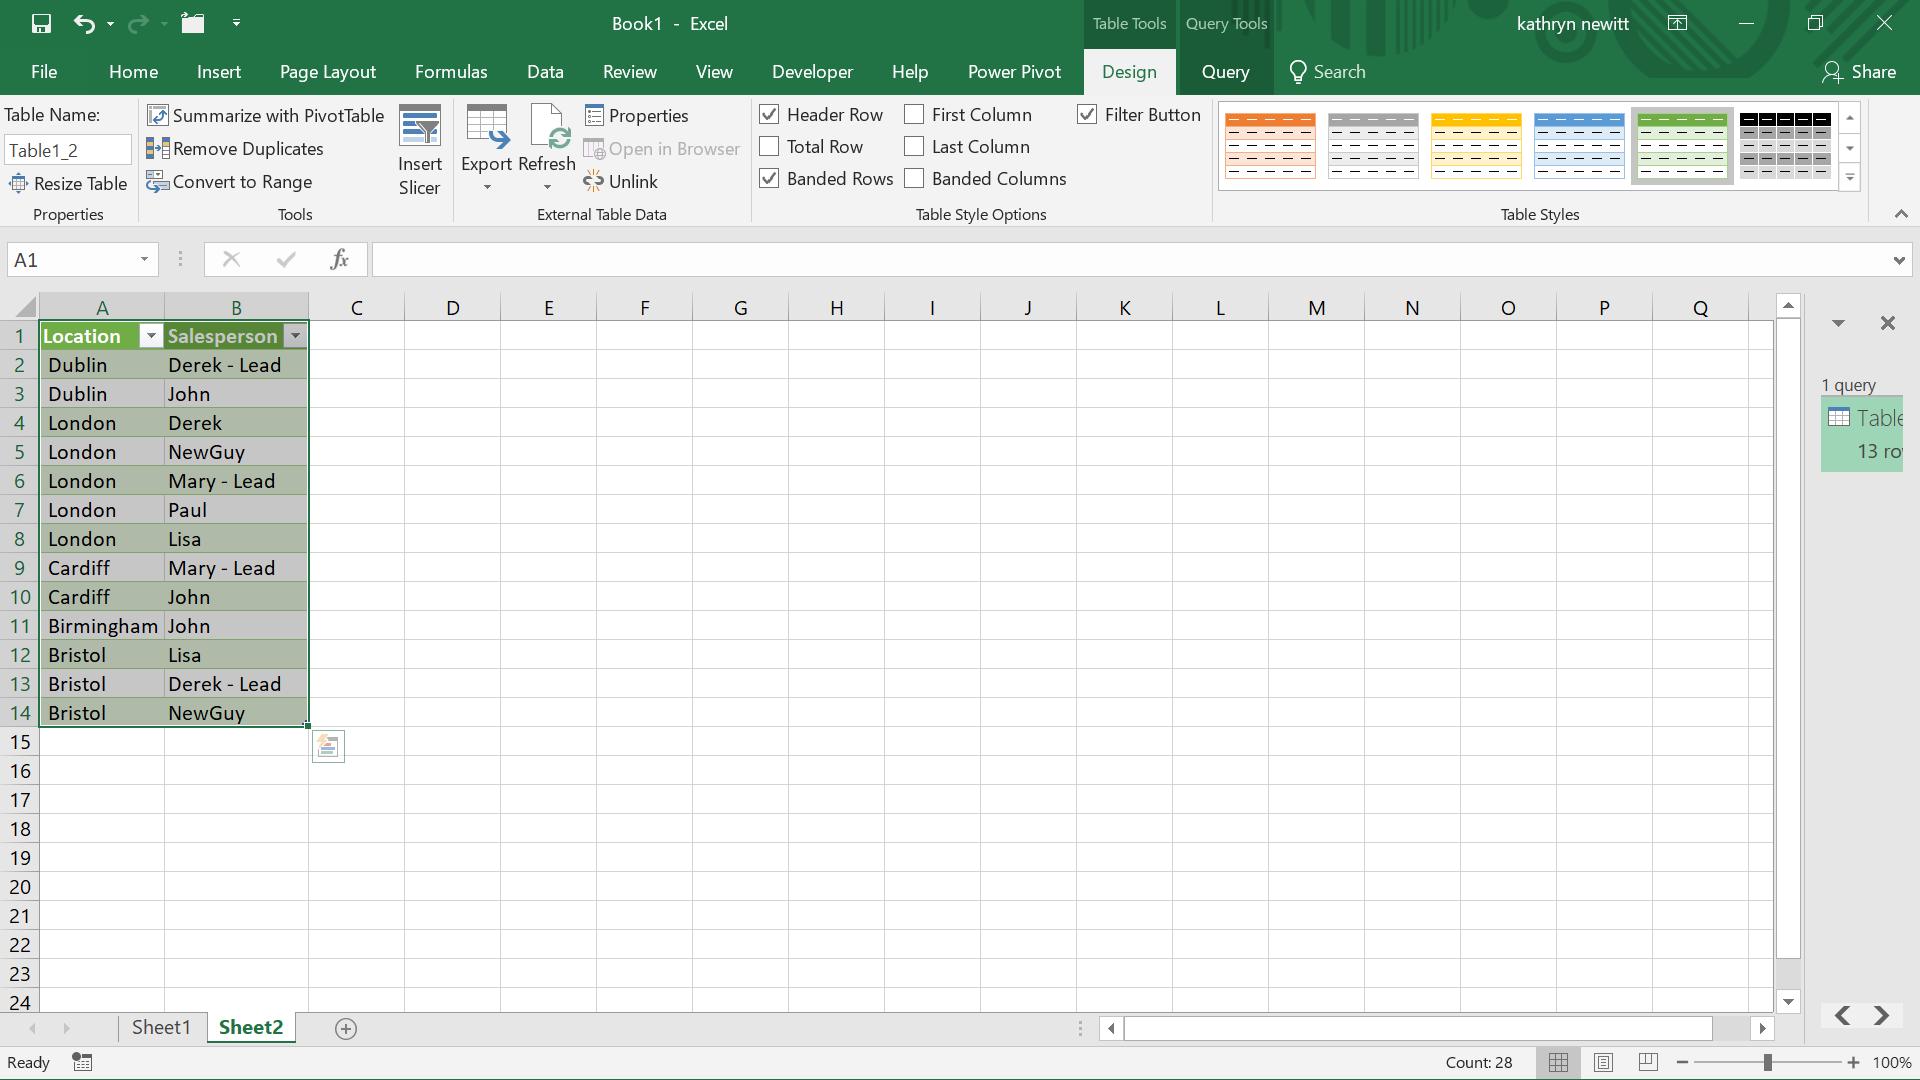
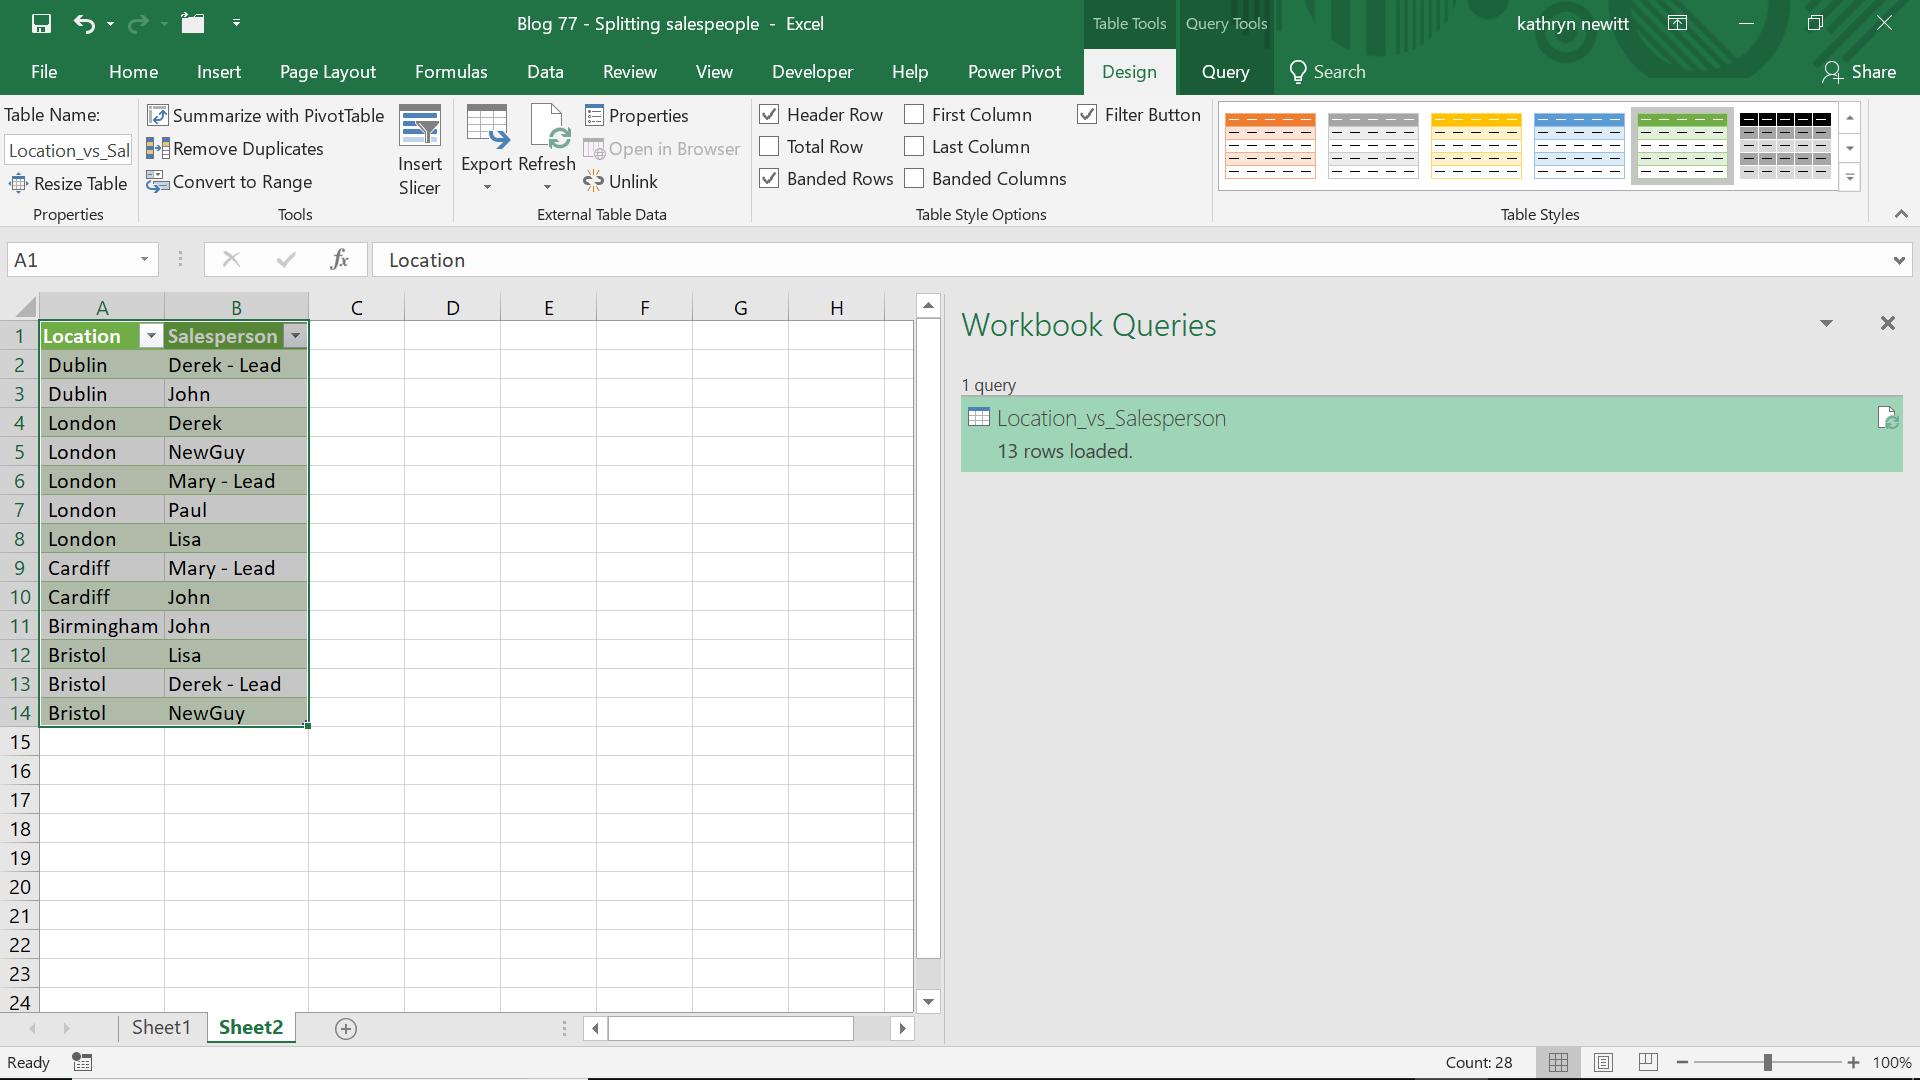
Now to test my query. In my original Excel data, I try adding a new location (Leeds) and a new salesperson ‘Sam’, who will attend the conferences in Leeds and London.
After refreshing my query, the new salesperson Sam appears in both locations:
Want to read more about Power Query? A complete list of all our Power Query blogs can be found here. Come back next time for more ways to use Power Query!