
Power Query: Table of Tables
8 April 2020
Welcome to our Power Query blog. This week, I look at how to reformat a table of data which is made up of sub-tables.
I have the following data from my imaginary salespeople:
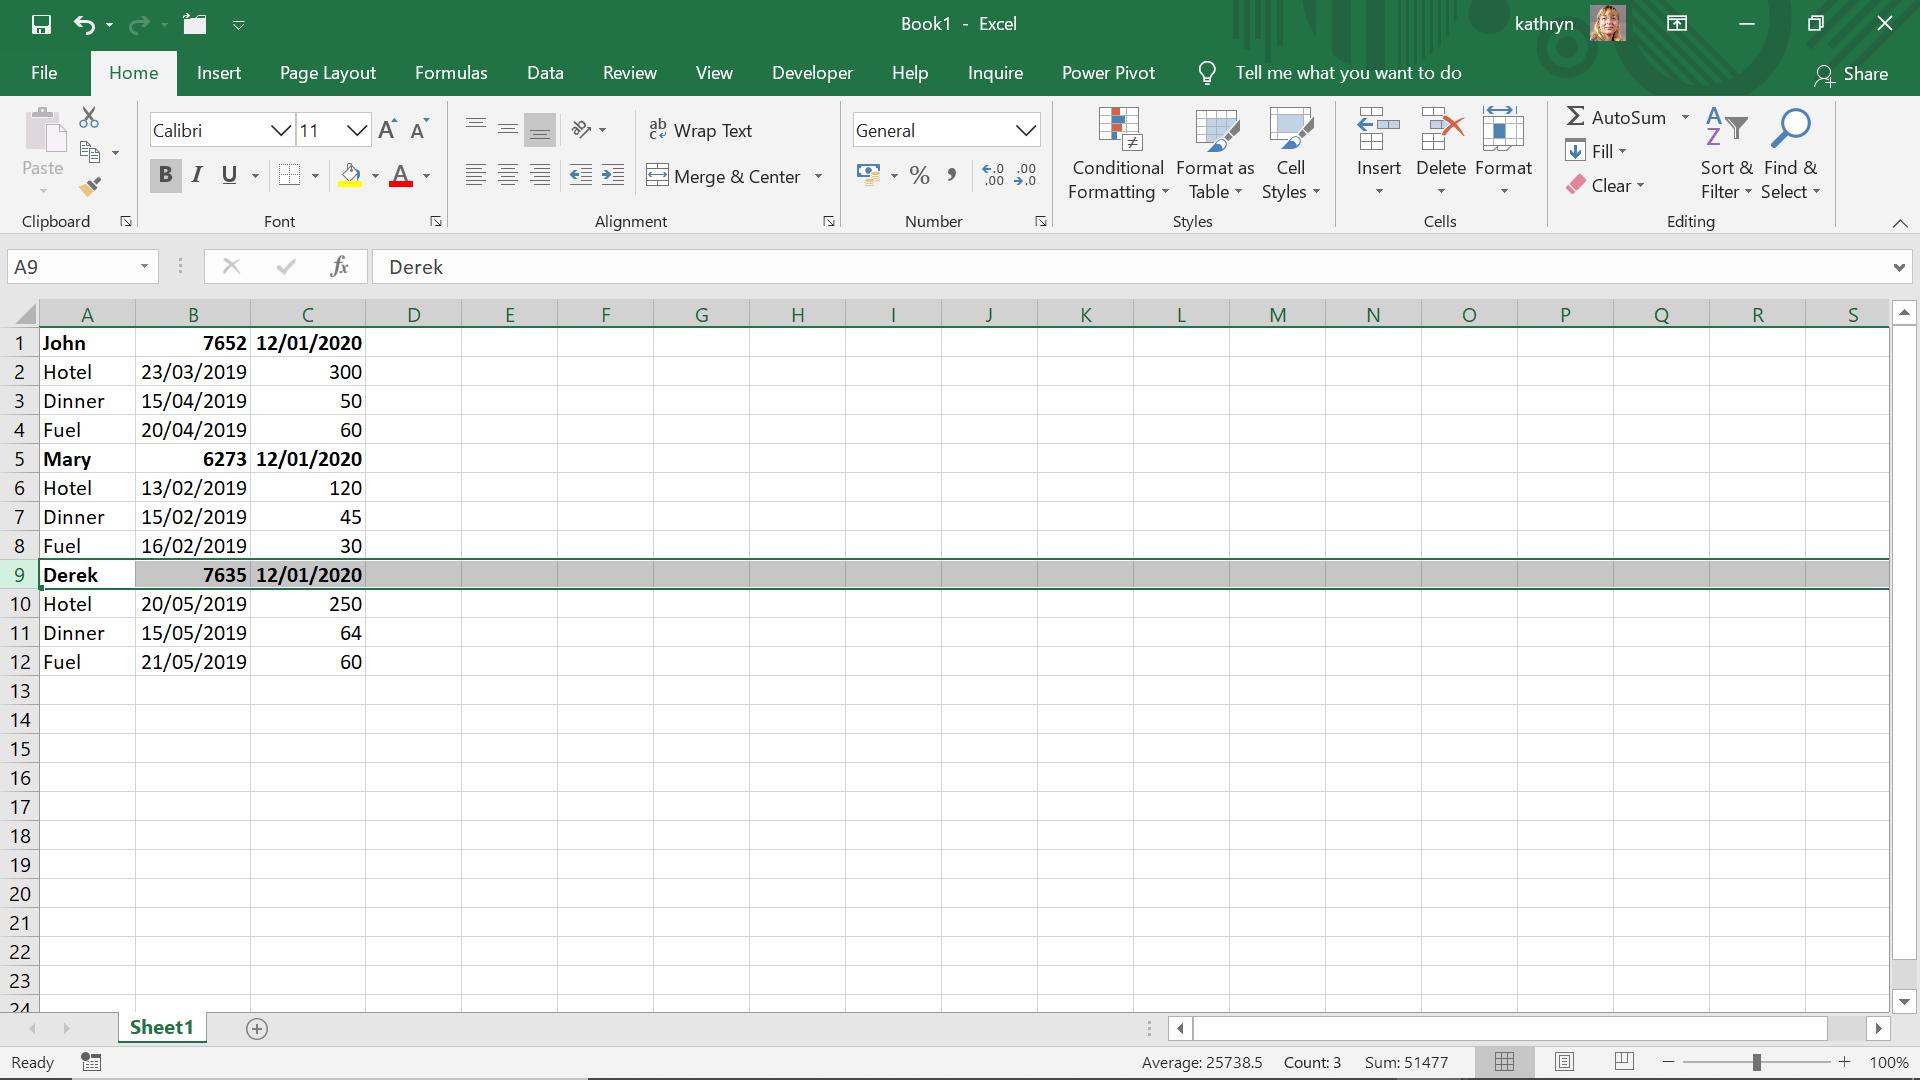
I have information for three of my salespeople, but I’d like to reformat my data so that I have everything in separate columns. I begin by extracting my data to Power Query using the ‘From Table’ option in the ‘Get & Transform’ section on the Data tab.
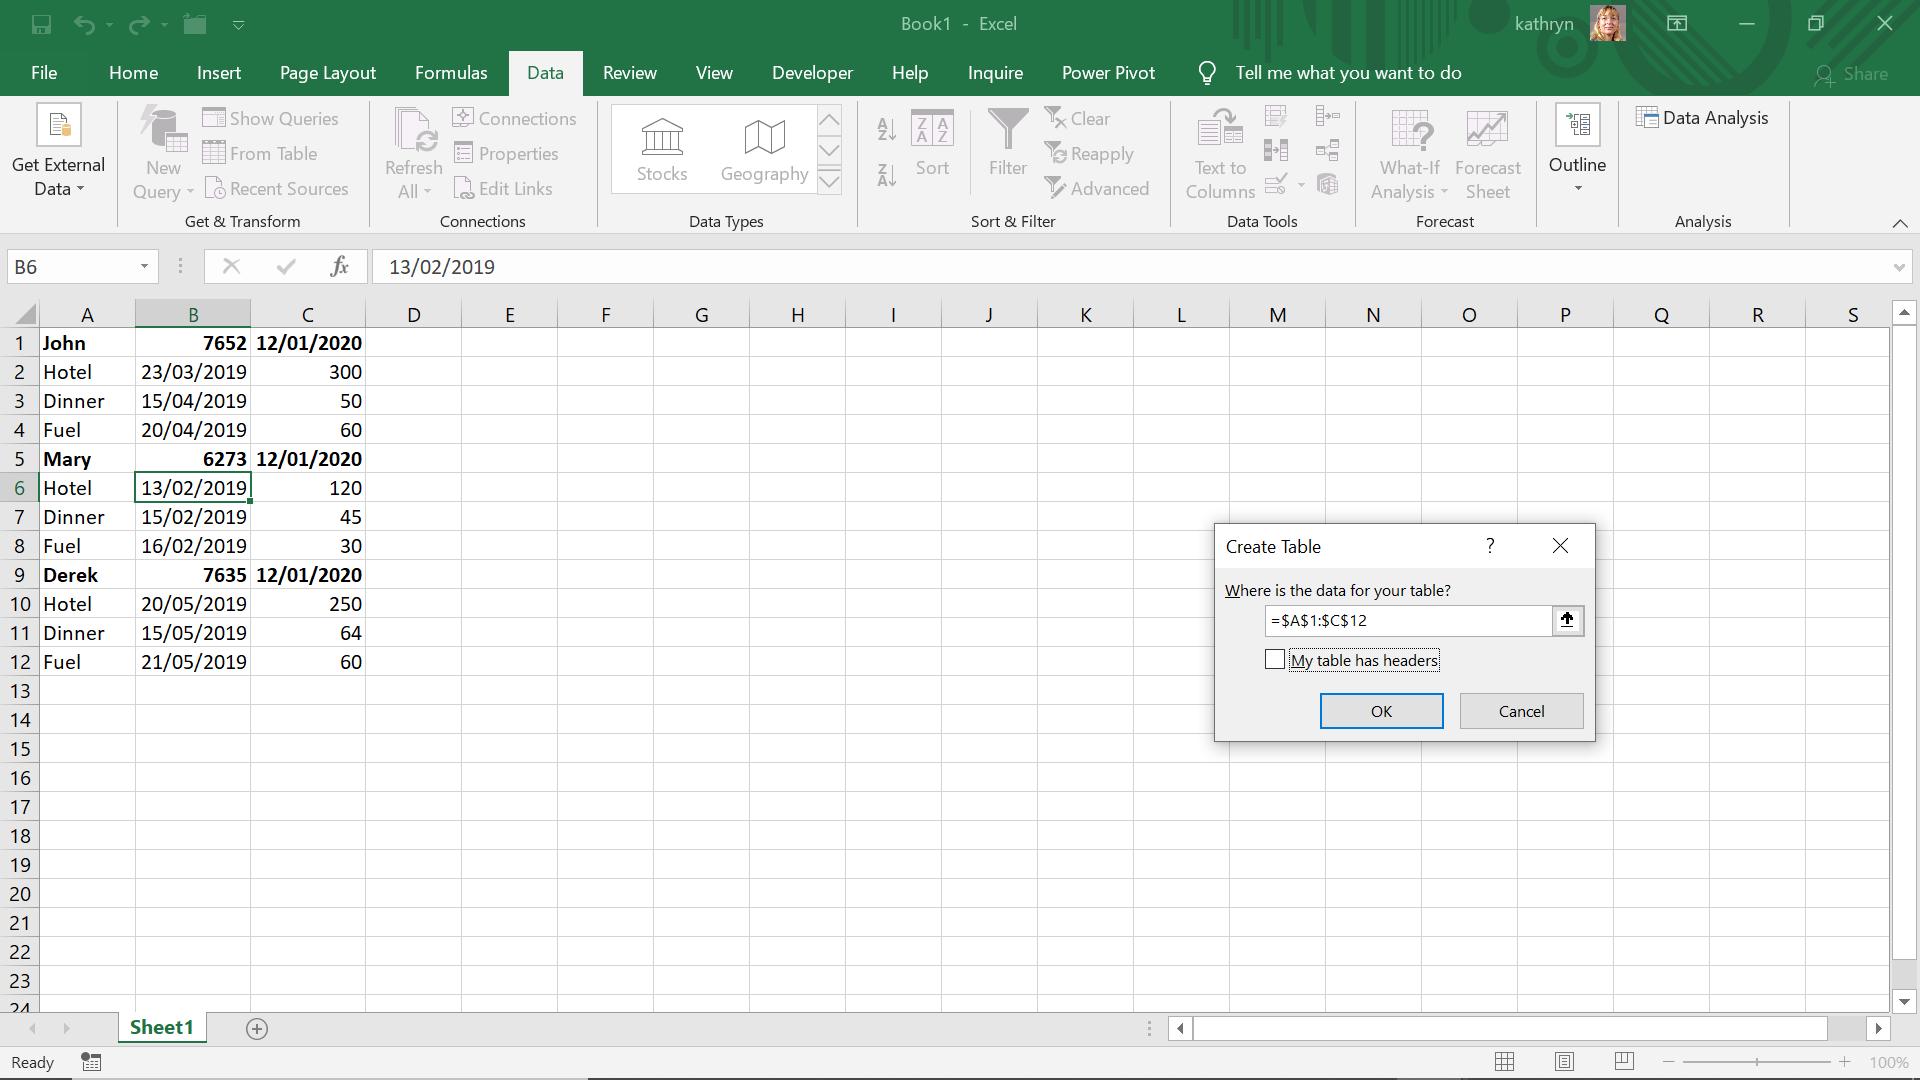
I accept the default area, but I uncheck the ‘My table has headers’ section since the headings at the top are not for all the data.
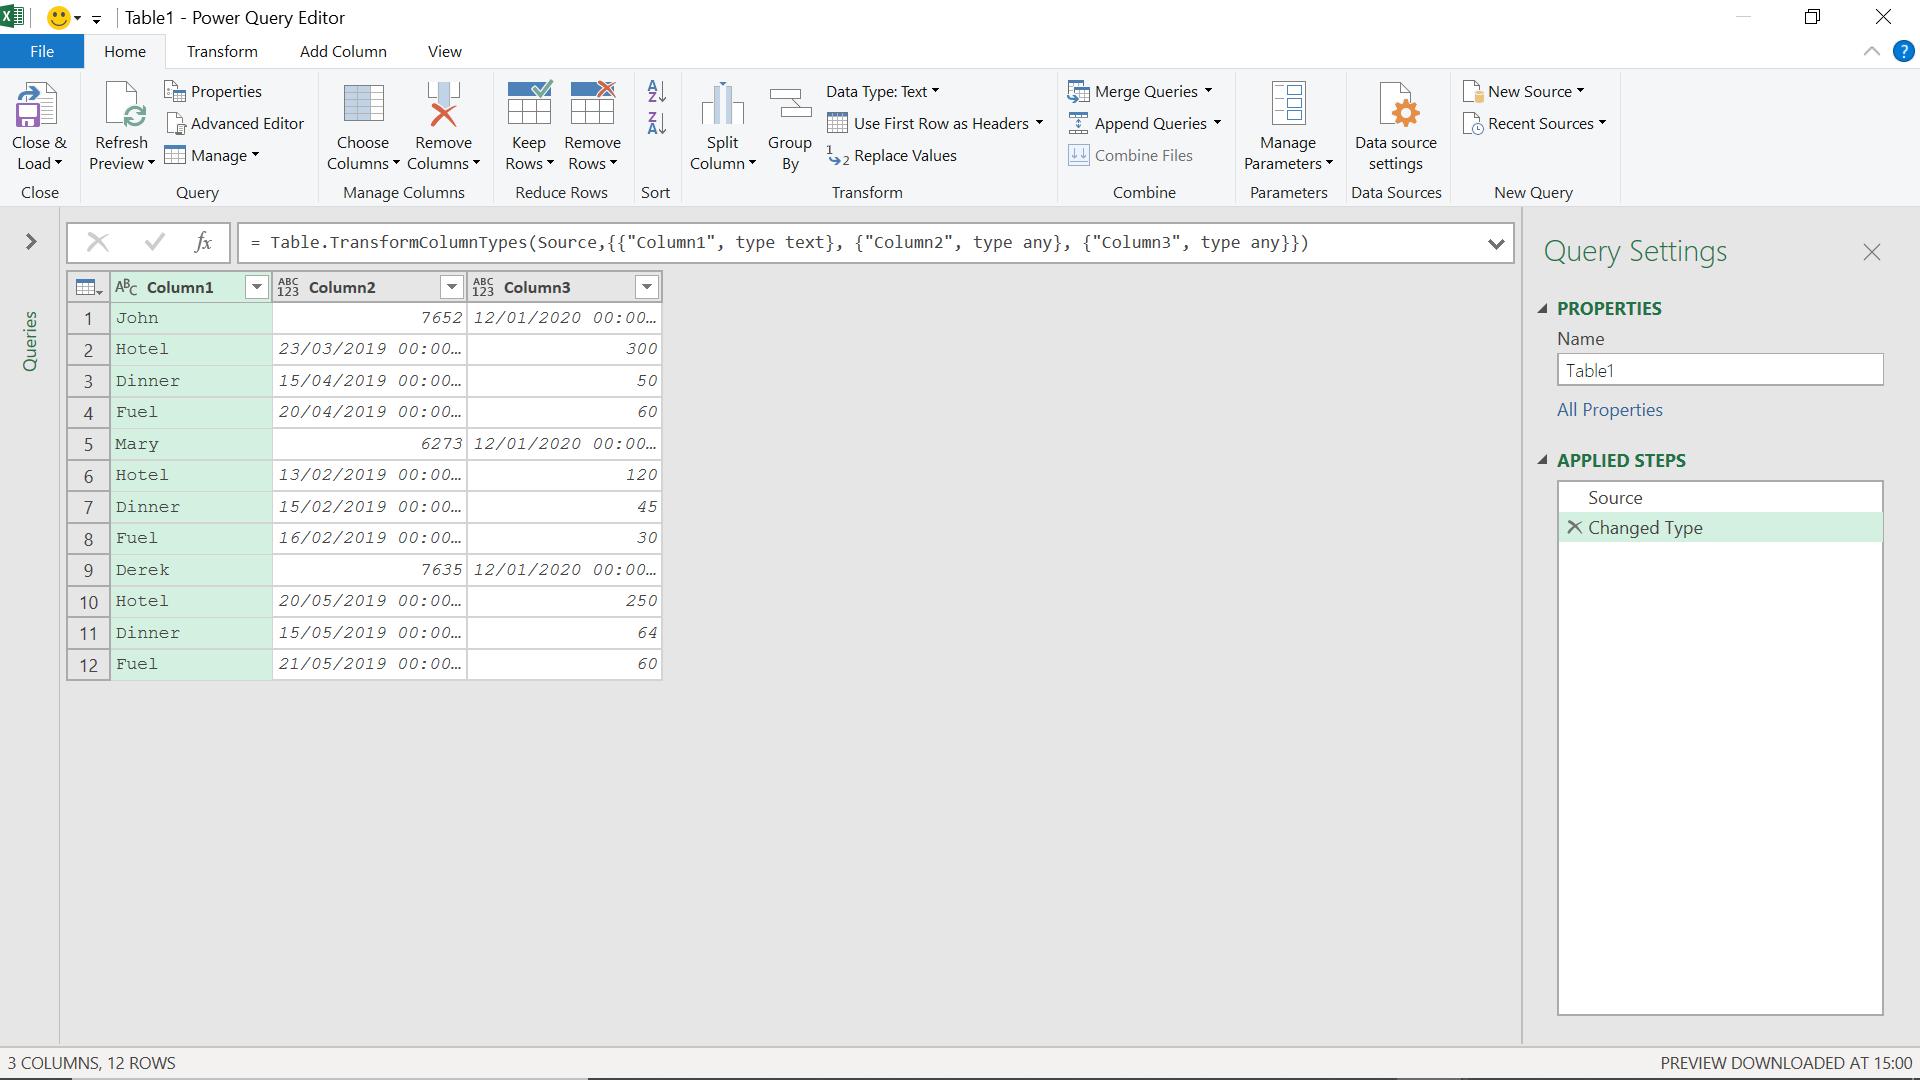
I remove the ‘Changed Type’ step since it is serving no purpose here.
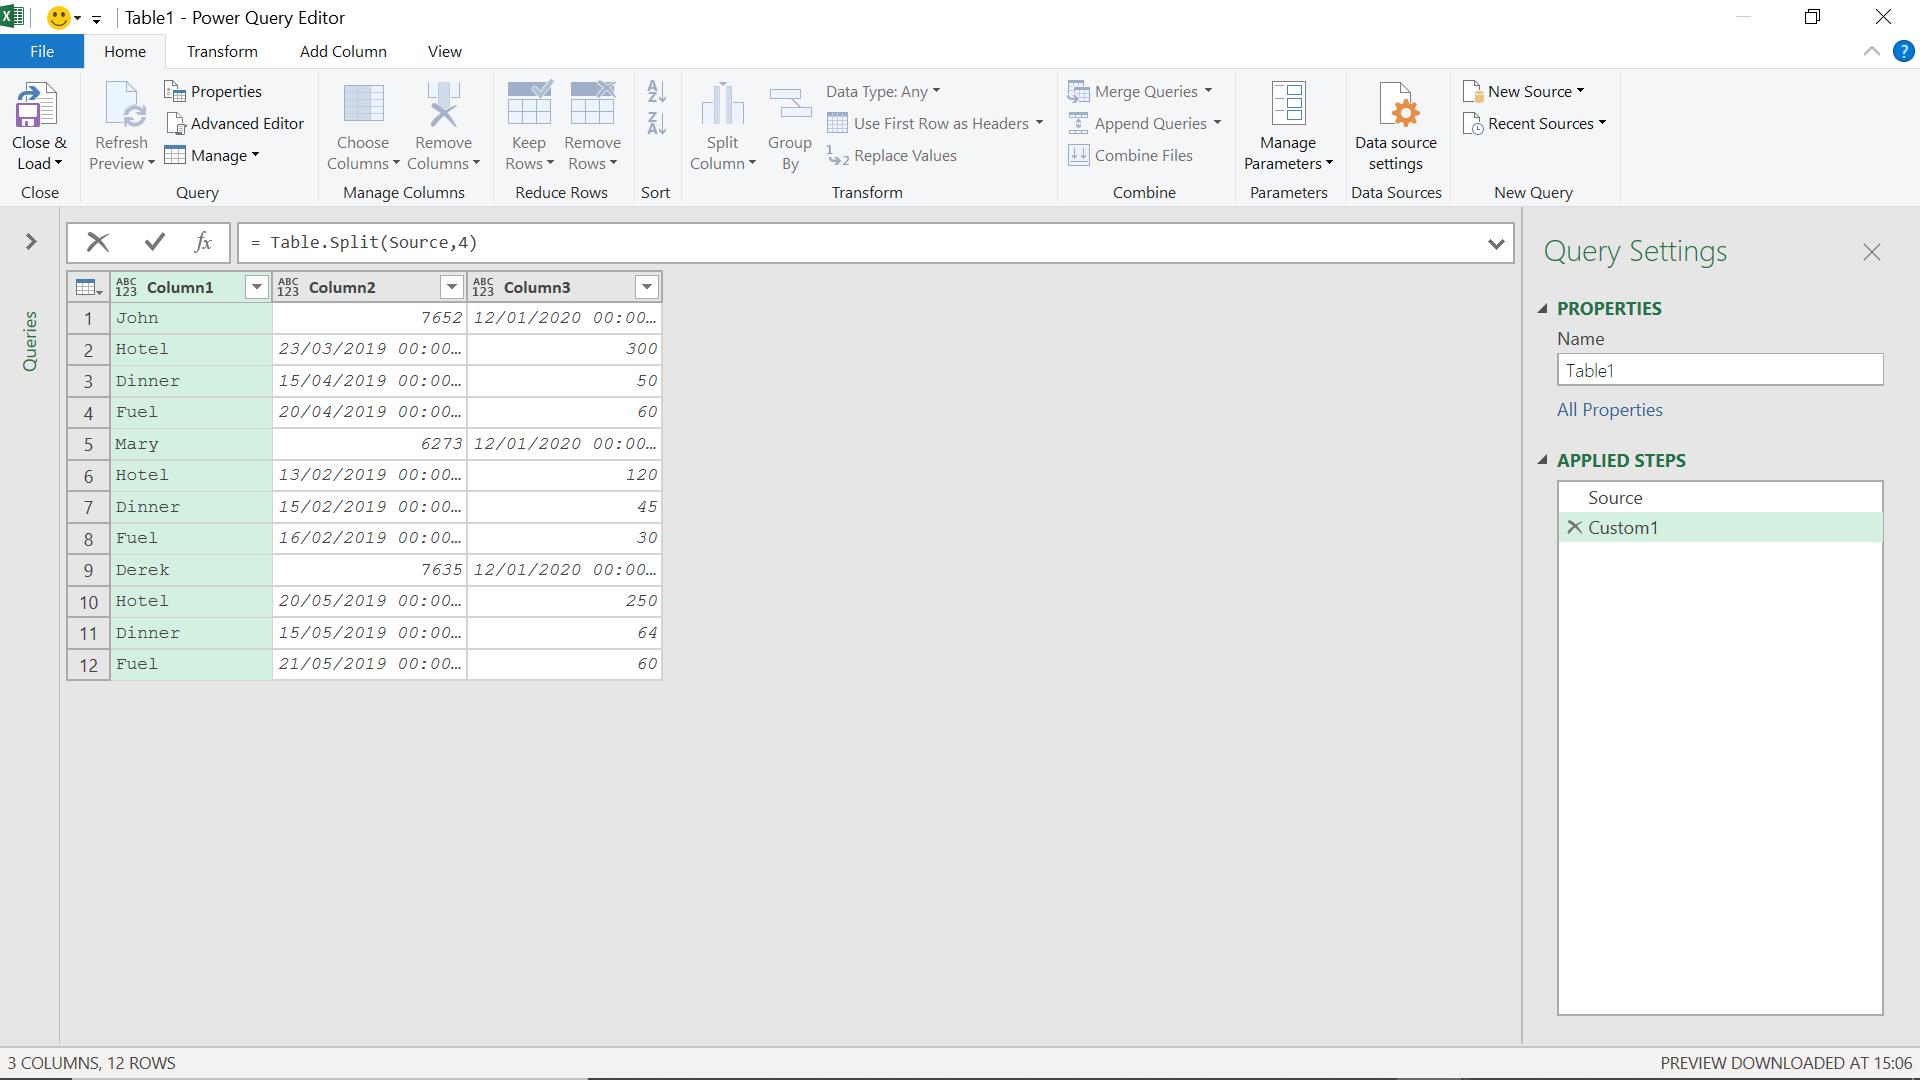
My data is clearly made up of three separate tables, so I will split this table using the M function Table.Split():
Table.Split(table as table, pageSize as number) as list
This function splits the table into a list of tables, where the first element of the list is a table containing the first pageSize rows from the source table, the next element of the list is a table containing the next pageSize rows from the source table, etc.
Since each of my sub-tables is the same size, this will work for my example. I add a step using the fx button.
The M code I have used is:
=Table.Split(Source, 4)
This will split the table extracted as ‘Source’ into tables of four (4) rows.
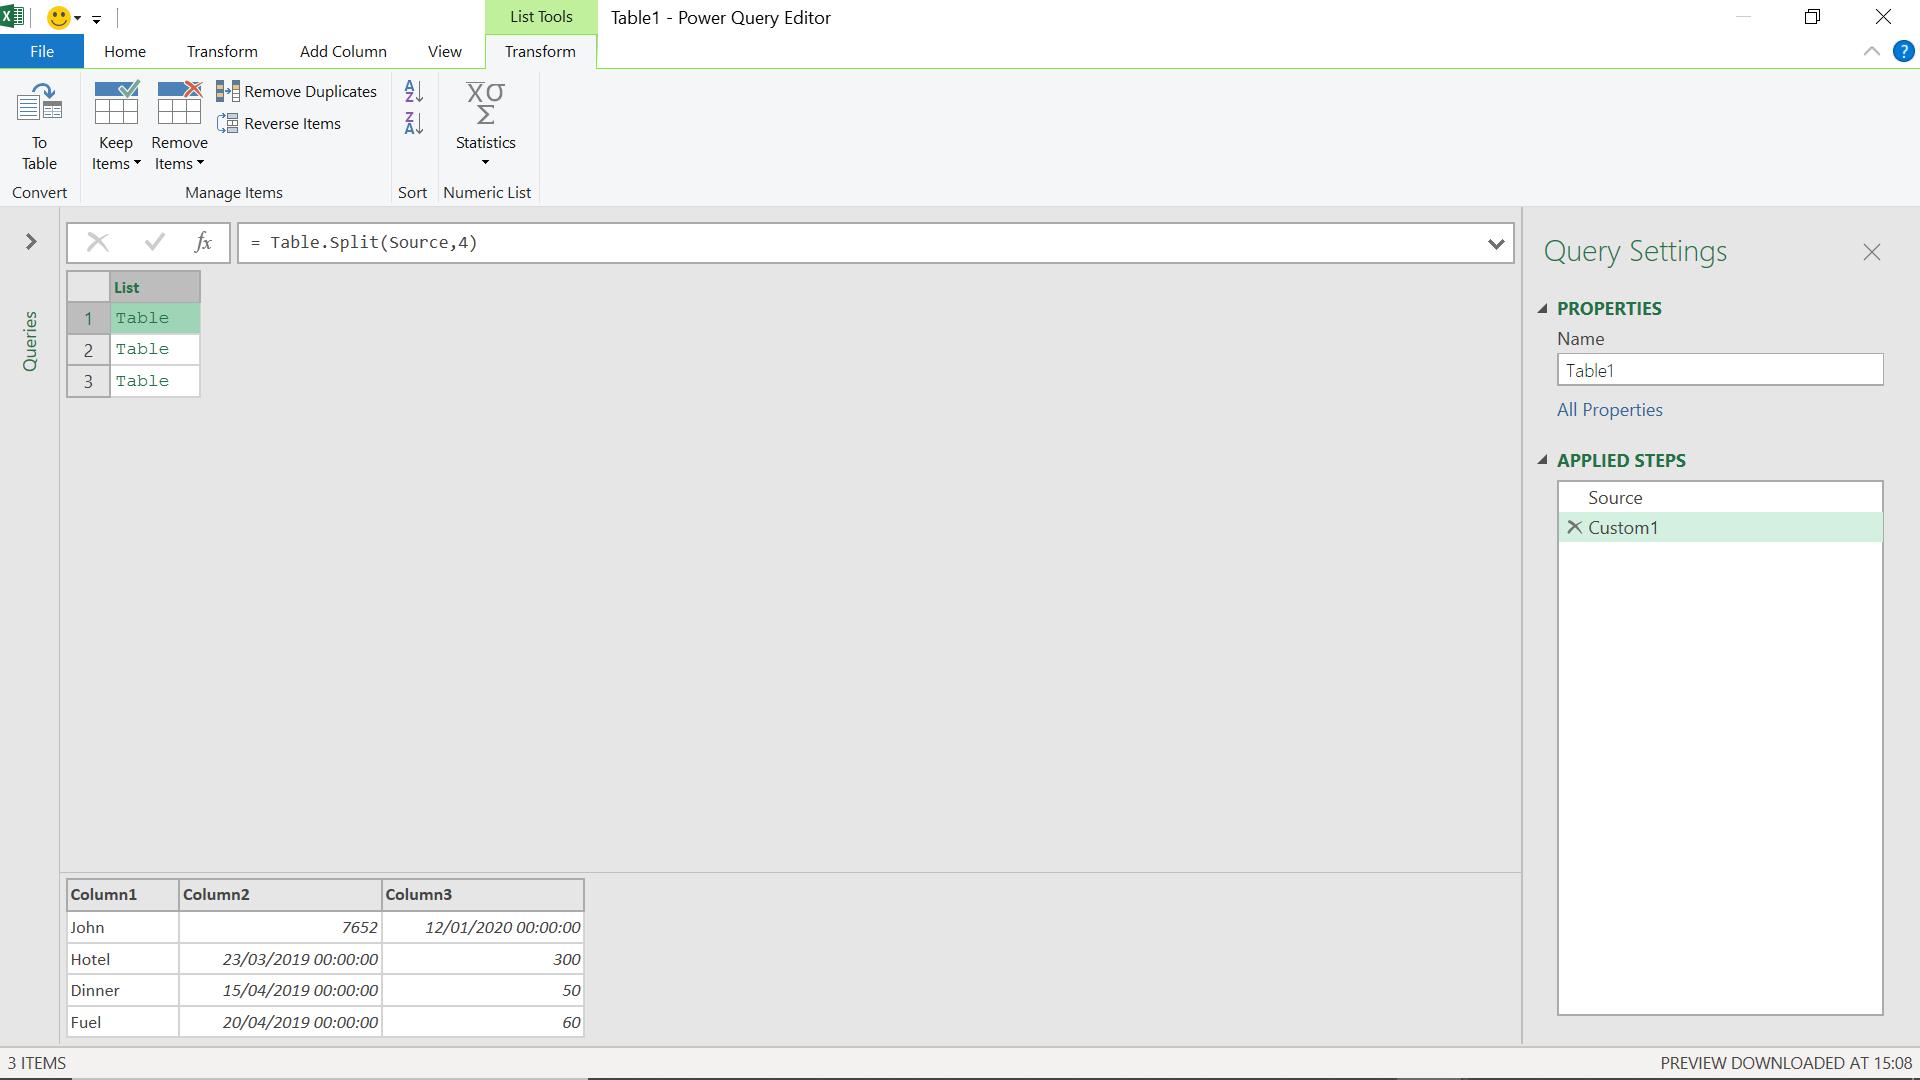
When I execute this step, I see that I get a list of three tables, and when I click the space next to ‘Table’ I can see the data in each table. I need to know what to do to each of my tables, and then put it into a function to use against my list.
I start with one of the tables, and transform my data:
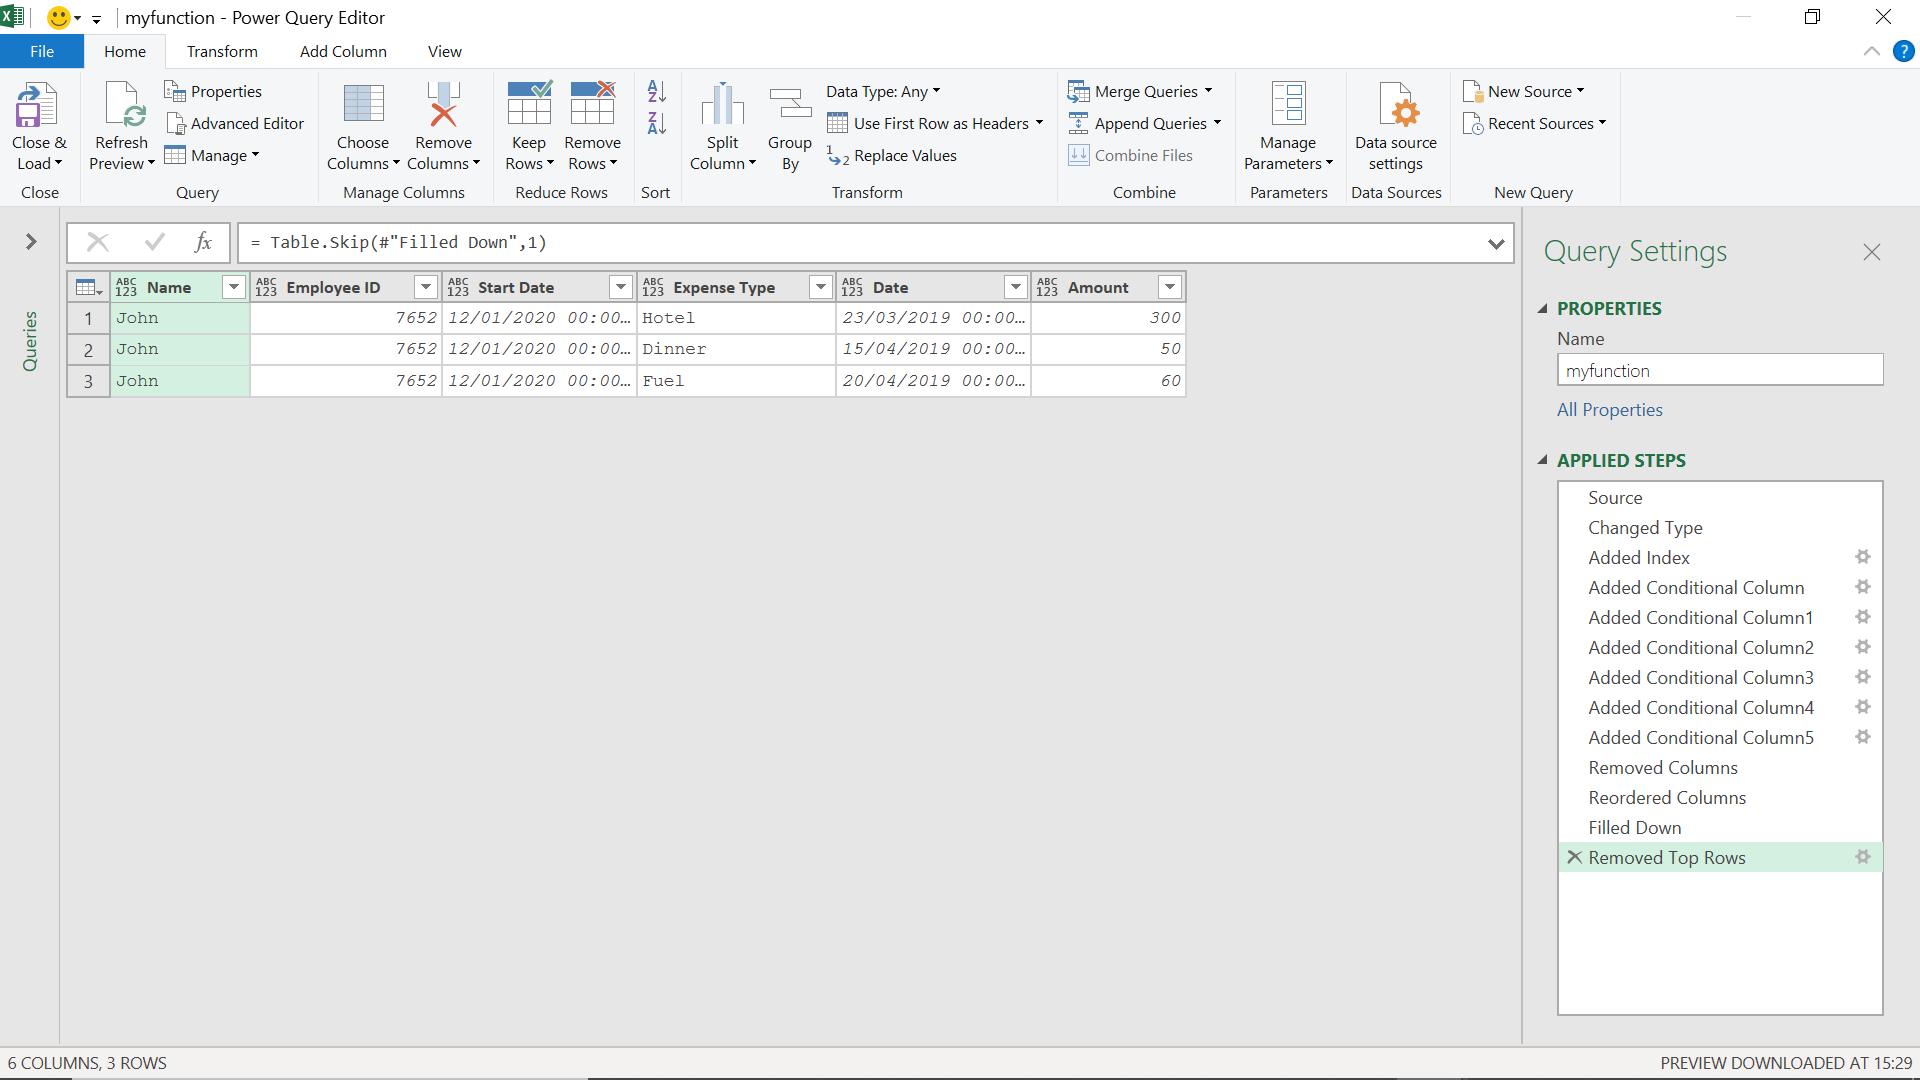
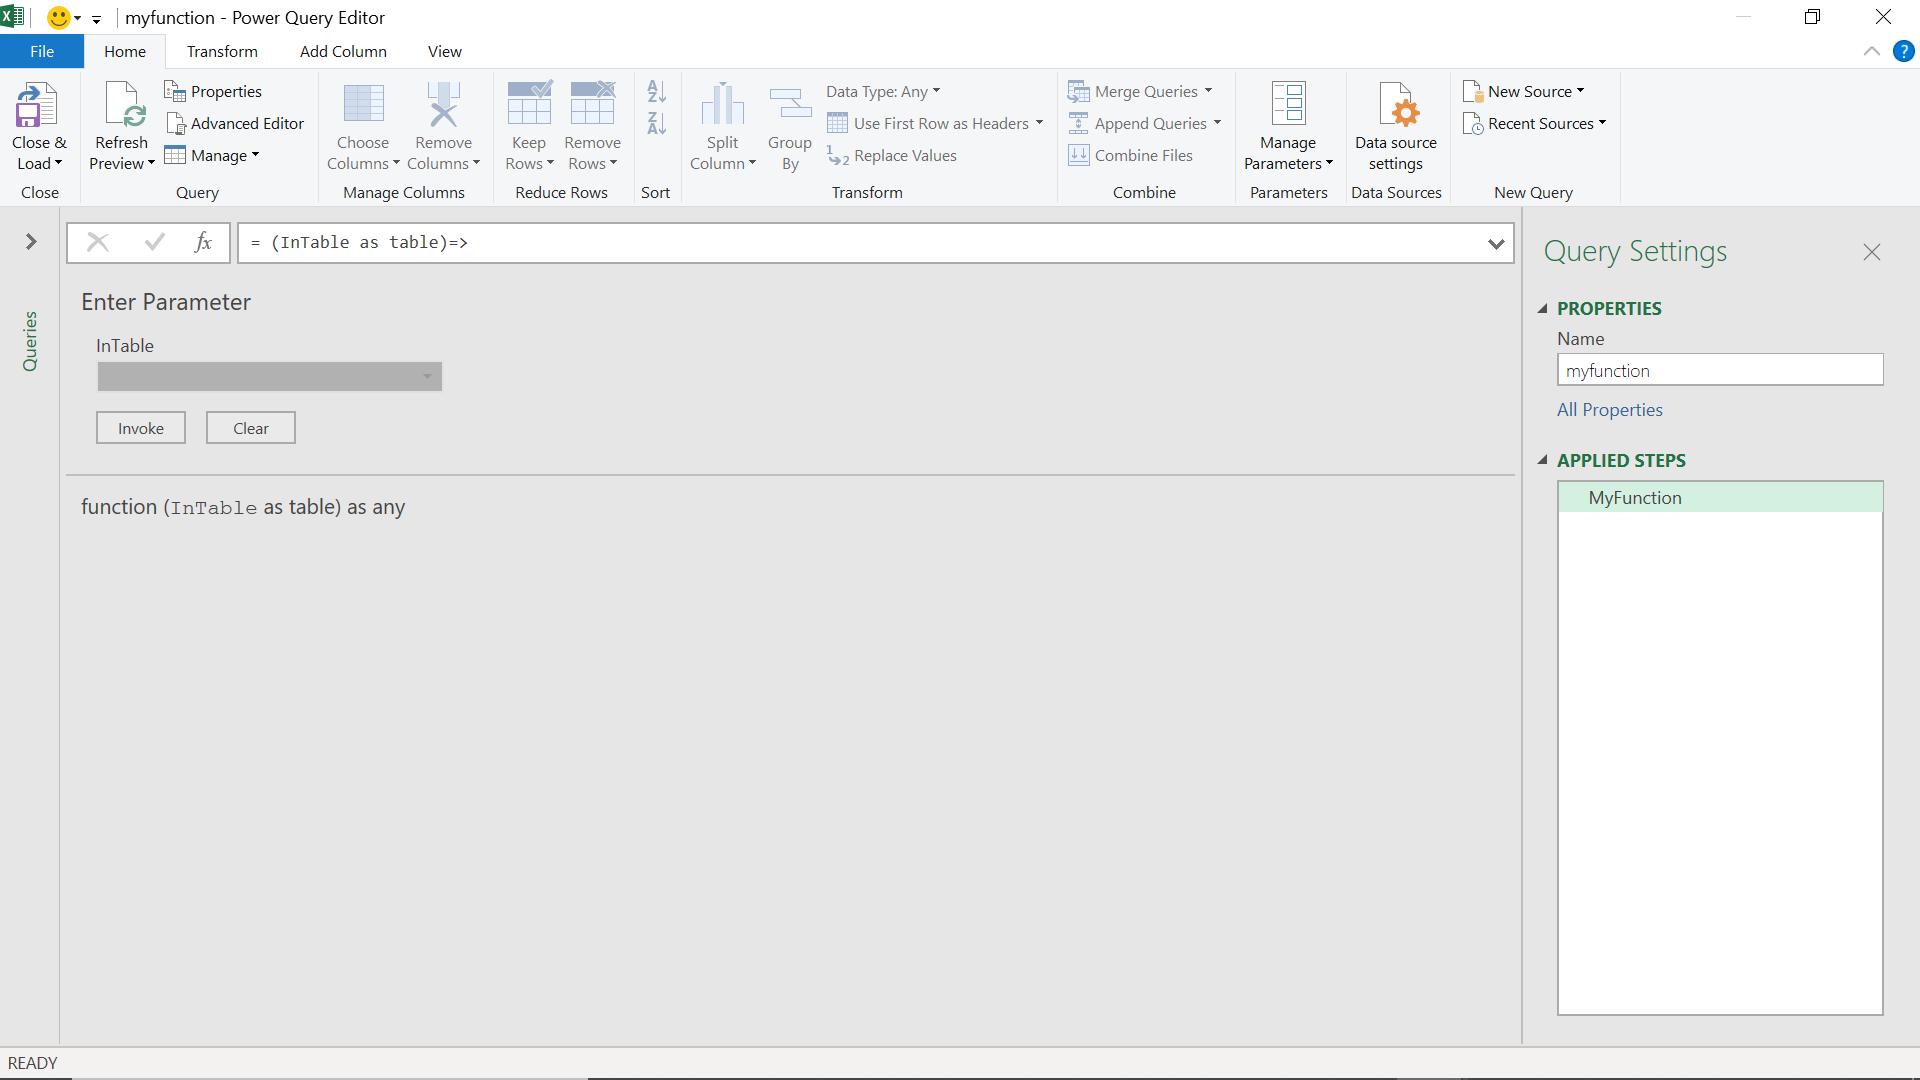
This gives me my function body. I now need to convert this to a function.
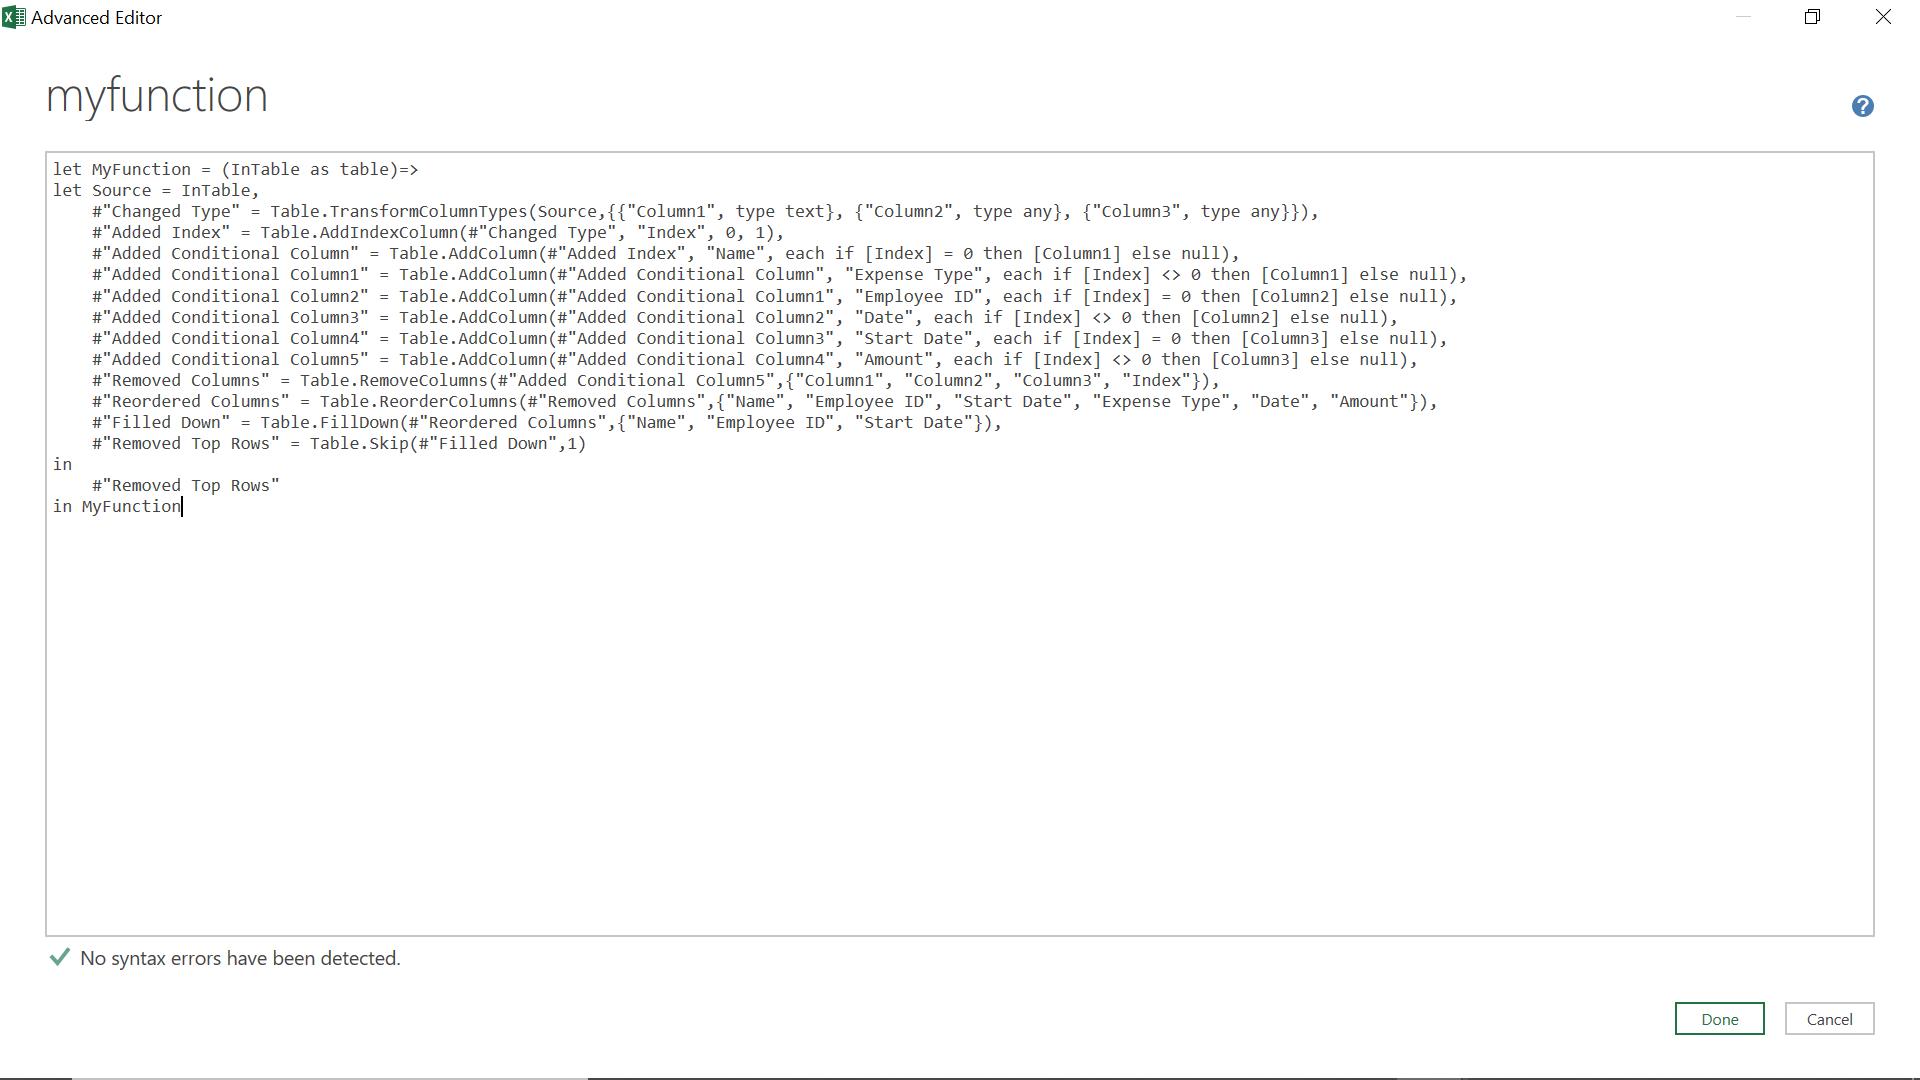
Once I click ‘Done’, my function prompts for a table:
Now I can go back to my list of tables, and apply my function.
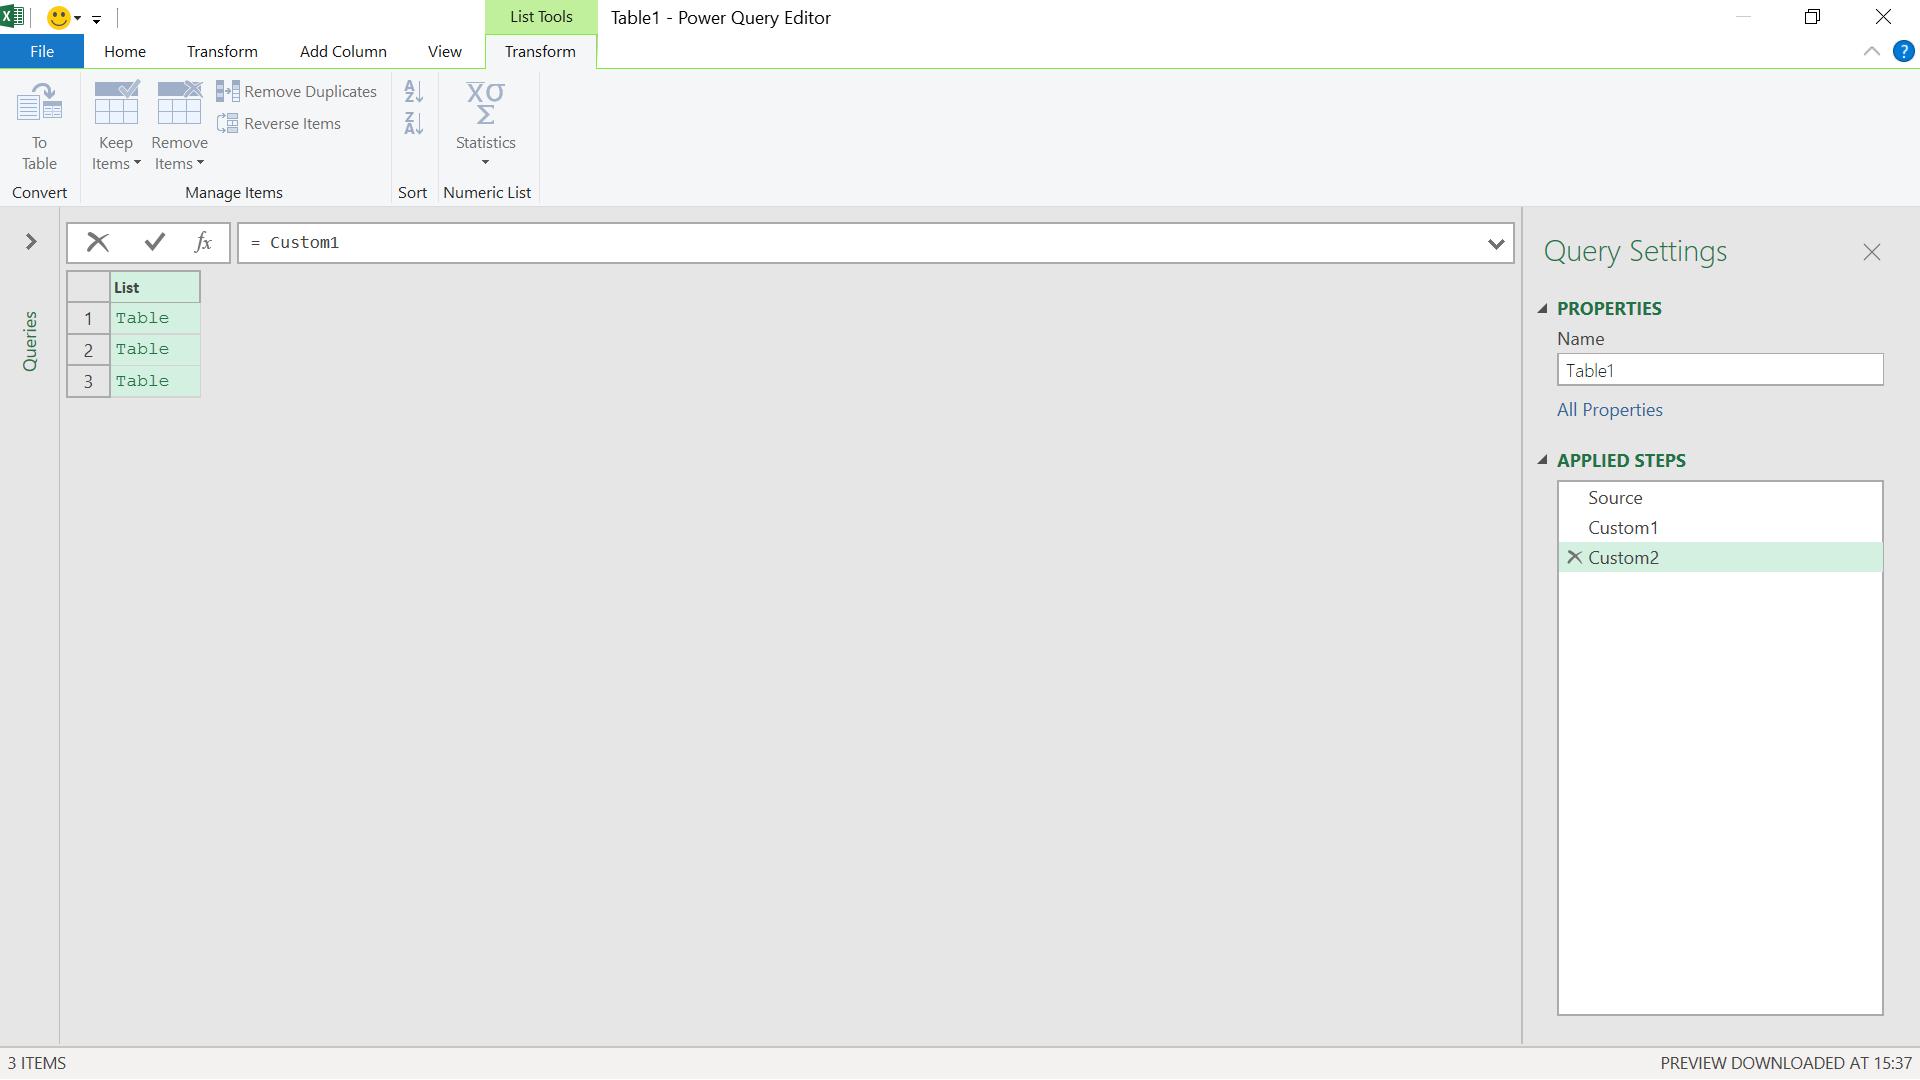
I need to apply my function to my list using List.Transform(). The M code I use is
= List.Transform(Custom1, myfunction)
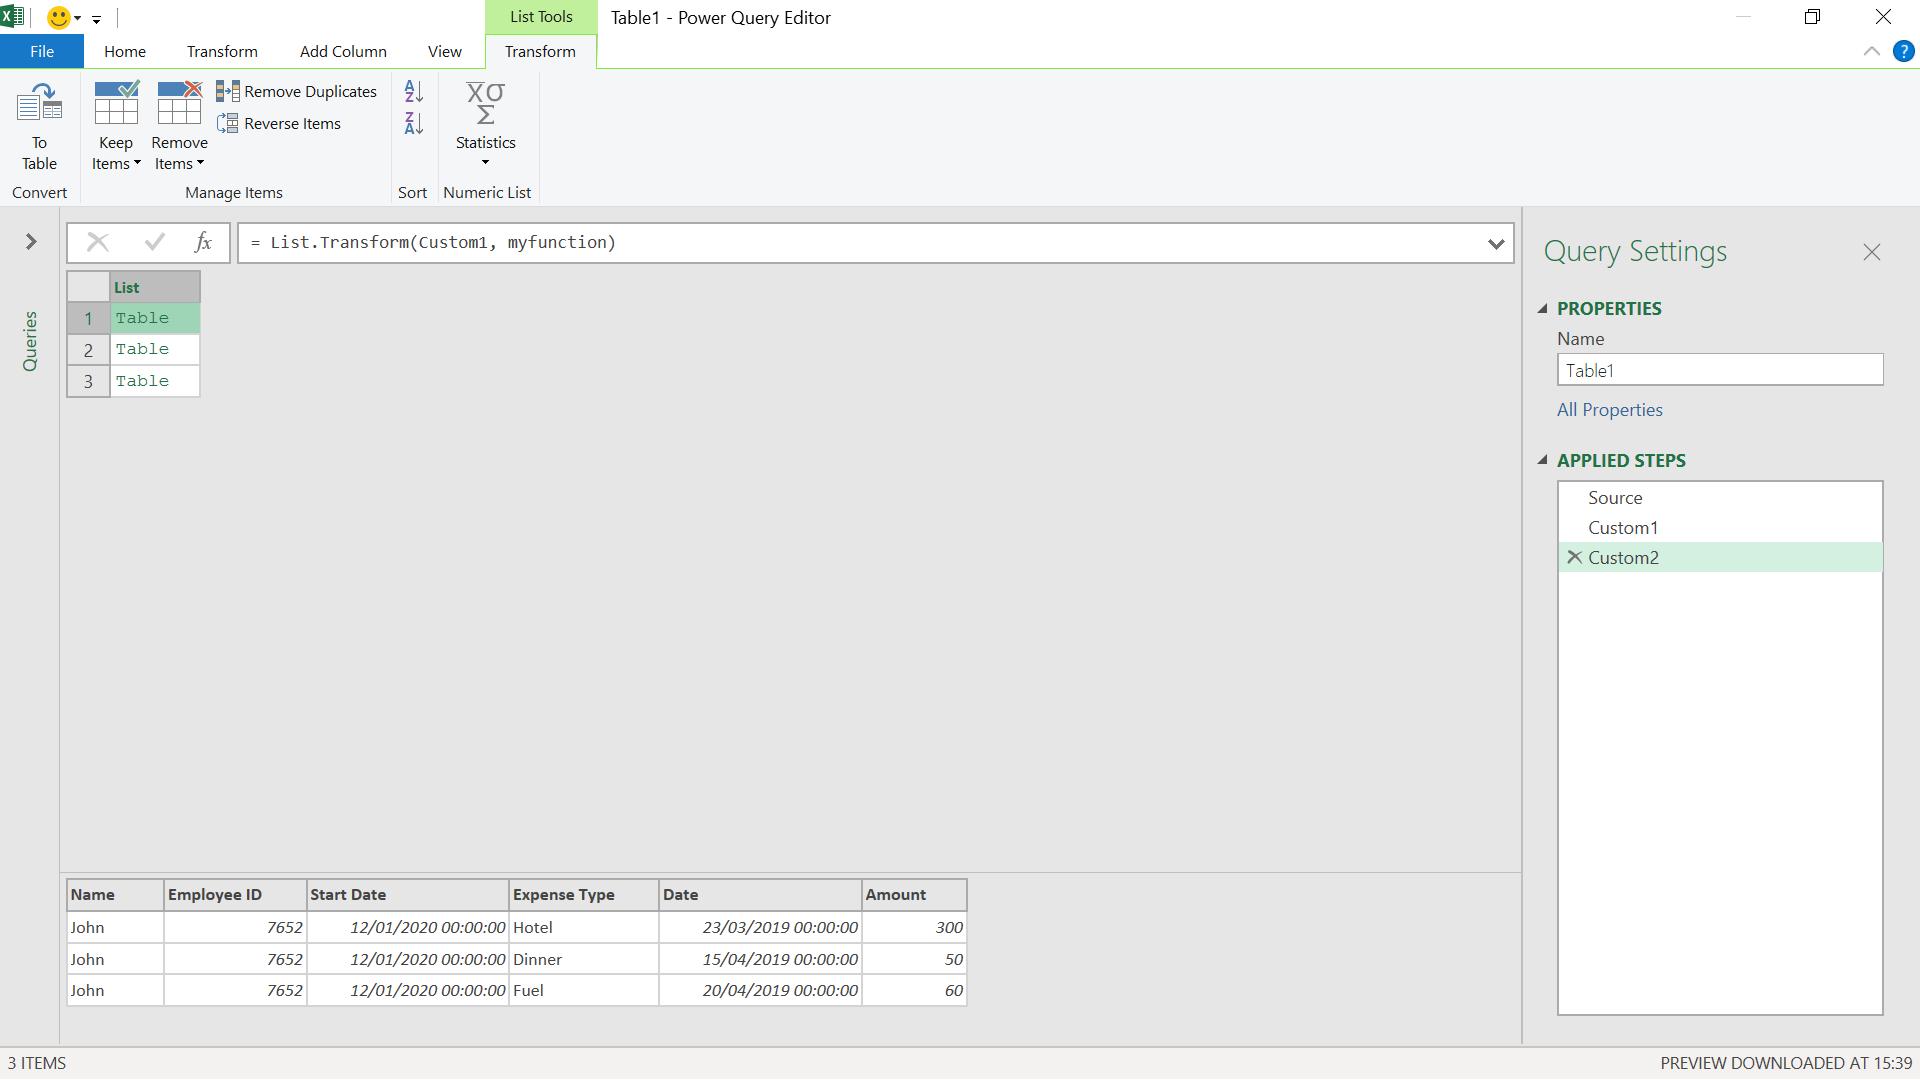
I can see that the data within the tables in my list has been transformed.
My final step is to glue my tables back together. I use Table.Combine() for this. My M code is:
= Table.Combine(Custom2)
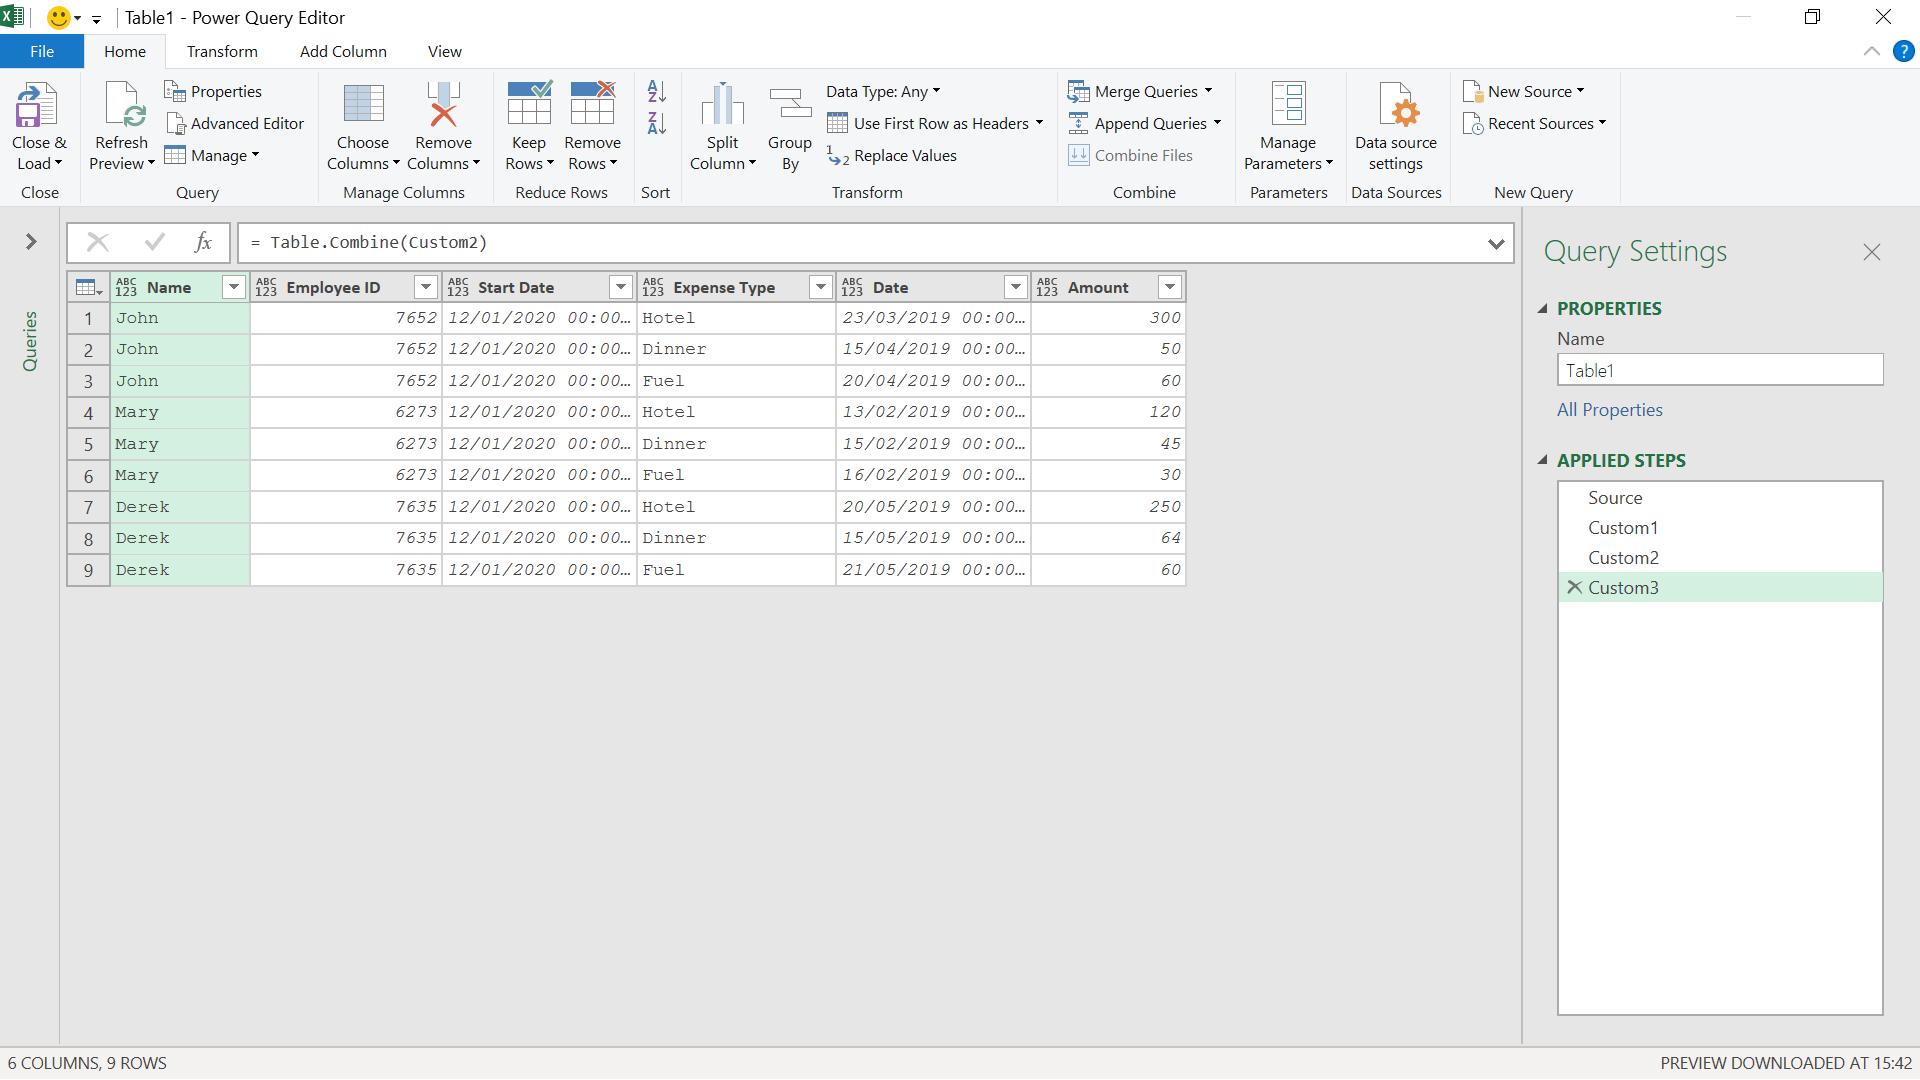
My data is transformed into one large table.
Come back next time for more ways to use Power Query!