Power Query: Time for a List
20 November 2019
There are three M functions in Power Query that will allow me to create a time dimension:
- List.Dates(start as date, count as number, step as duration) as list
This returns a list of date values of size count, starting at start. The given increment, step, is a duration value that is added to every value - List.Times(start as time, count as number, step as duration) as list
This returns a list of time values of size count, starting at start. The given increment, step, is a duration value that is added to every value - List.DateTimes(start as datetime, count as number, step as duration) as list
This returns a list of datetime values of size count, starting at start. The given increment, step, is a duration value that is added to every value.
I start with the List.Dates() function. I create a new blank query as follows:

I create a new step.

The M code I am using is
= List.Dates(DateTime.Date(DateTime.LocalNow()), 7, #duration(-1, 0, 0, 0))
which takes the current date and subtracts a day a total of seven (7) times.

This gives me the last seven days. I can convert my list to a table using ‘List Tools’, and I rename my new column Date.
To show how List.Times() works, I add a new ‘Custom Column’ from the ‘Add Column’ tab.

The M code I have used is:
= List.Times(#time(0, 0, 0), 96, #duration(0, 0, 15, 0))
There are 96 quarter-hours in 24 hours, so this will divide each day into 15-minute segments.

I need to expand my list into rows.

I choose to ‘Expand to New Rows’:

I could combine these columns, if I wish, by creating a new custom column.

This will give me a new DateTime column.

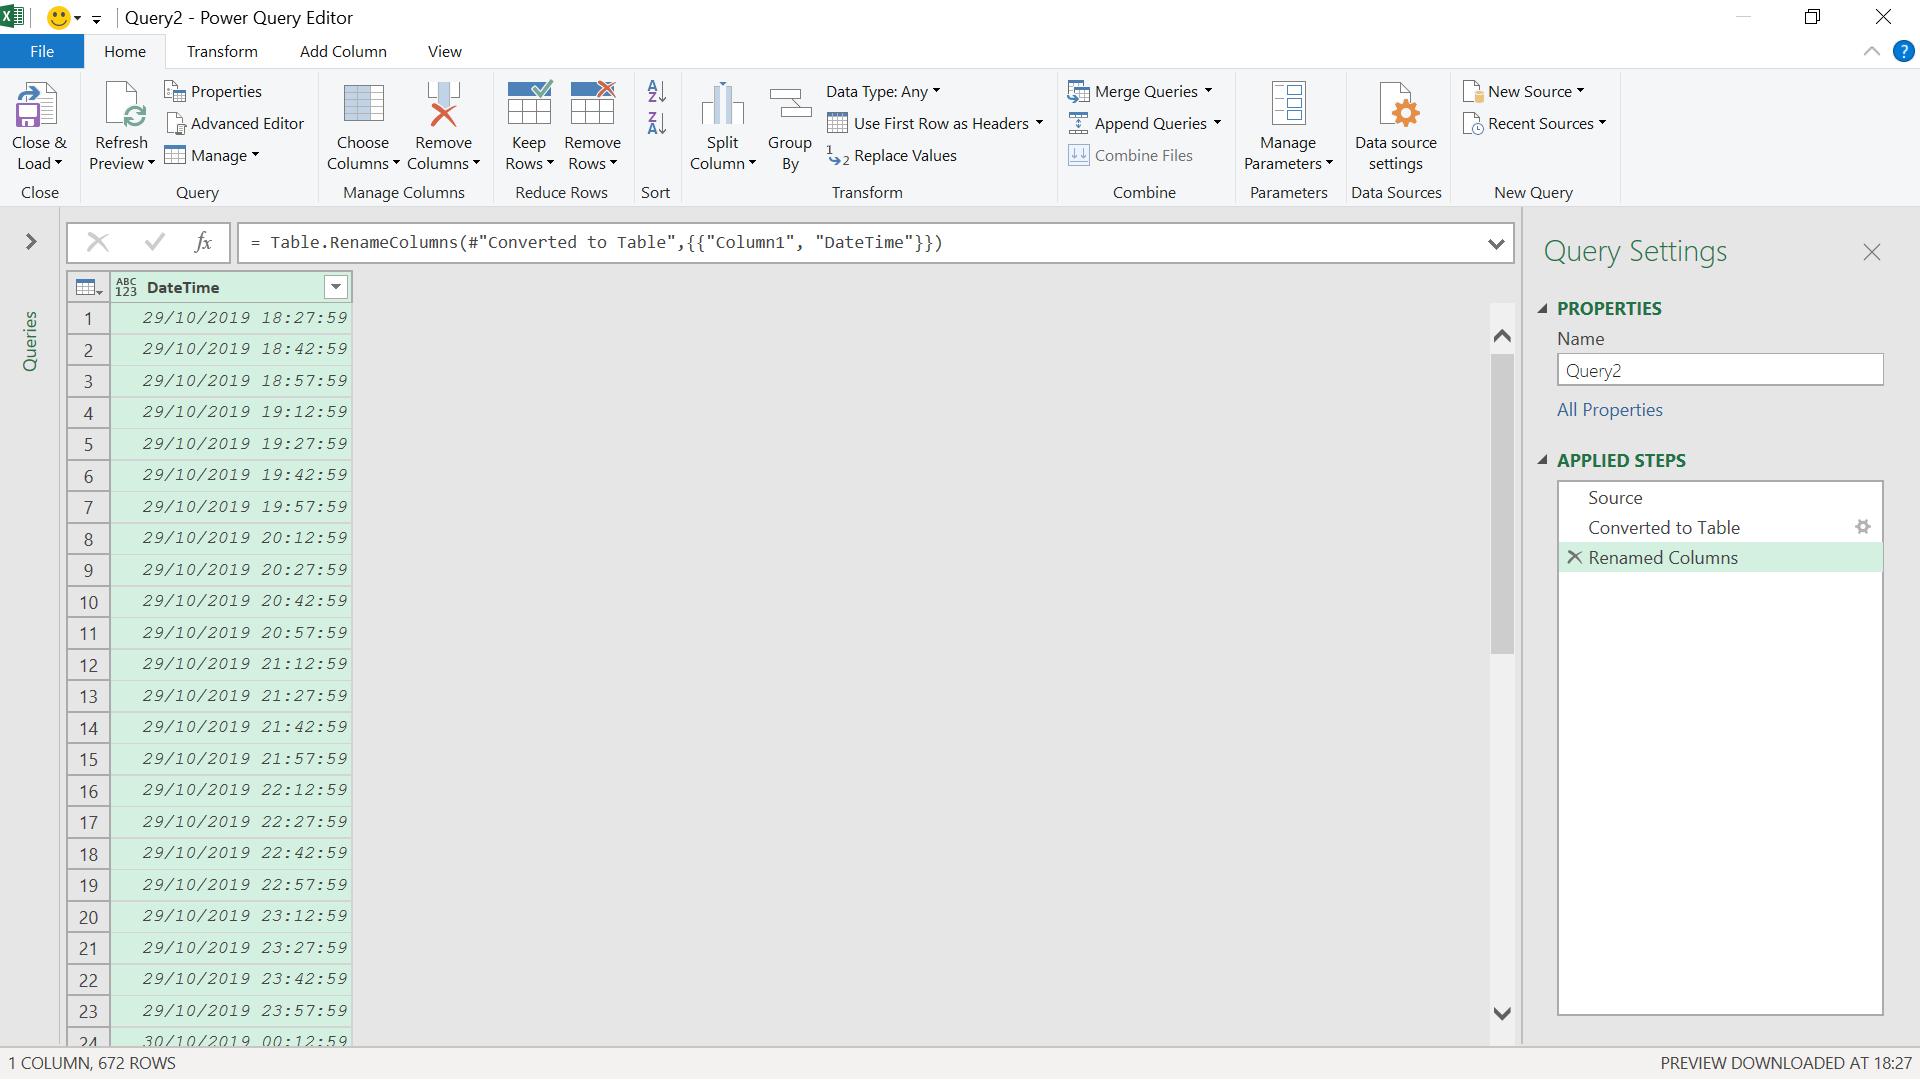
List.DateTimes() allows me to create datetime entries at intervals starting from a particular point in time, for example, now. I can show this in a new blank query:

The M code I have used is:
= List.DateTimes(DateTime.LocalNow(),672, #duration(0, 0, 15, 0))
which gives me 96 x 7 intervals of 15 minutes (i.e. the next seven days).

I can convert and rename as before.

Come back next time for more ways to use Power Query!

