
Power Query: Timings
30 December 2020
Welcome to our Power Query blog. This week, I look at an example where I need to sum time.
My imaginary salespeople have been having problems with a supplier. This has taken a lot of time and effort by several salespeople, and I need to work out the cost to the company. I need to know what days they worked, and for how long. I also need to know the total time each salesperson has spent on this supplier.
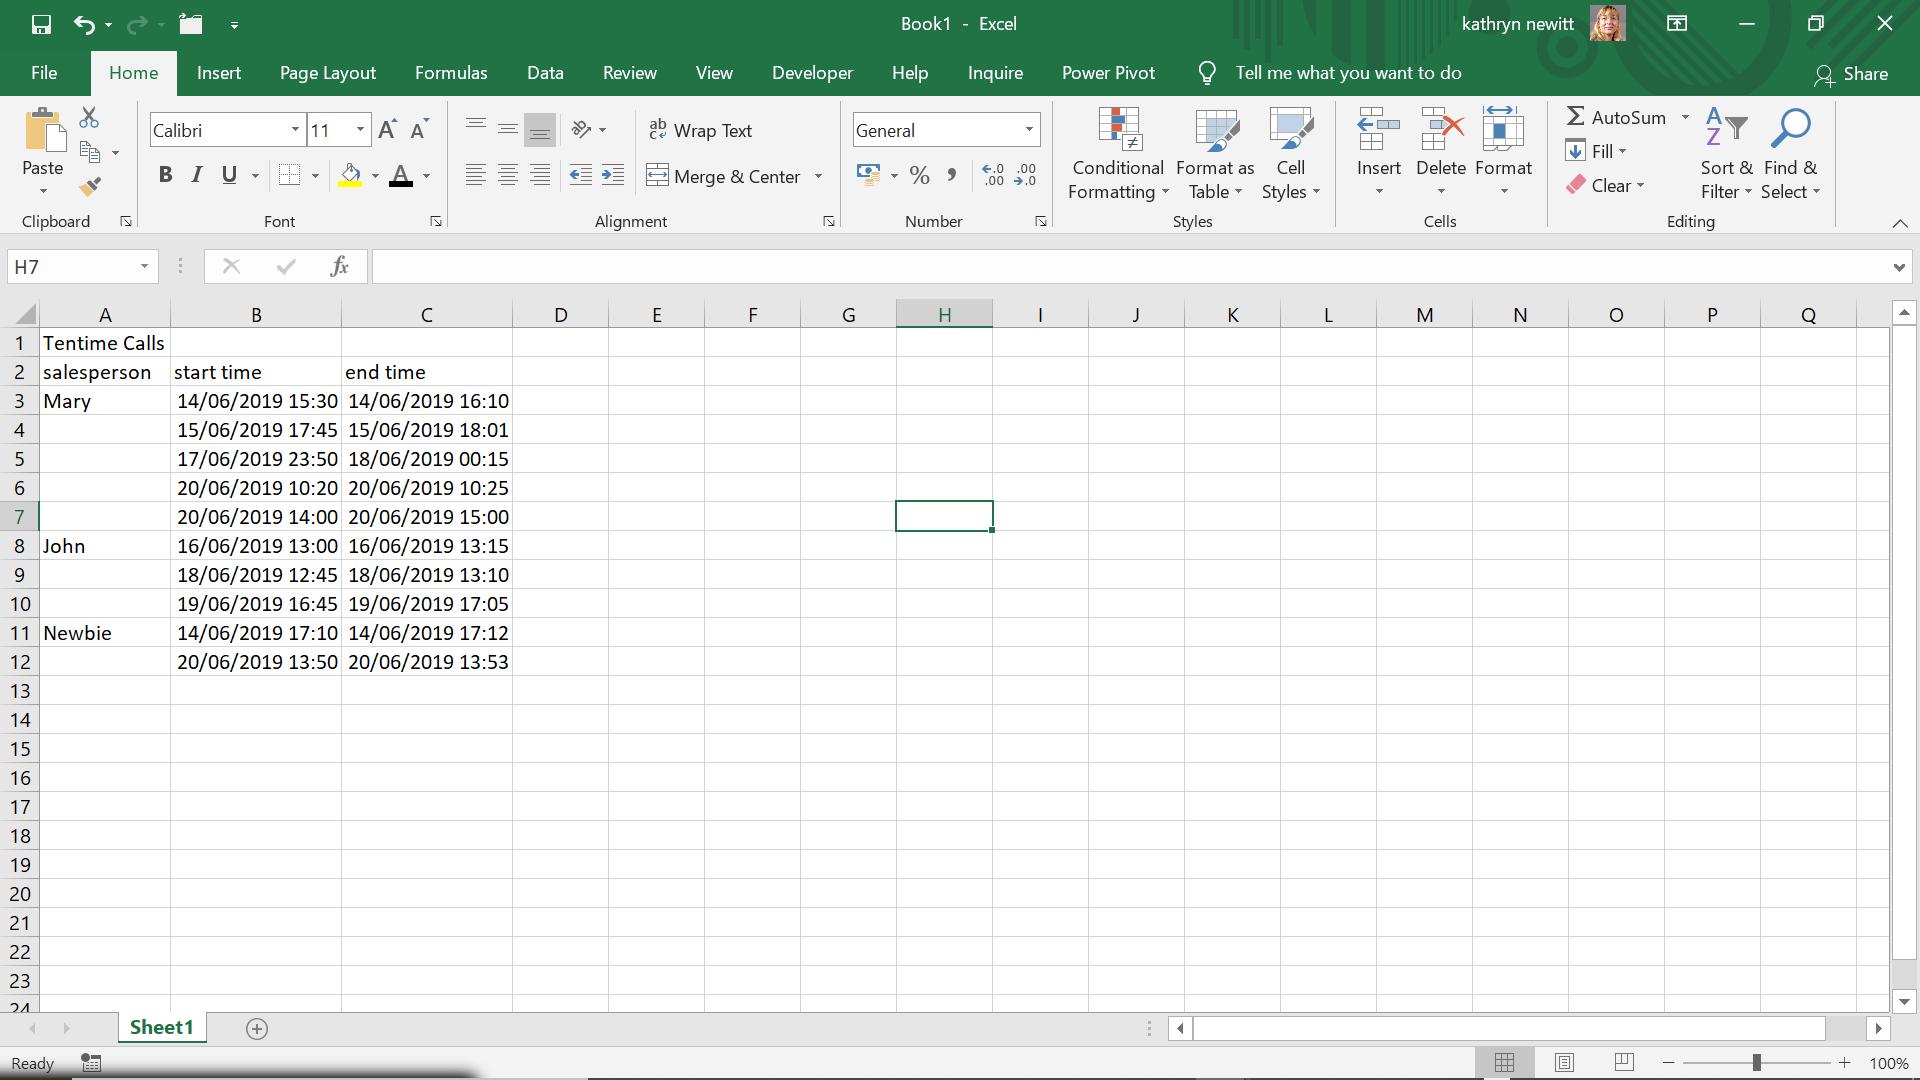
I start by uploading my data to Power Query by using ‘From Table’ on the ‘Get & Transform’ section of the Data tab.
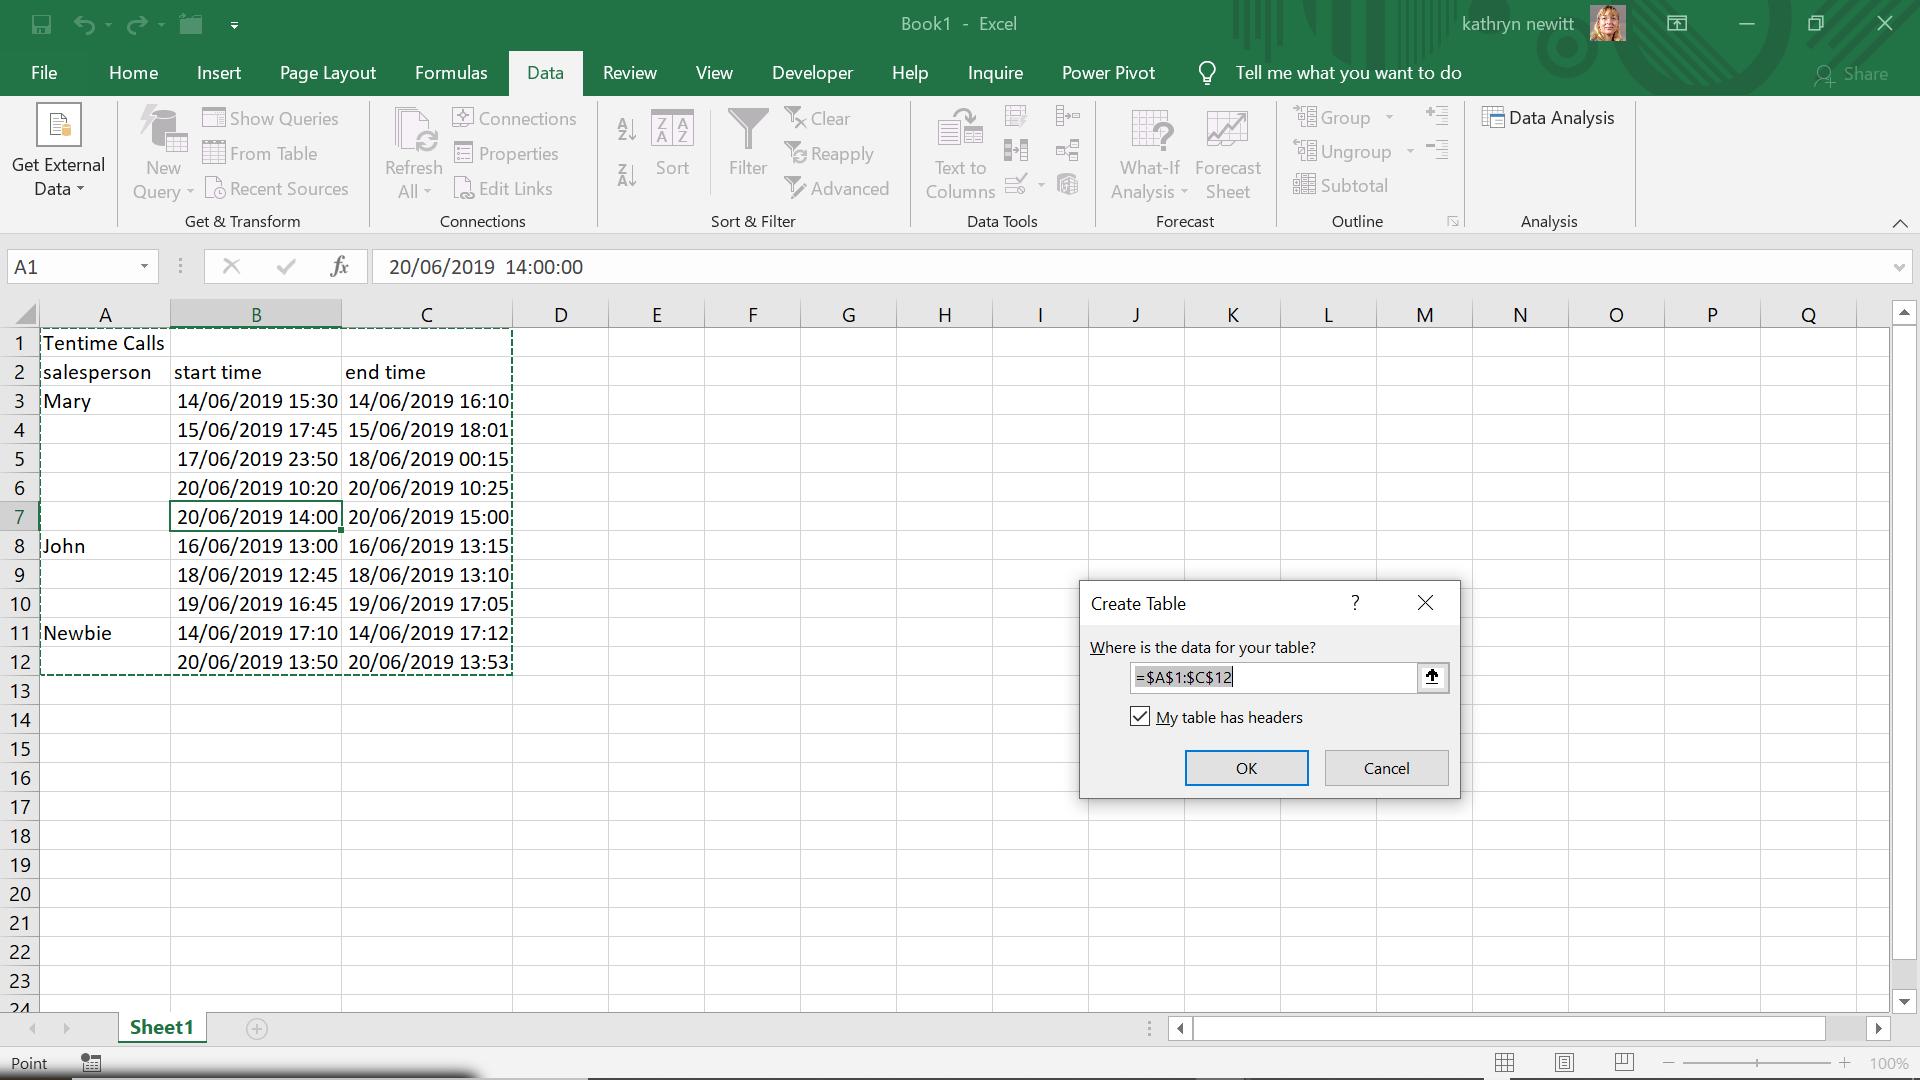
I don’t want to take the whole default area, I want to start from cell A2, so I adjust the range.
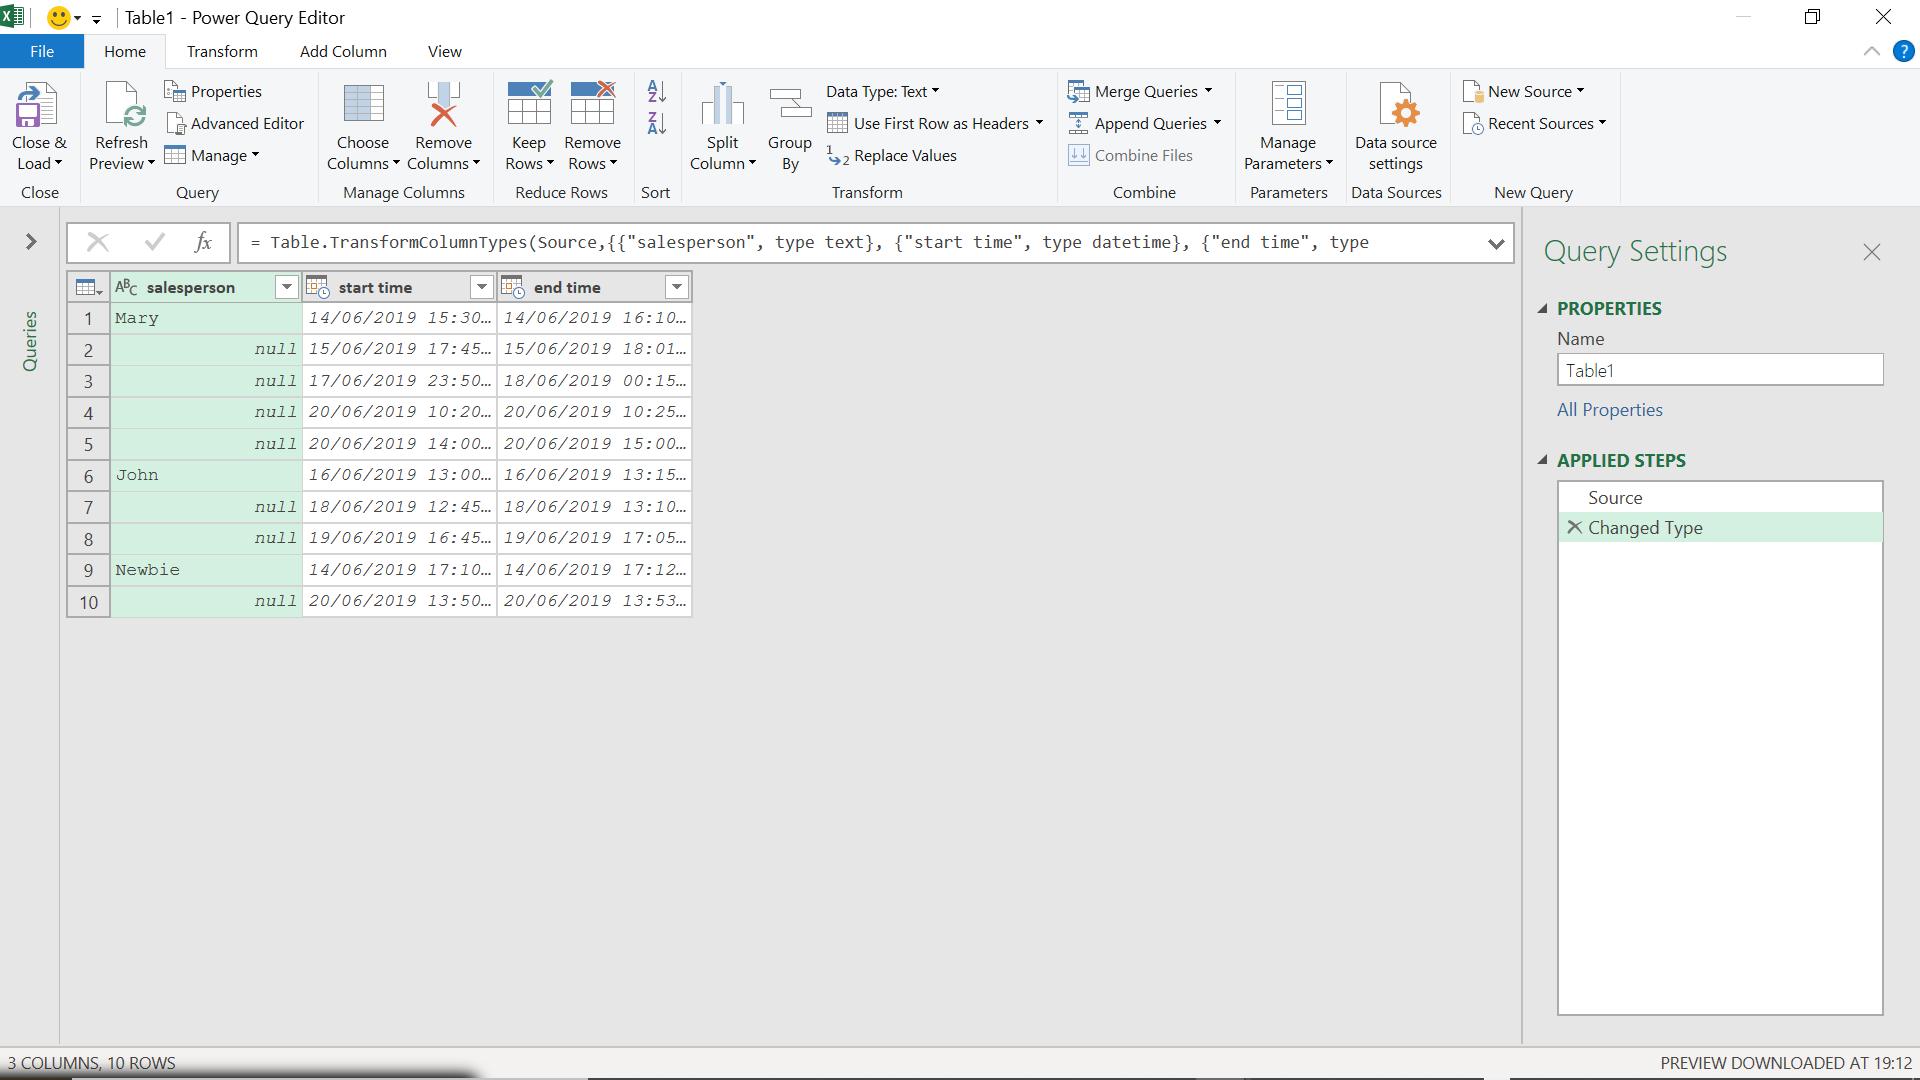
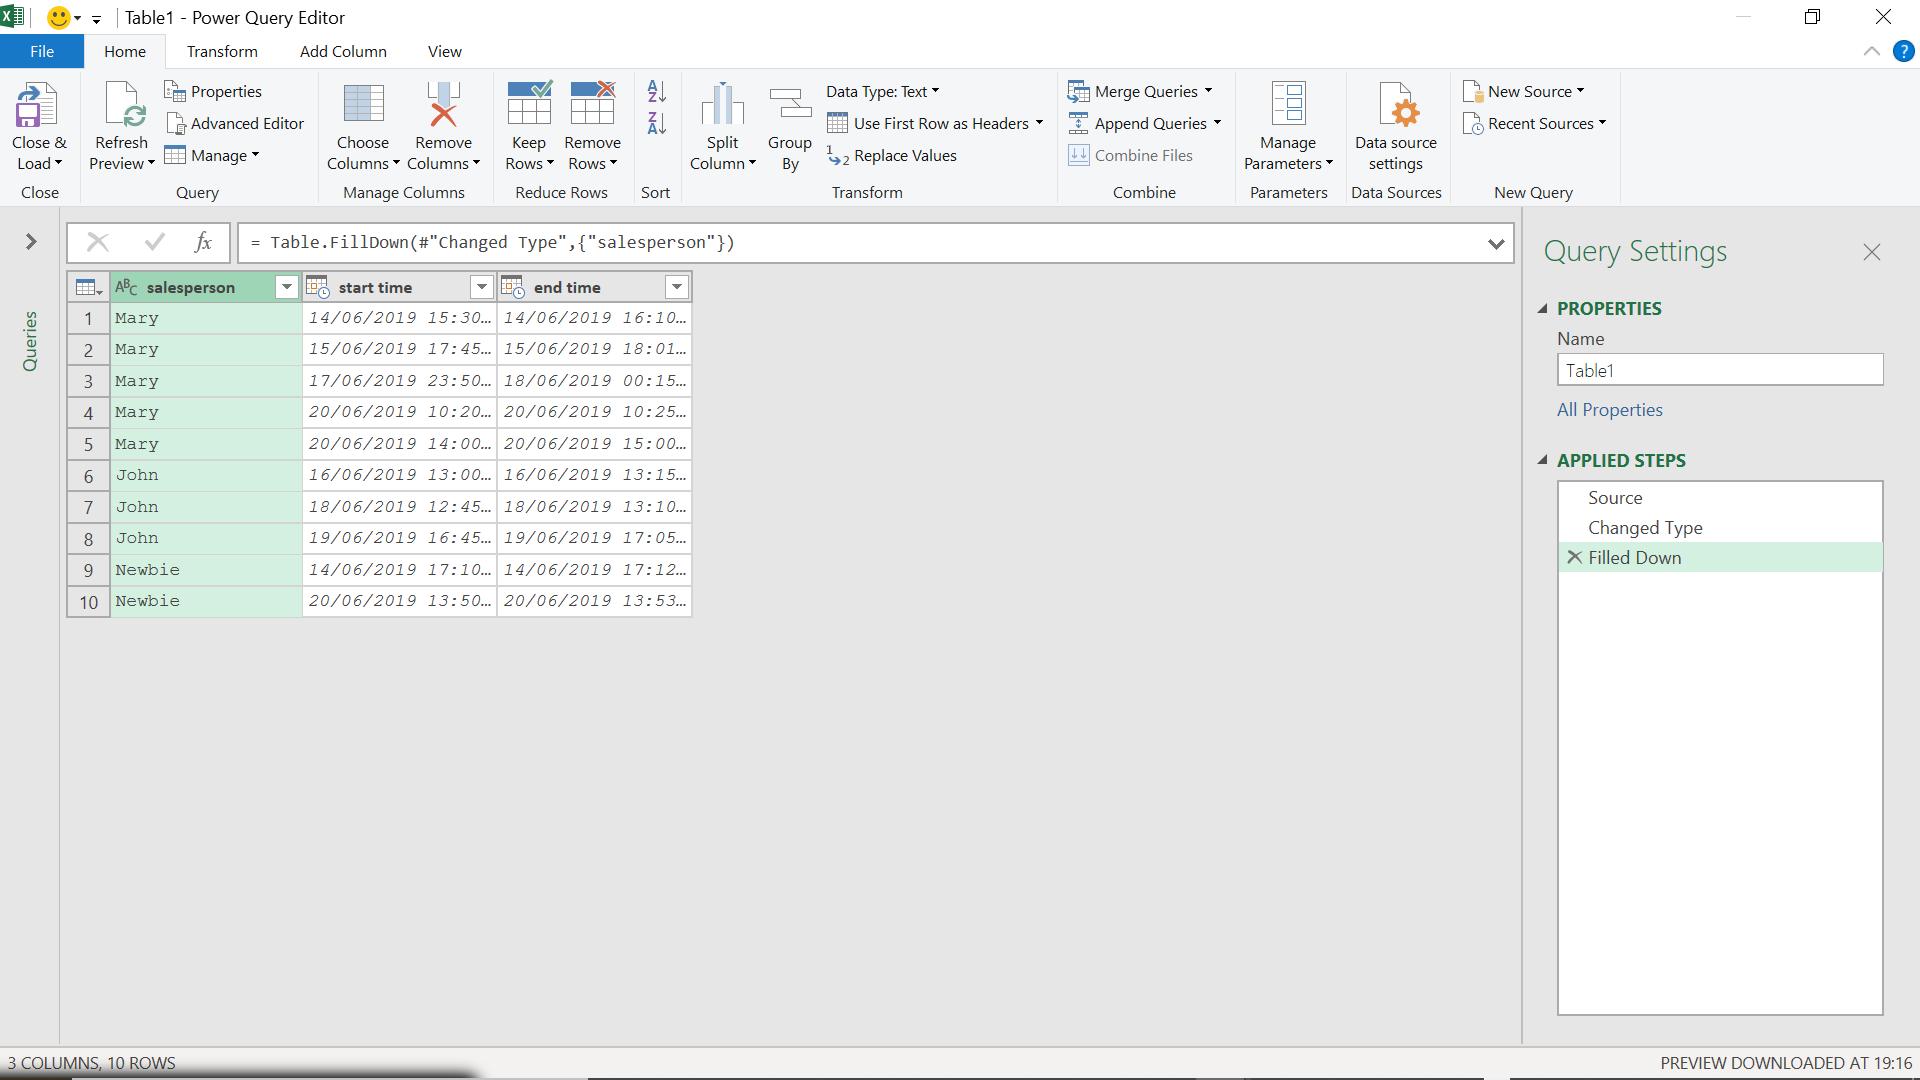
I start by filling the salesperson name, by selecting salesperson, right-clicking and selecting Fill and then Down.
I want to add a new column, so I go to the ‘Add Column’ tab.
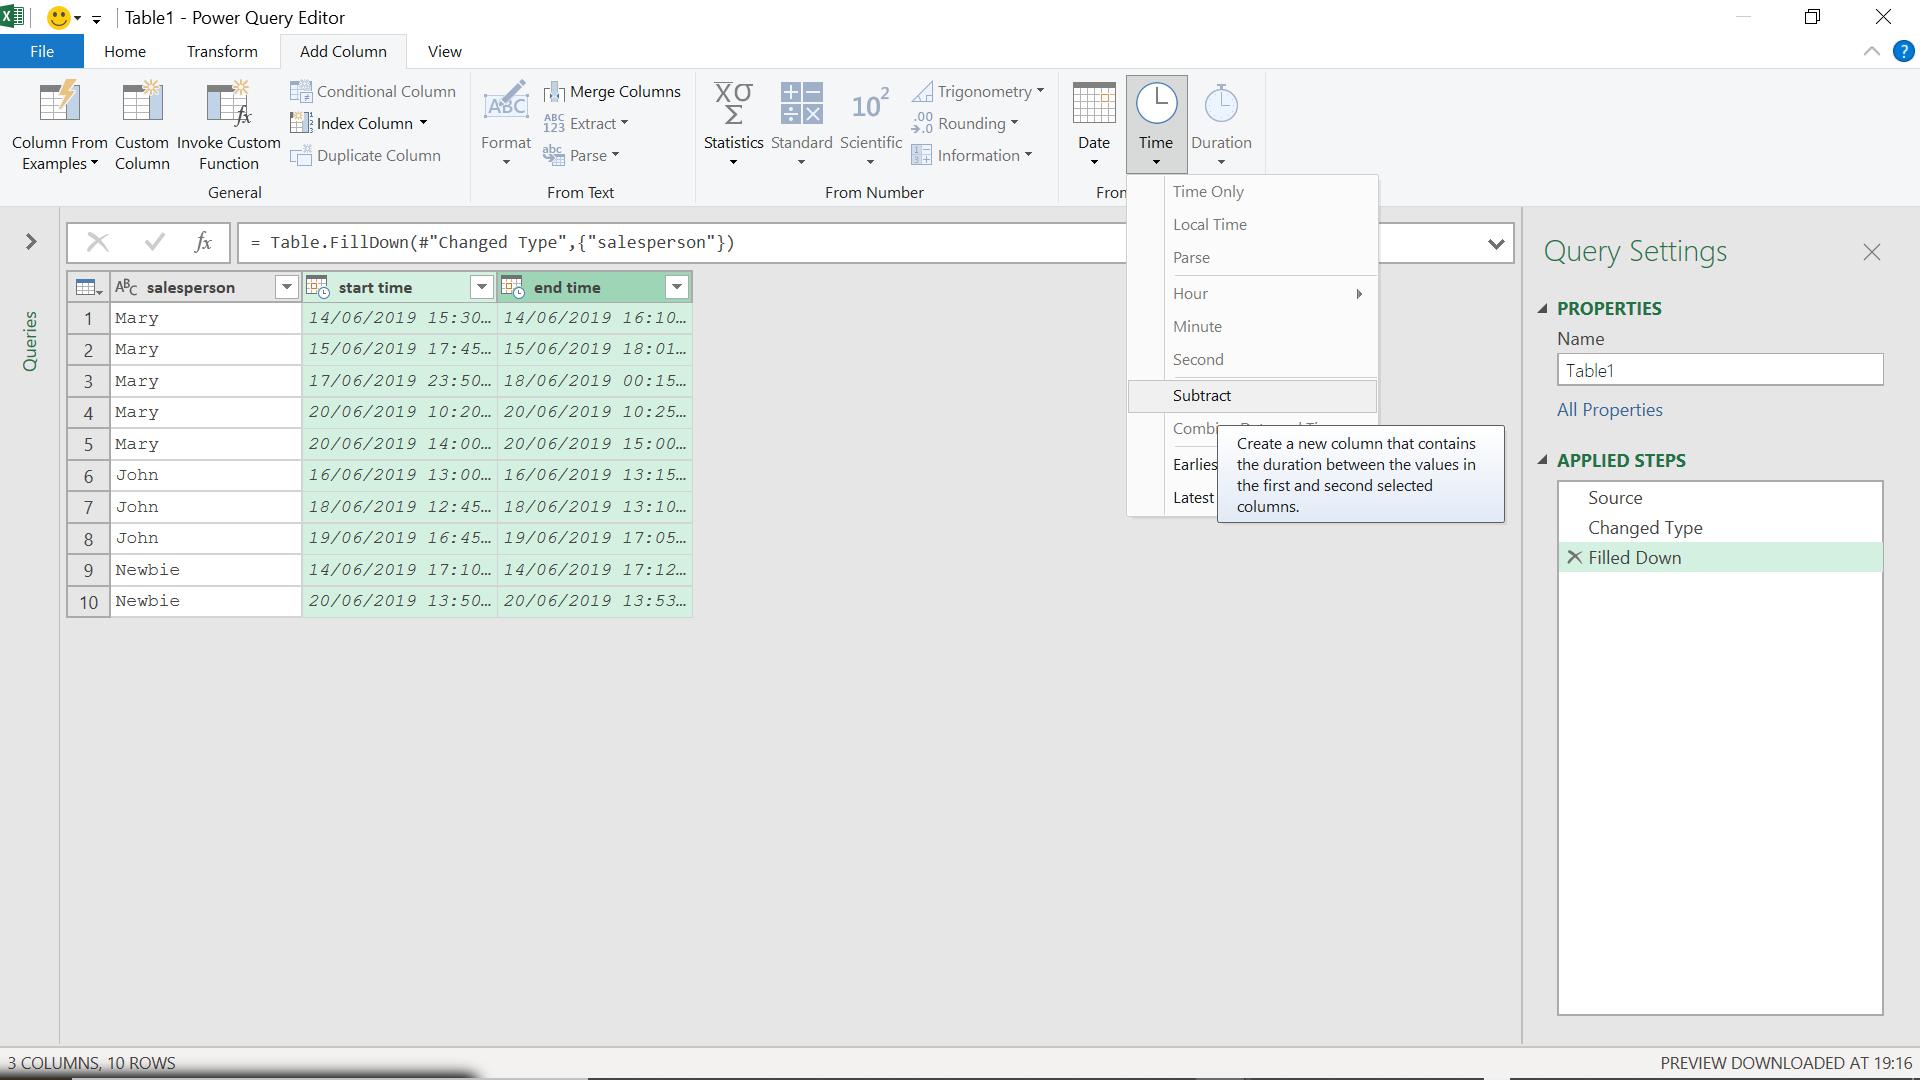
If I select both time columns, I have the option of creating a column which is the difference between my columns, using ‘Subtract’ on the ‘Time’ dropdown. I must select End Time before Start Time (keeping the CTRL key pressed down), to get positive results.
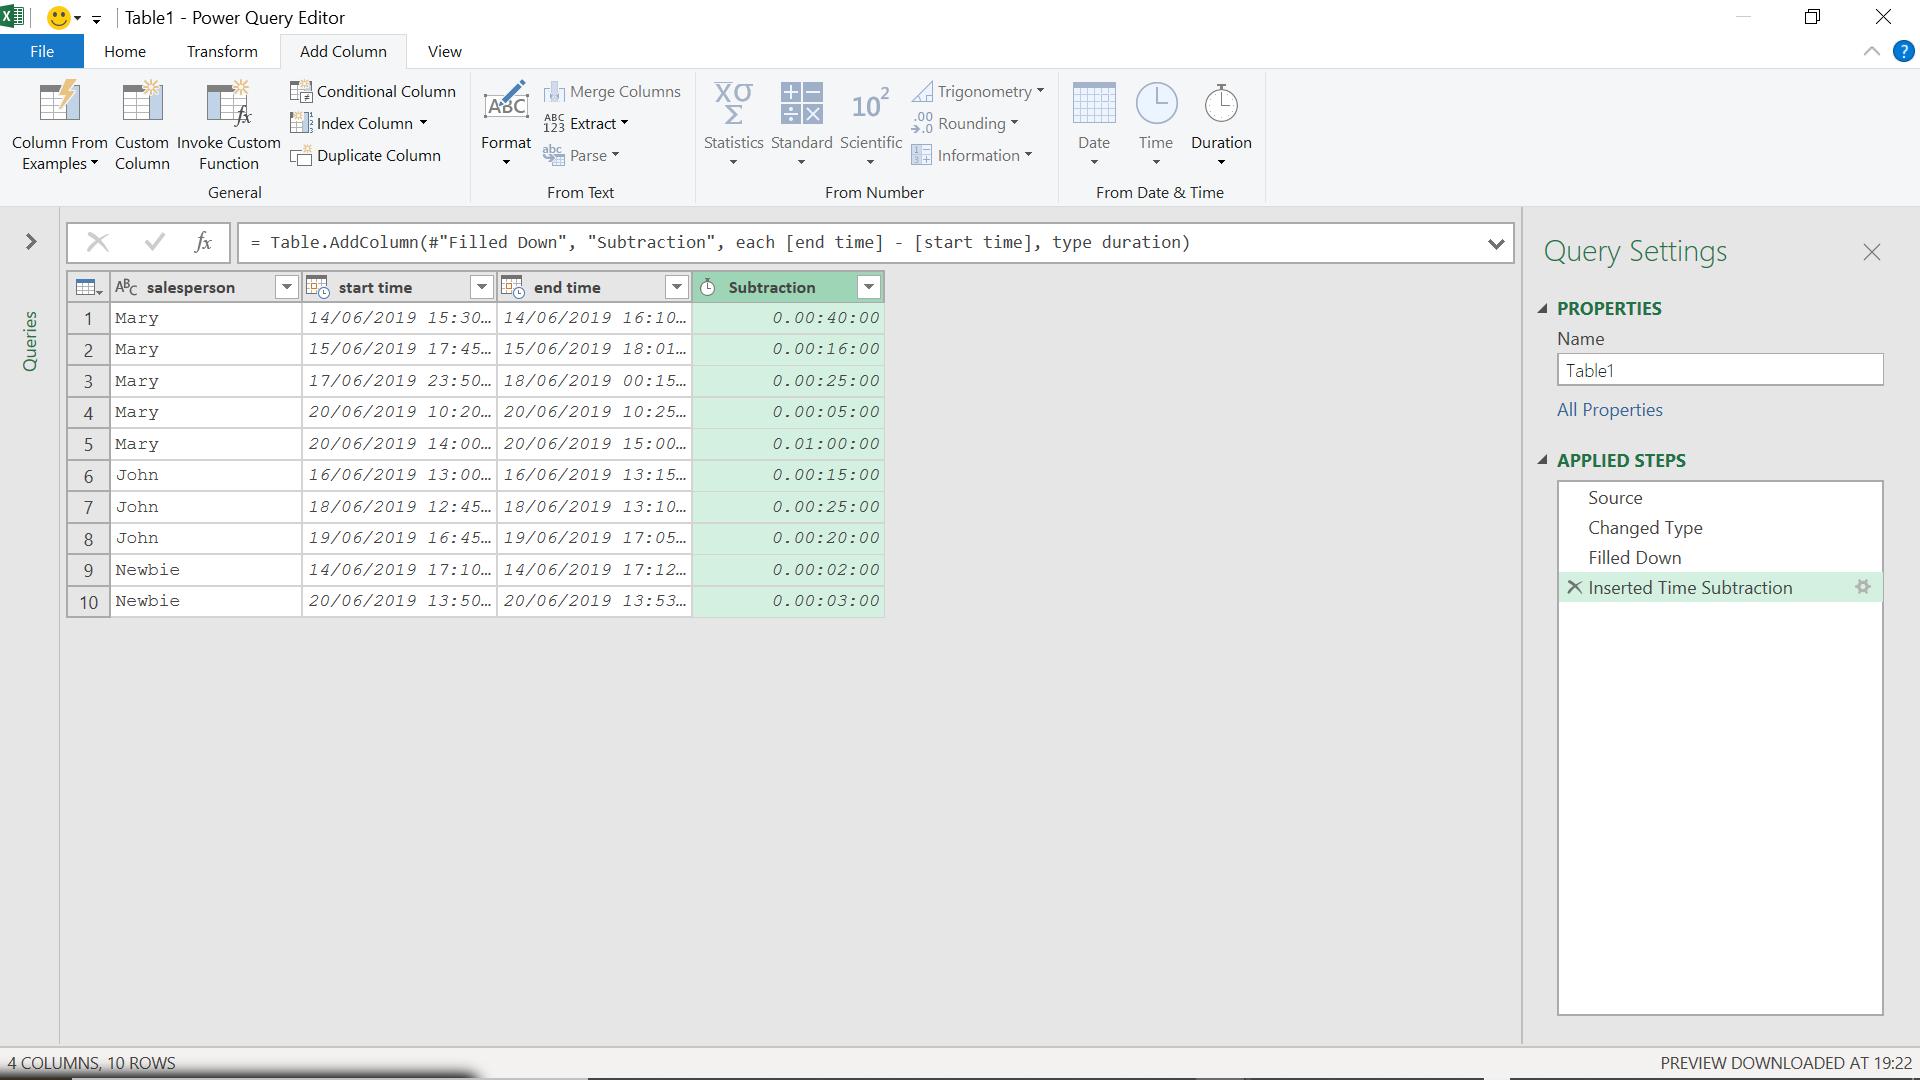
I can now see how much time each salesperson spent on the supplier in each interaction, but I want to view it more clearly, as a number of hours (which I can then subtotal). I am going to add a duration column.
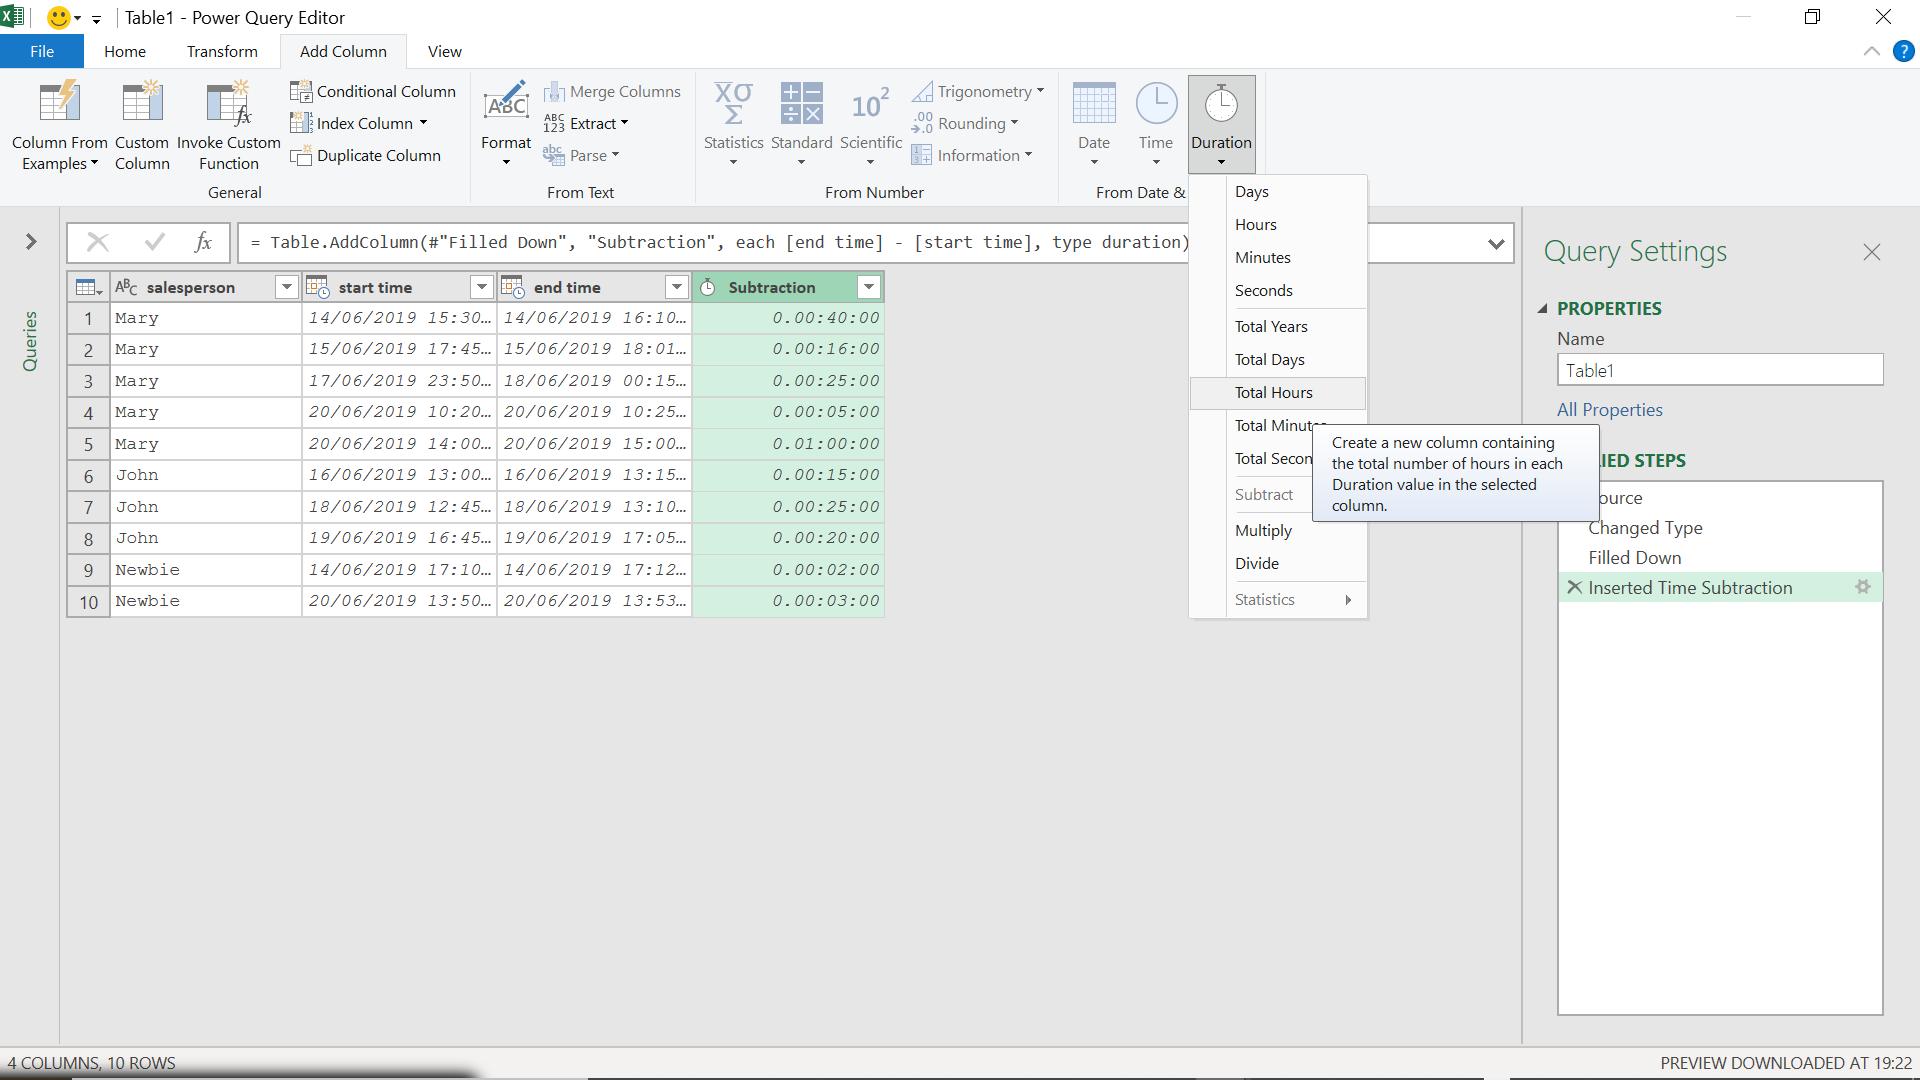
I choose ‘Total Hours’.
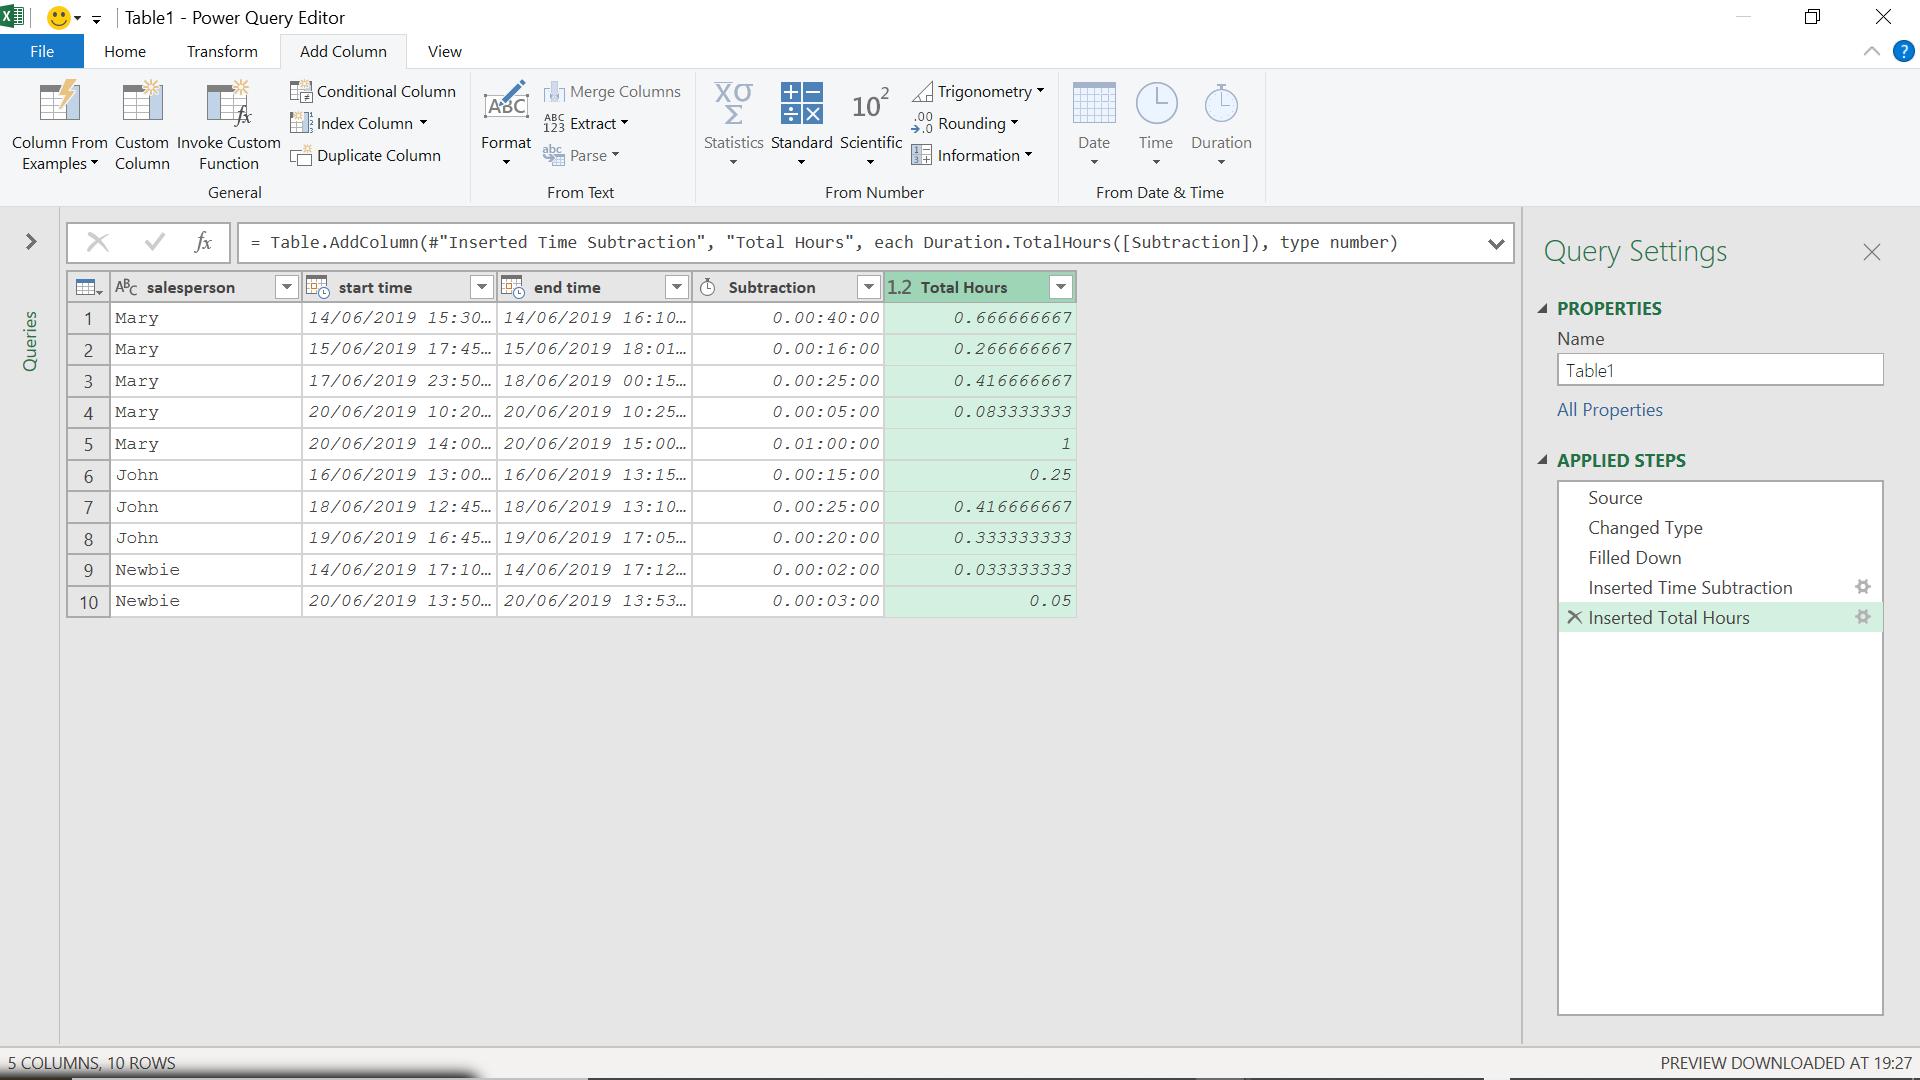
This is clearer, but there are too many decimal places. I am only interested in two (2), so I transform the column using the Transform tab.
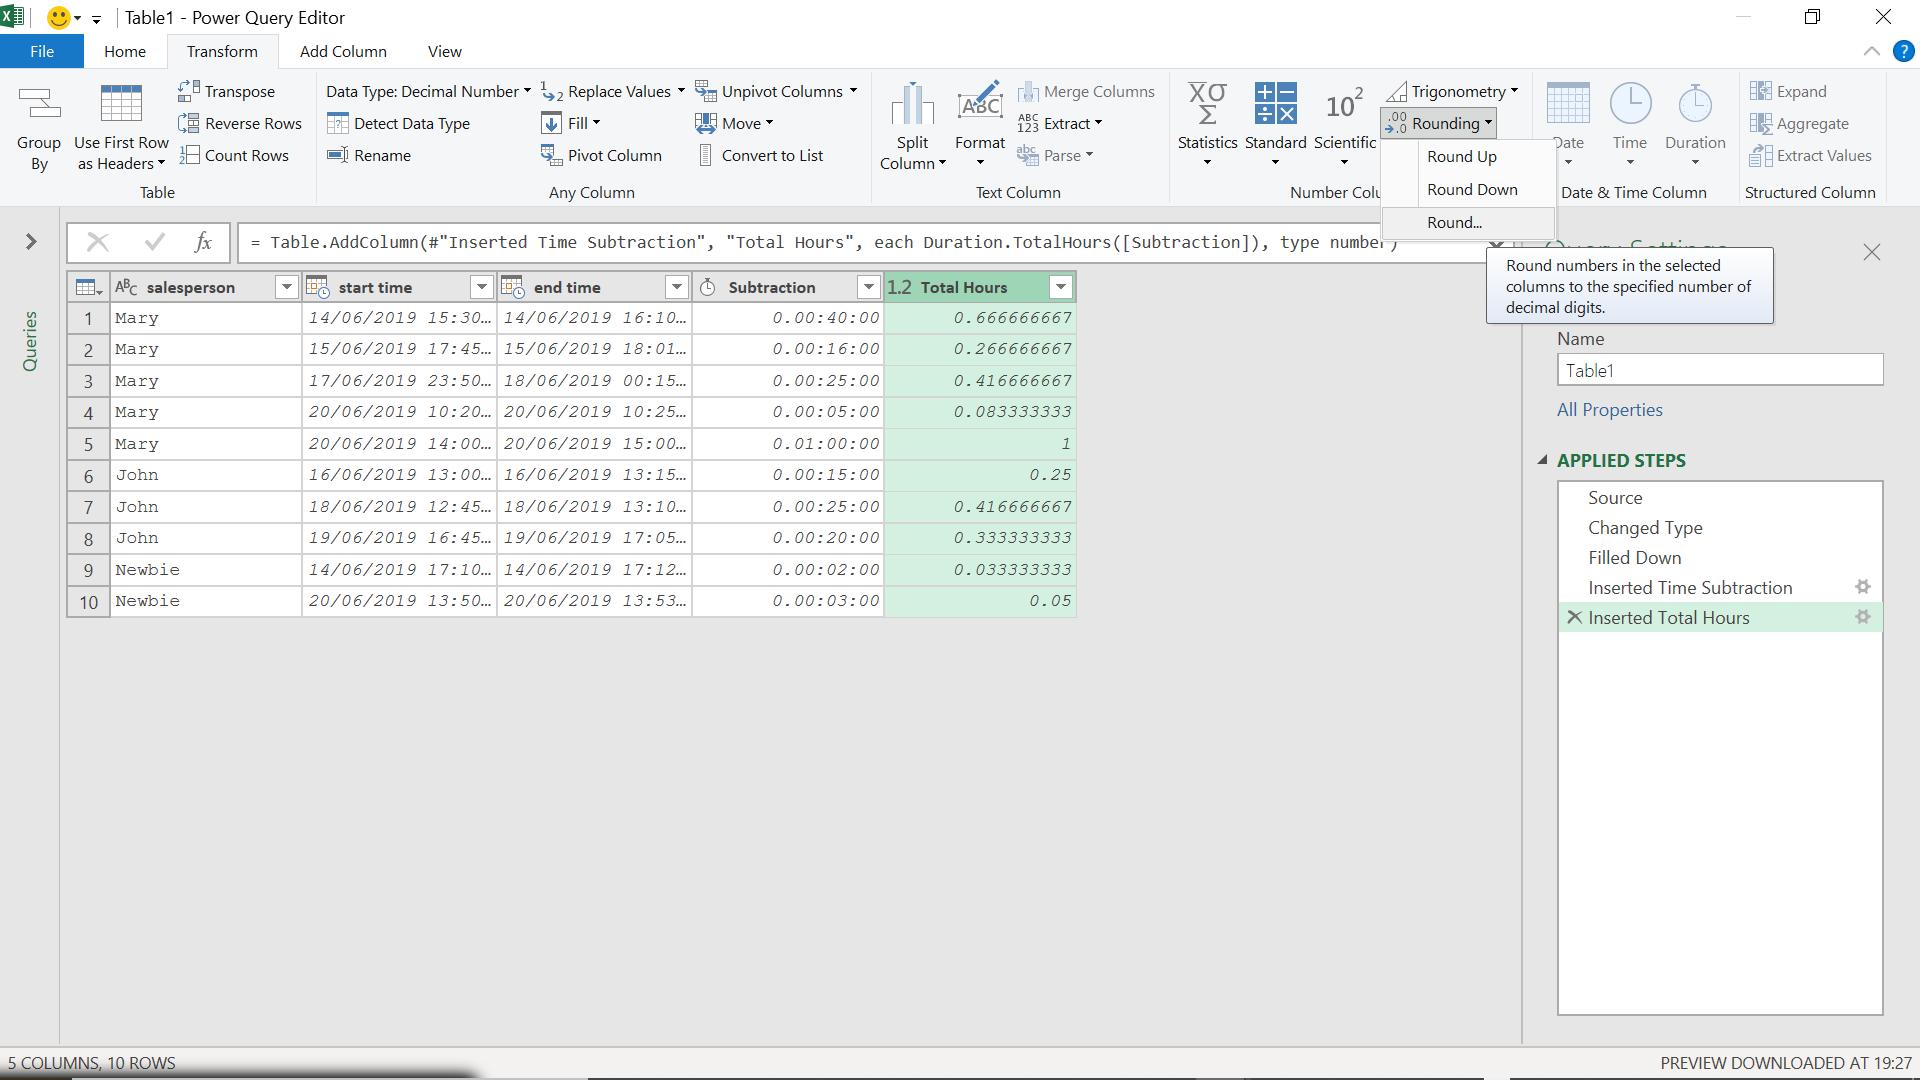
I choose to round my data.
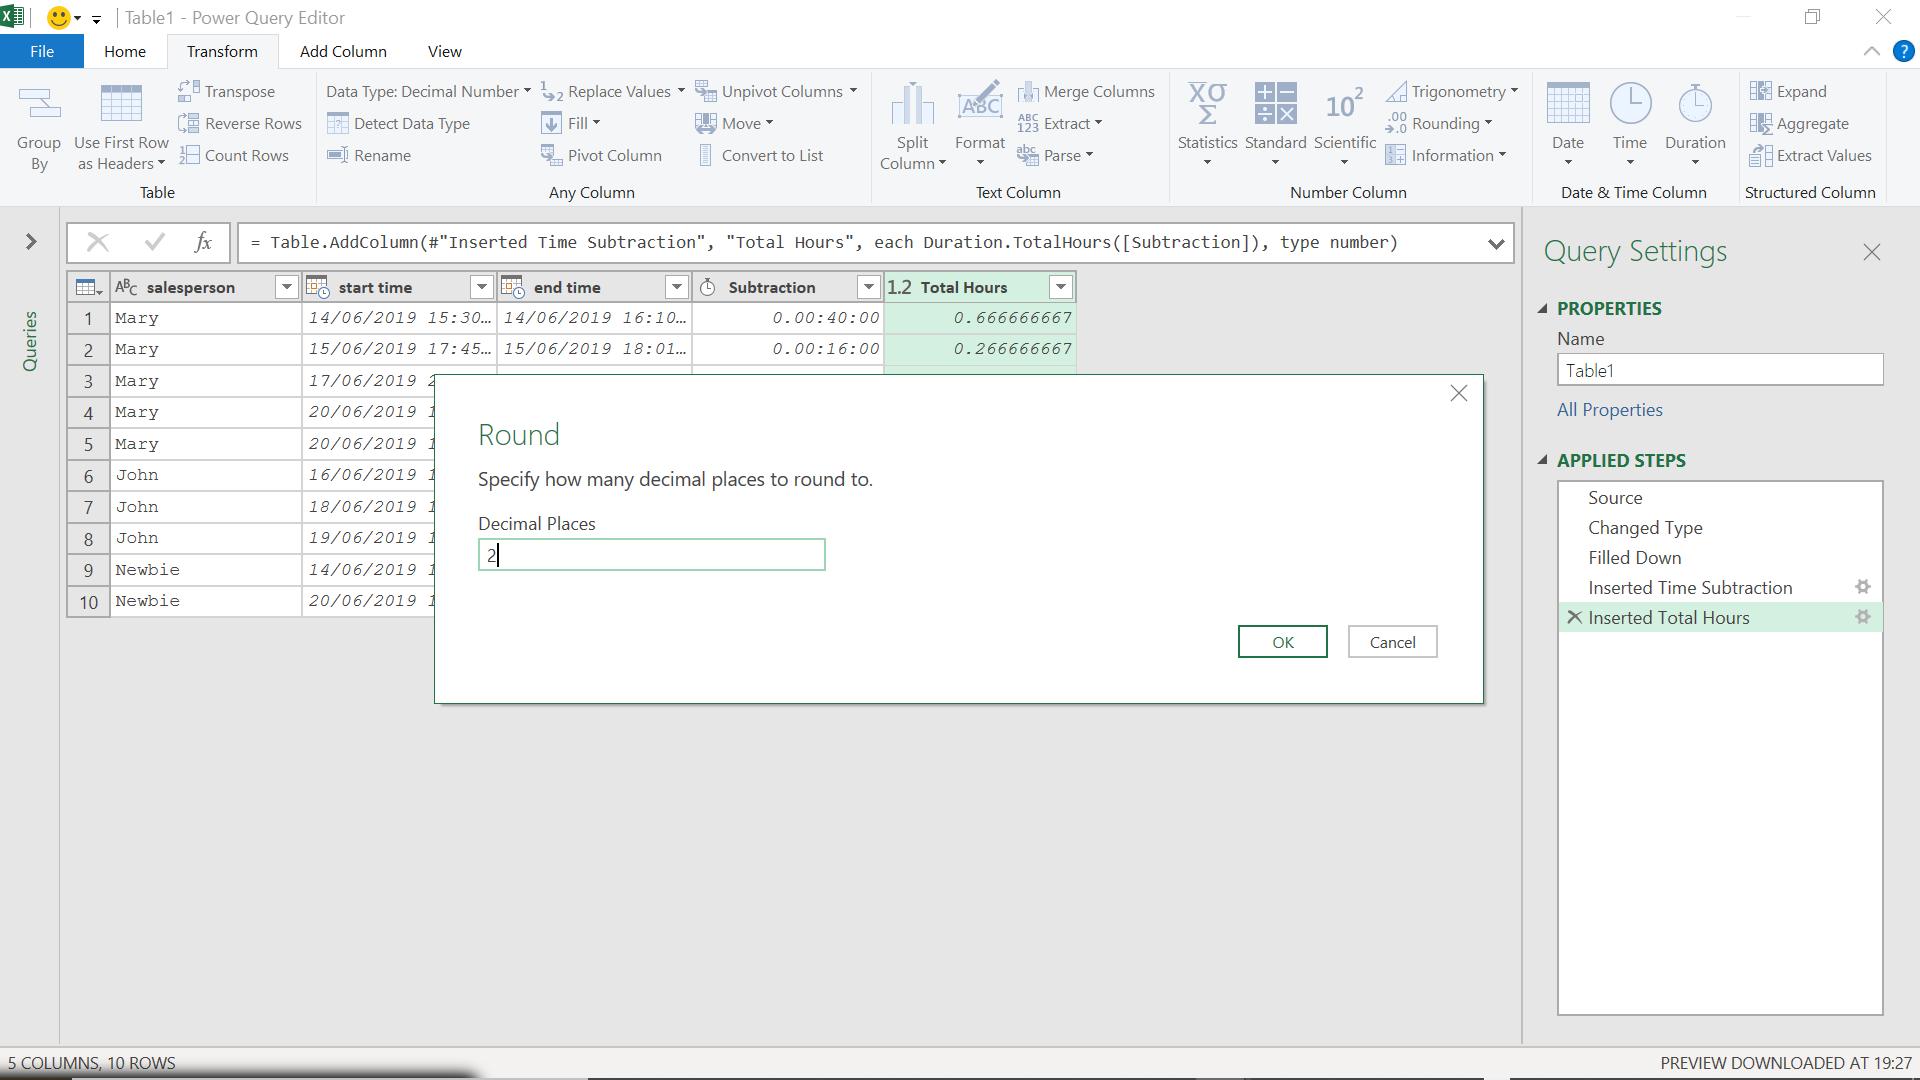
I can specify the number of decimal places.
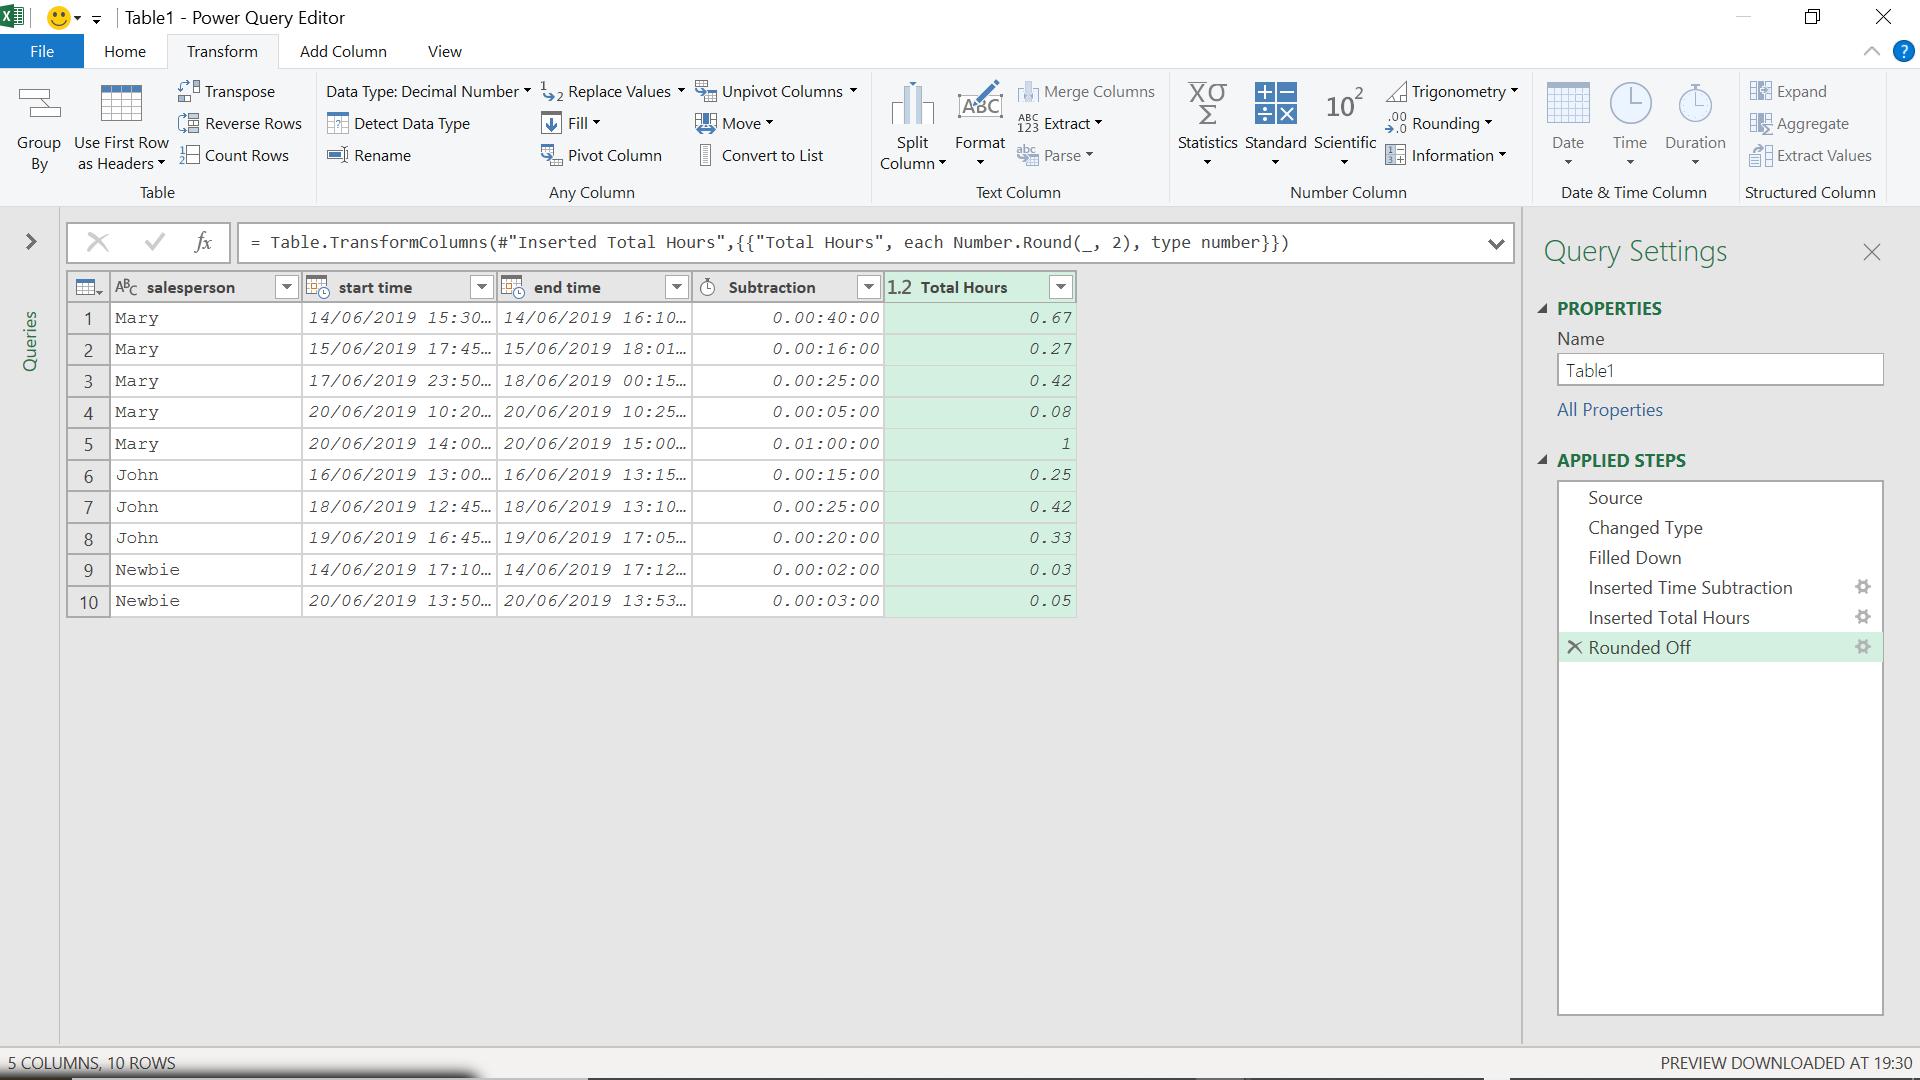
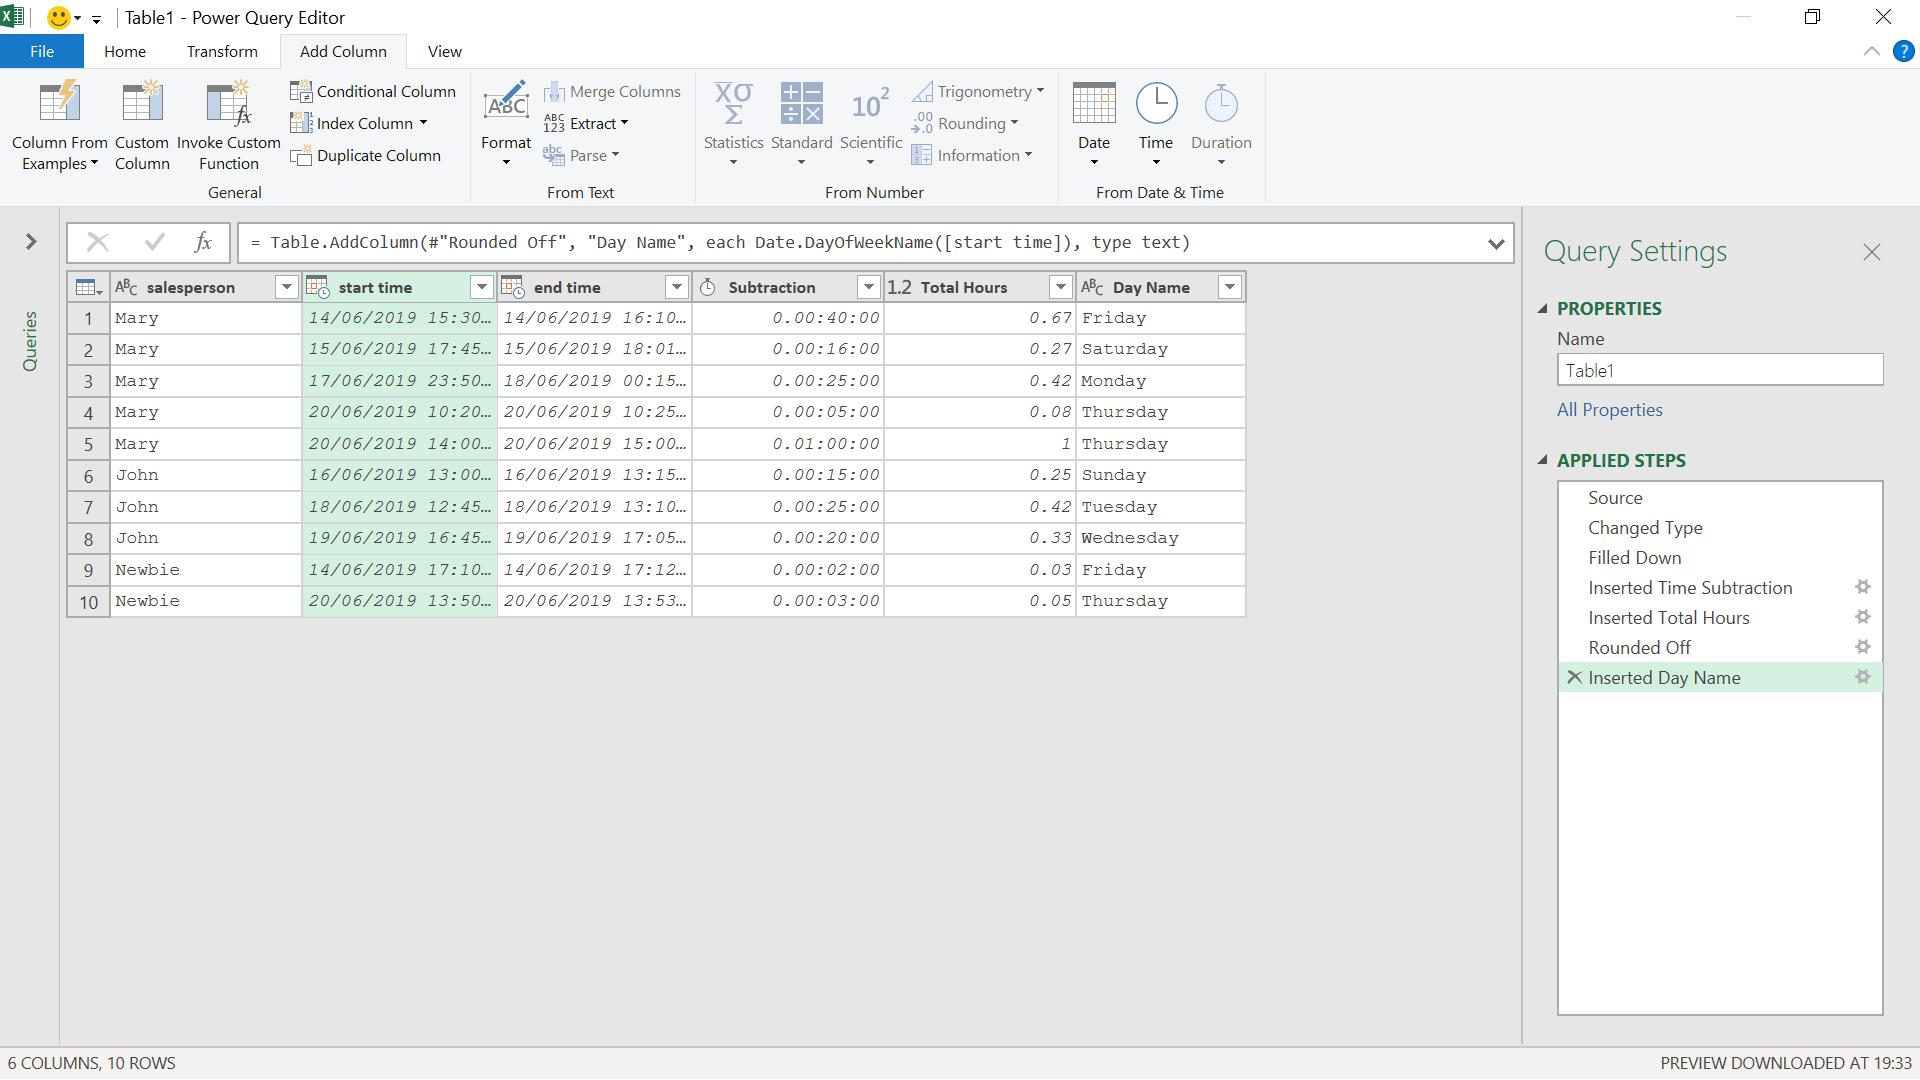
This is now much easier to work with. I can also see when these interactions are taking place by adding a column from the ‘Add Column’ tab, which tells me what day of the week they started.
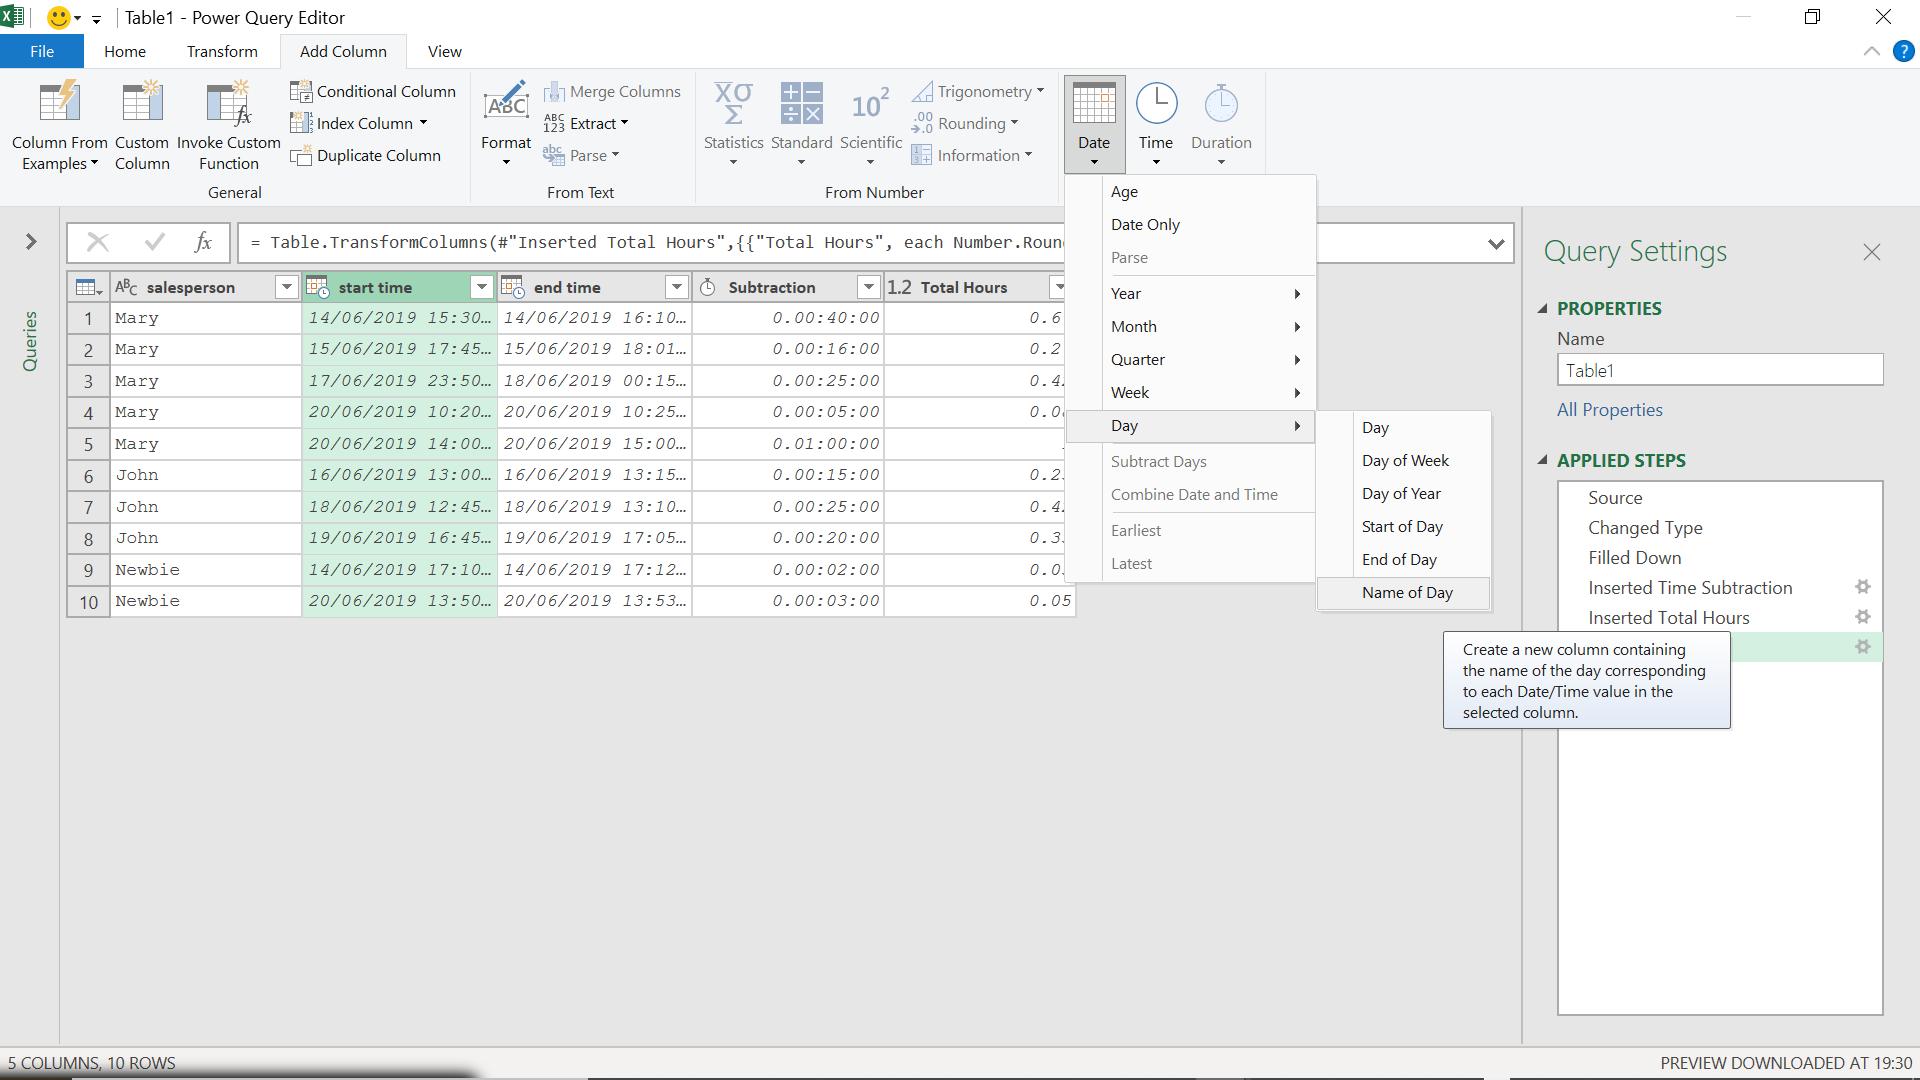
This will help me to see if any overtime has been involved.
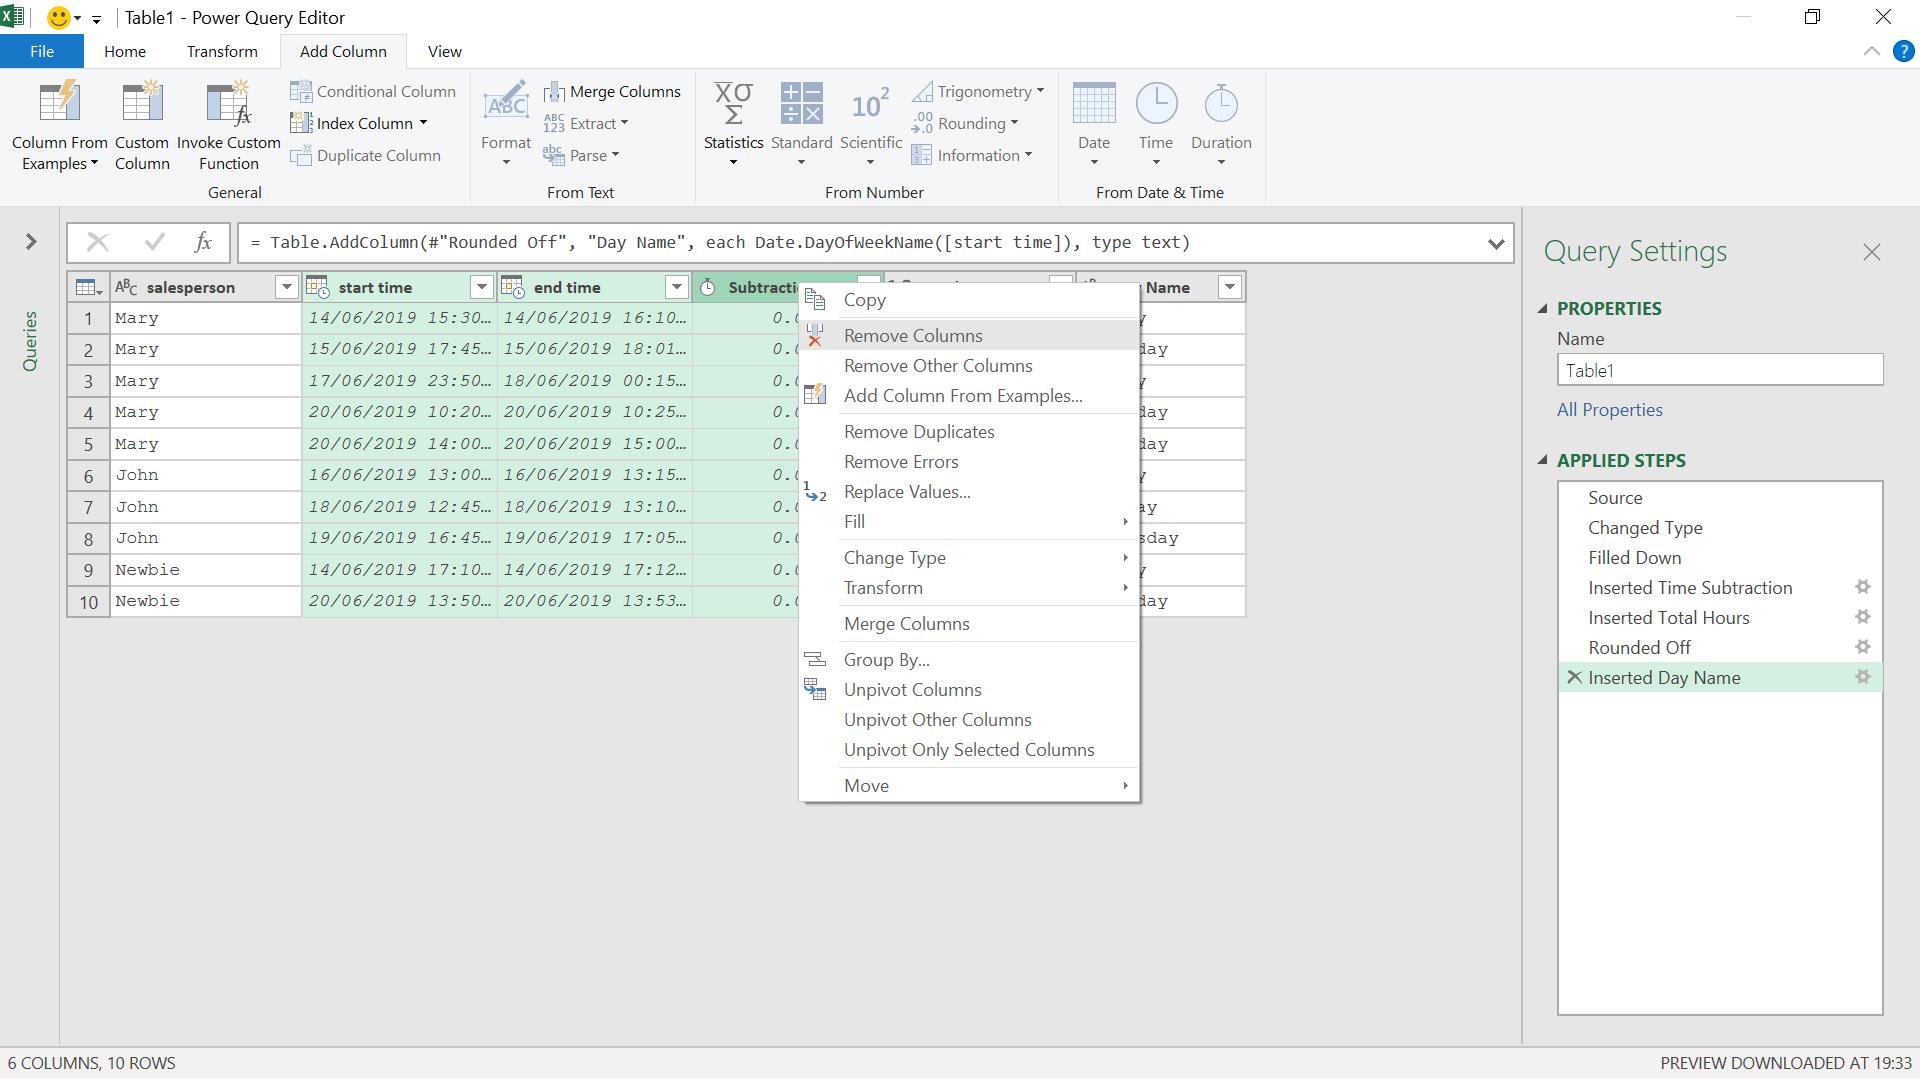
I can now remove the columns I don’t need by right-clicking on them and choosing Remove.
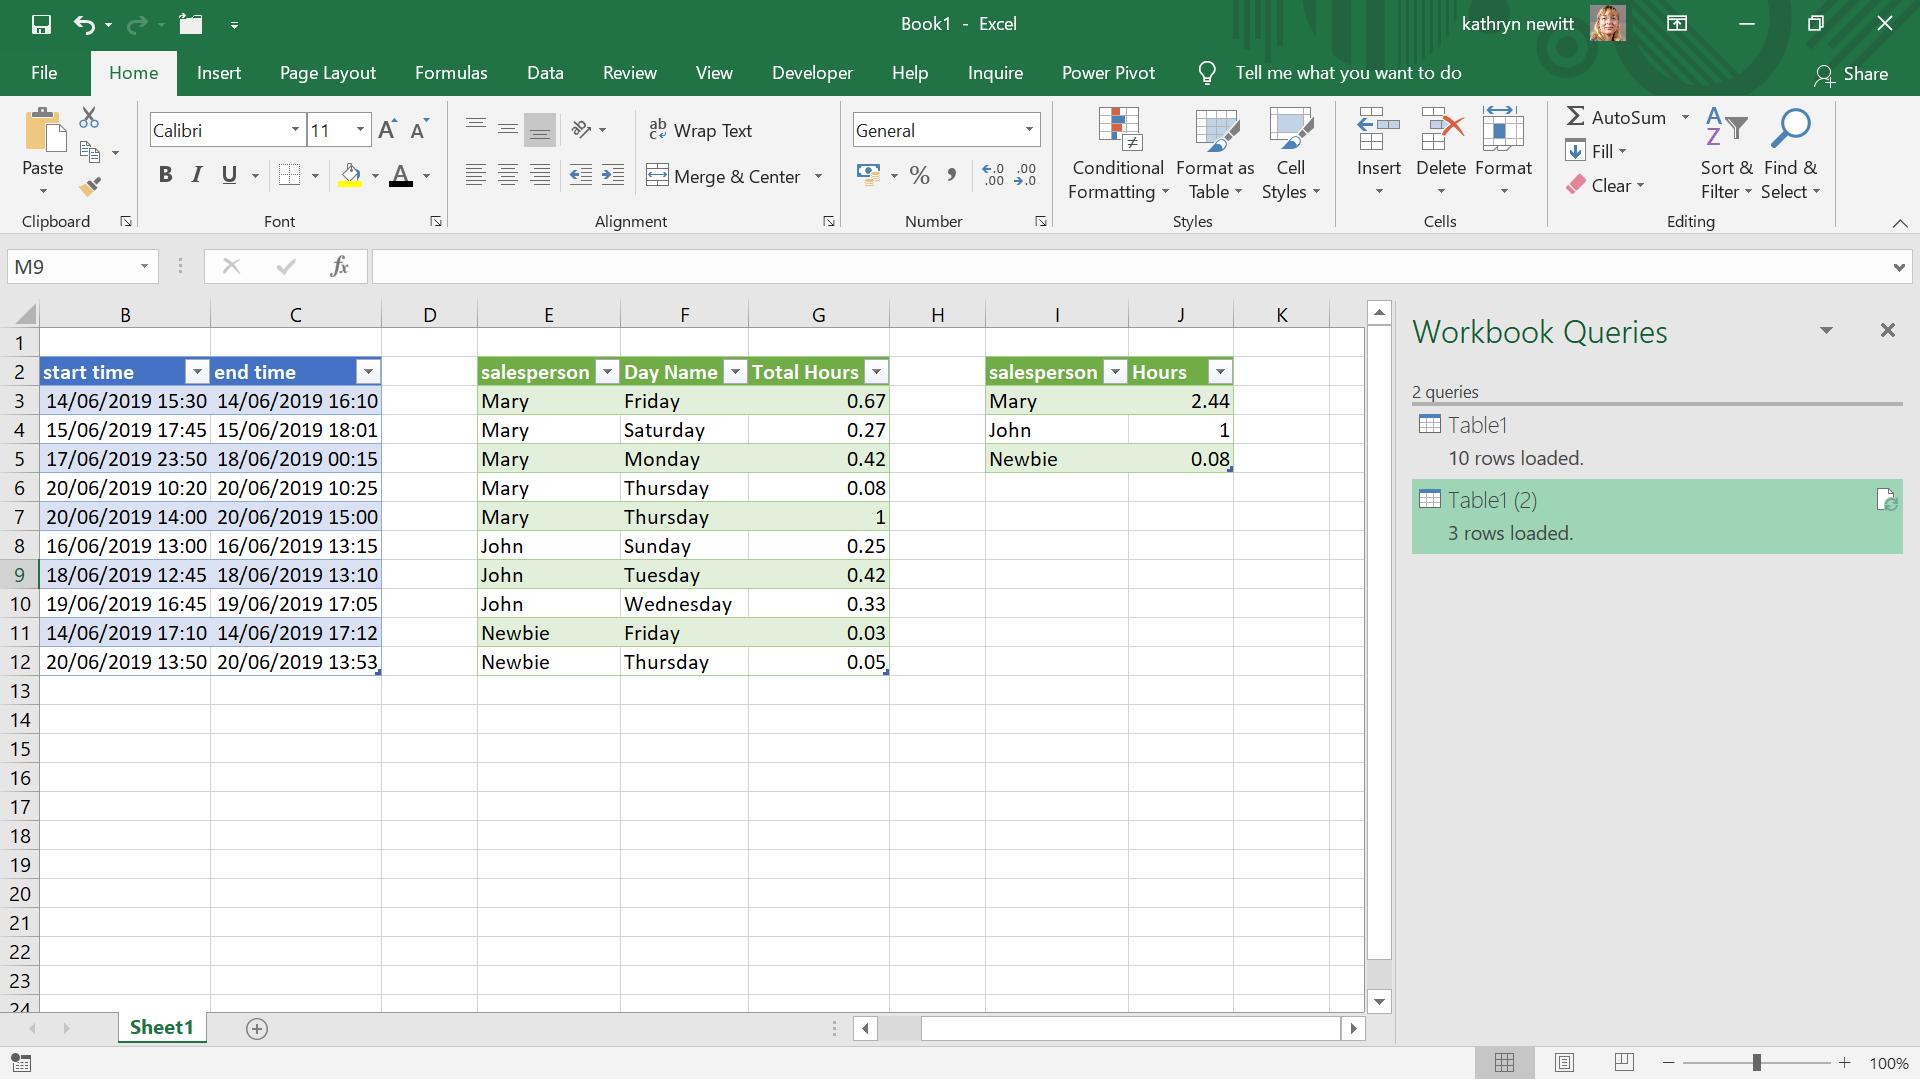
Once I have done this, I rearrange the columns to show the time each salesperson spent on each interaction. I ‘Close & Load’ my data to the Excel worksheet.
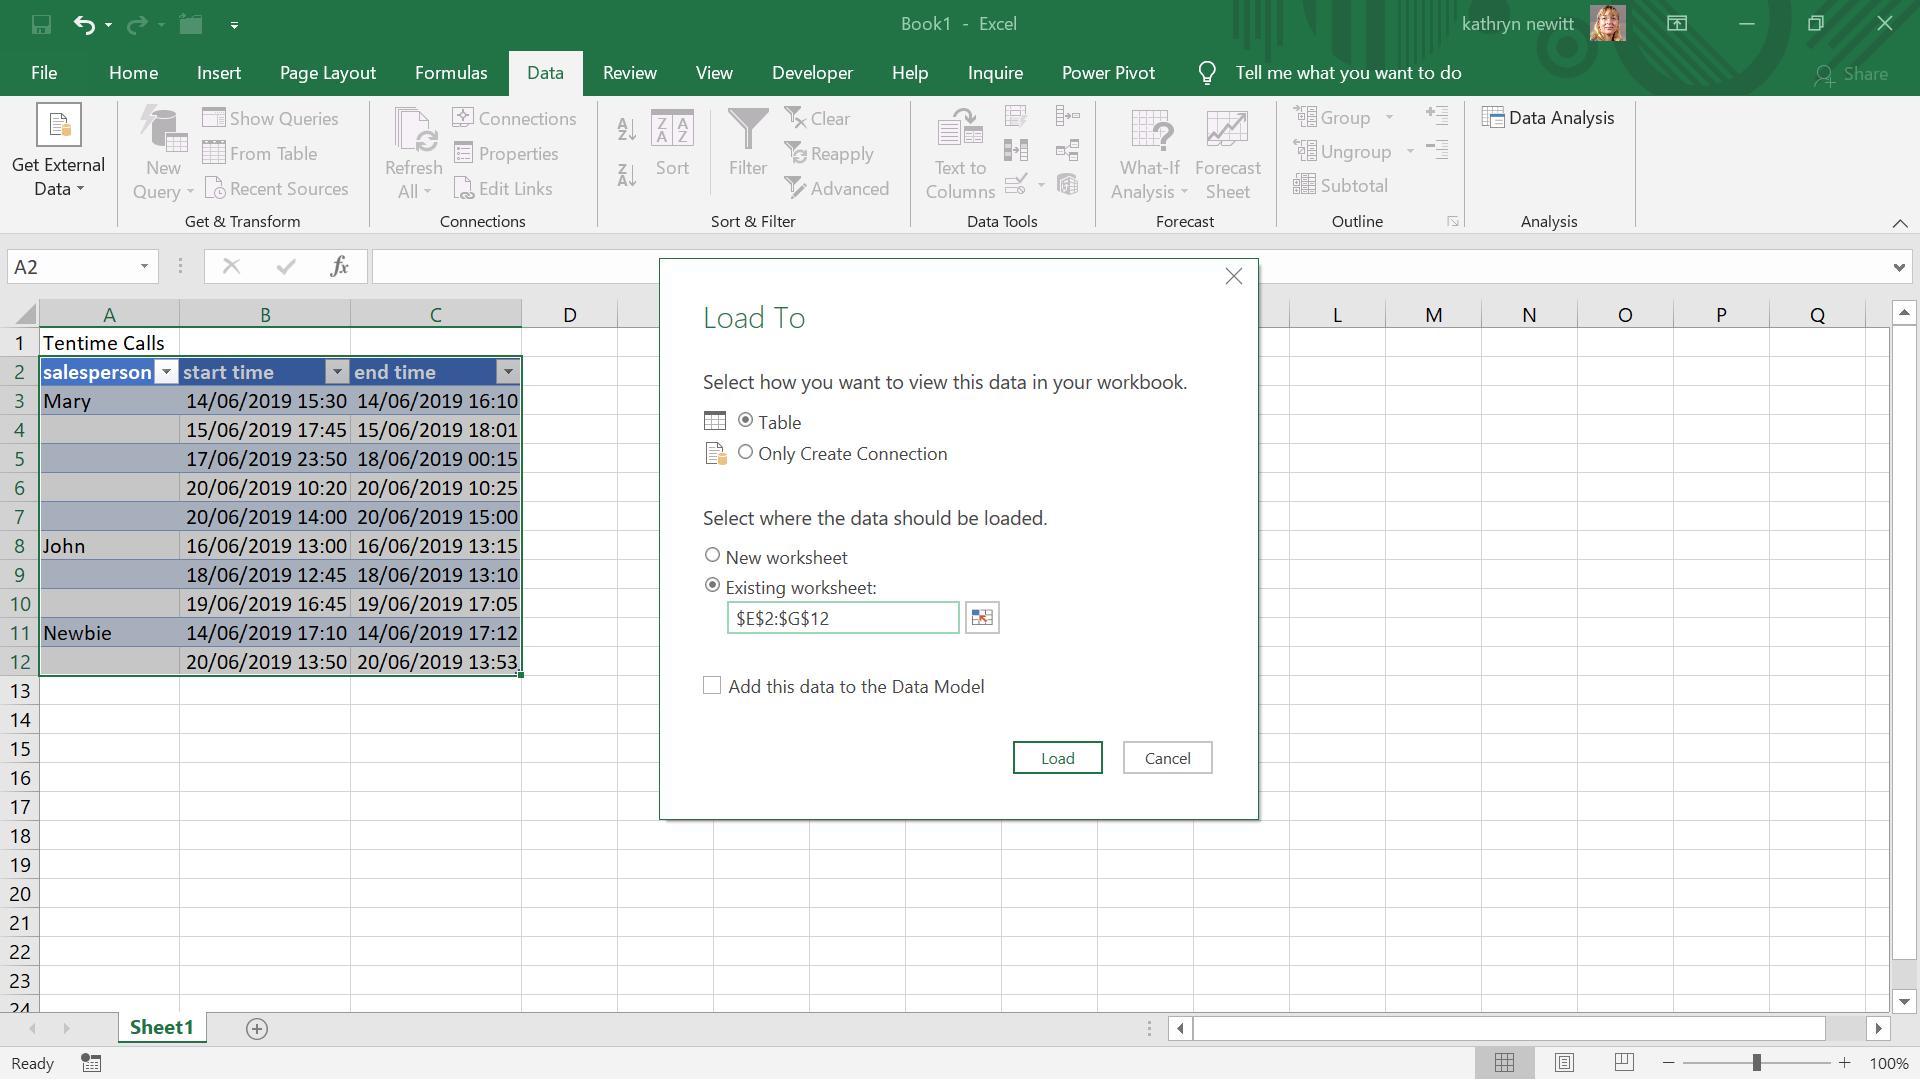
I place it next to the first table.
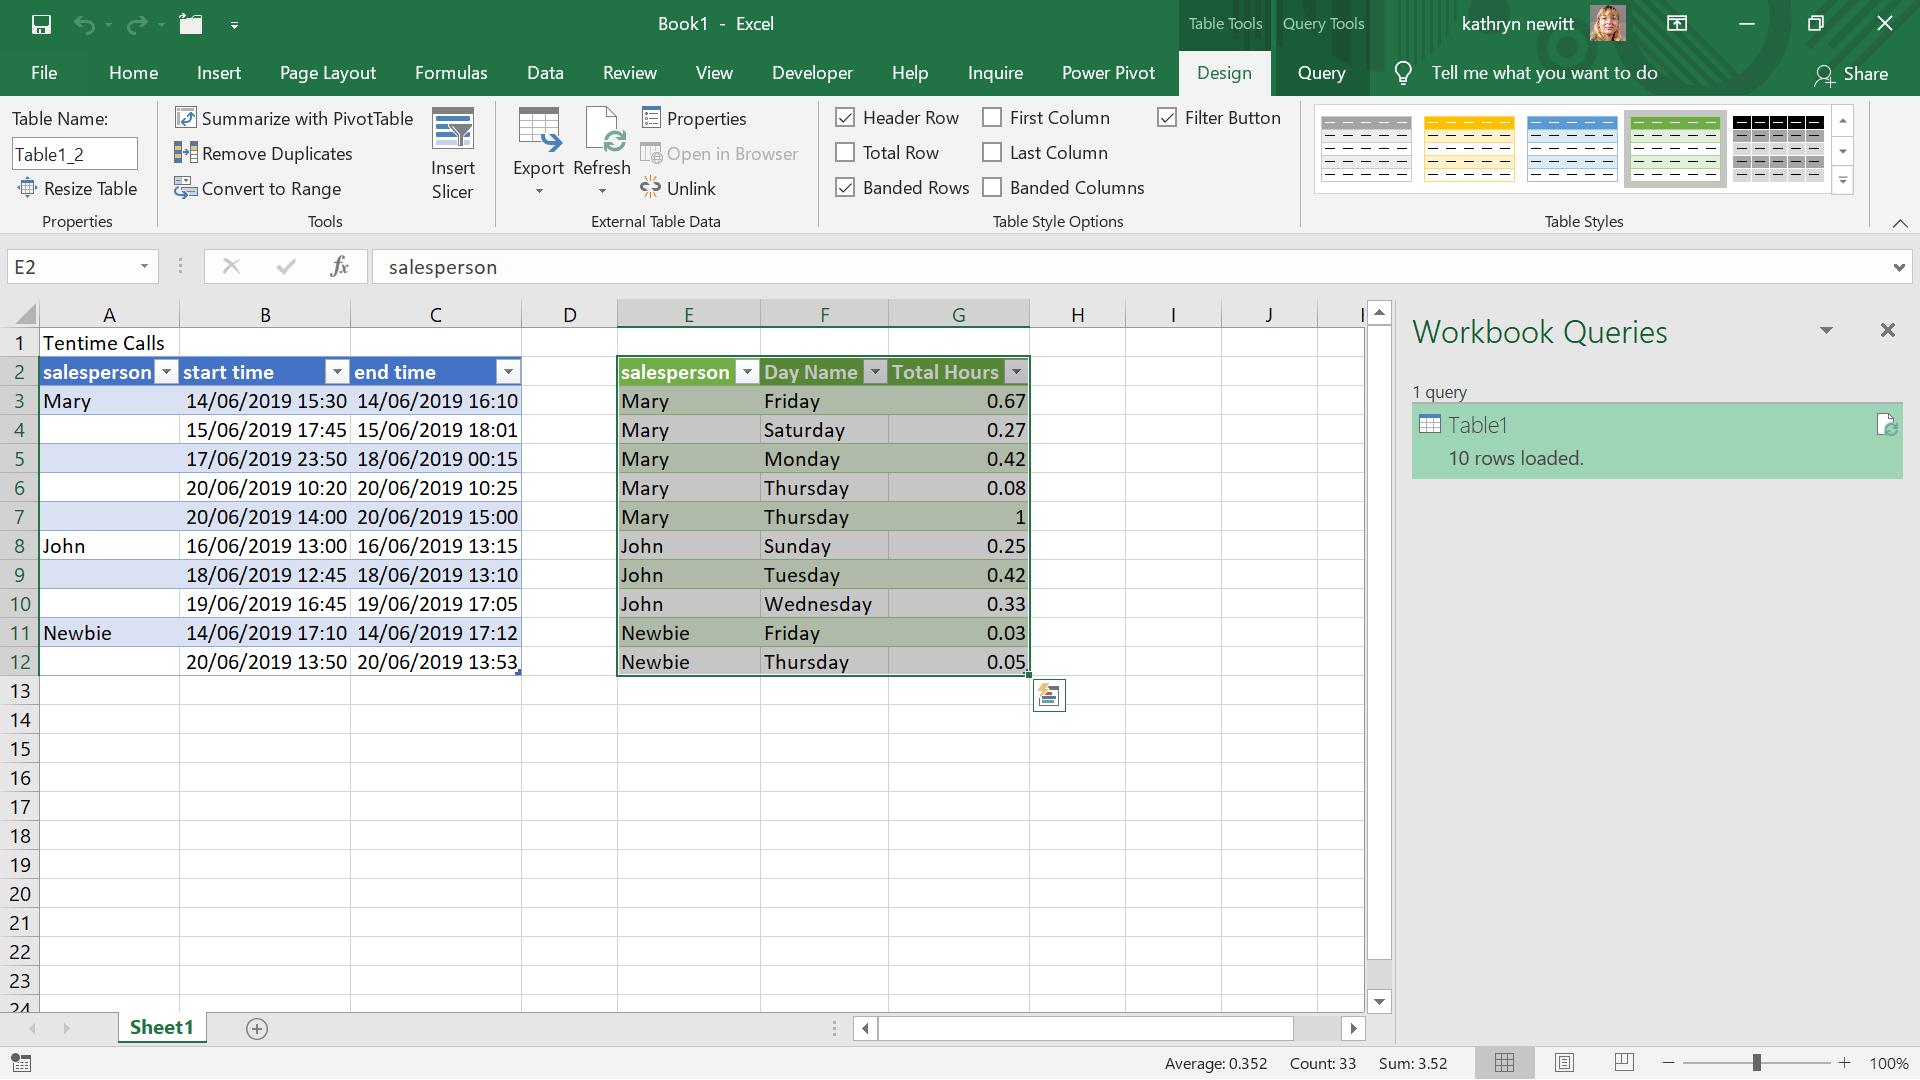
I’d also like to see the total time spent per salesperson on this sheet, so I take a copy of my query.
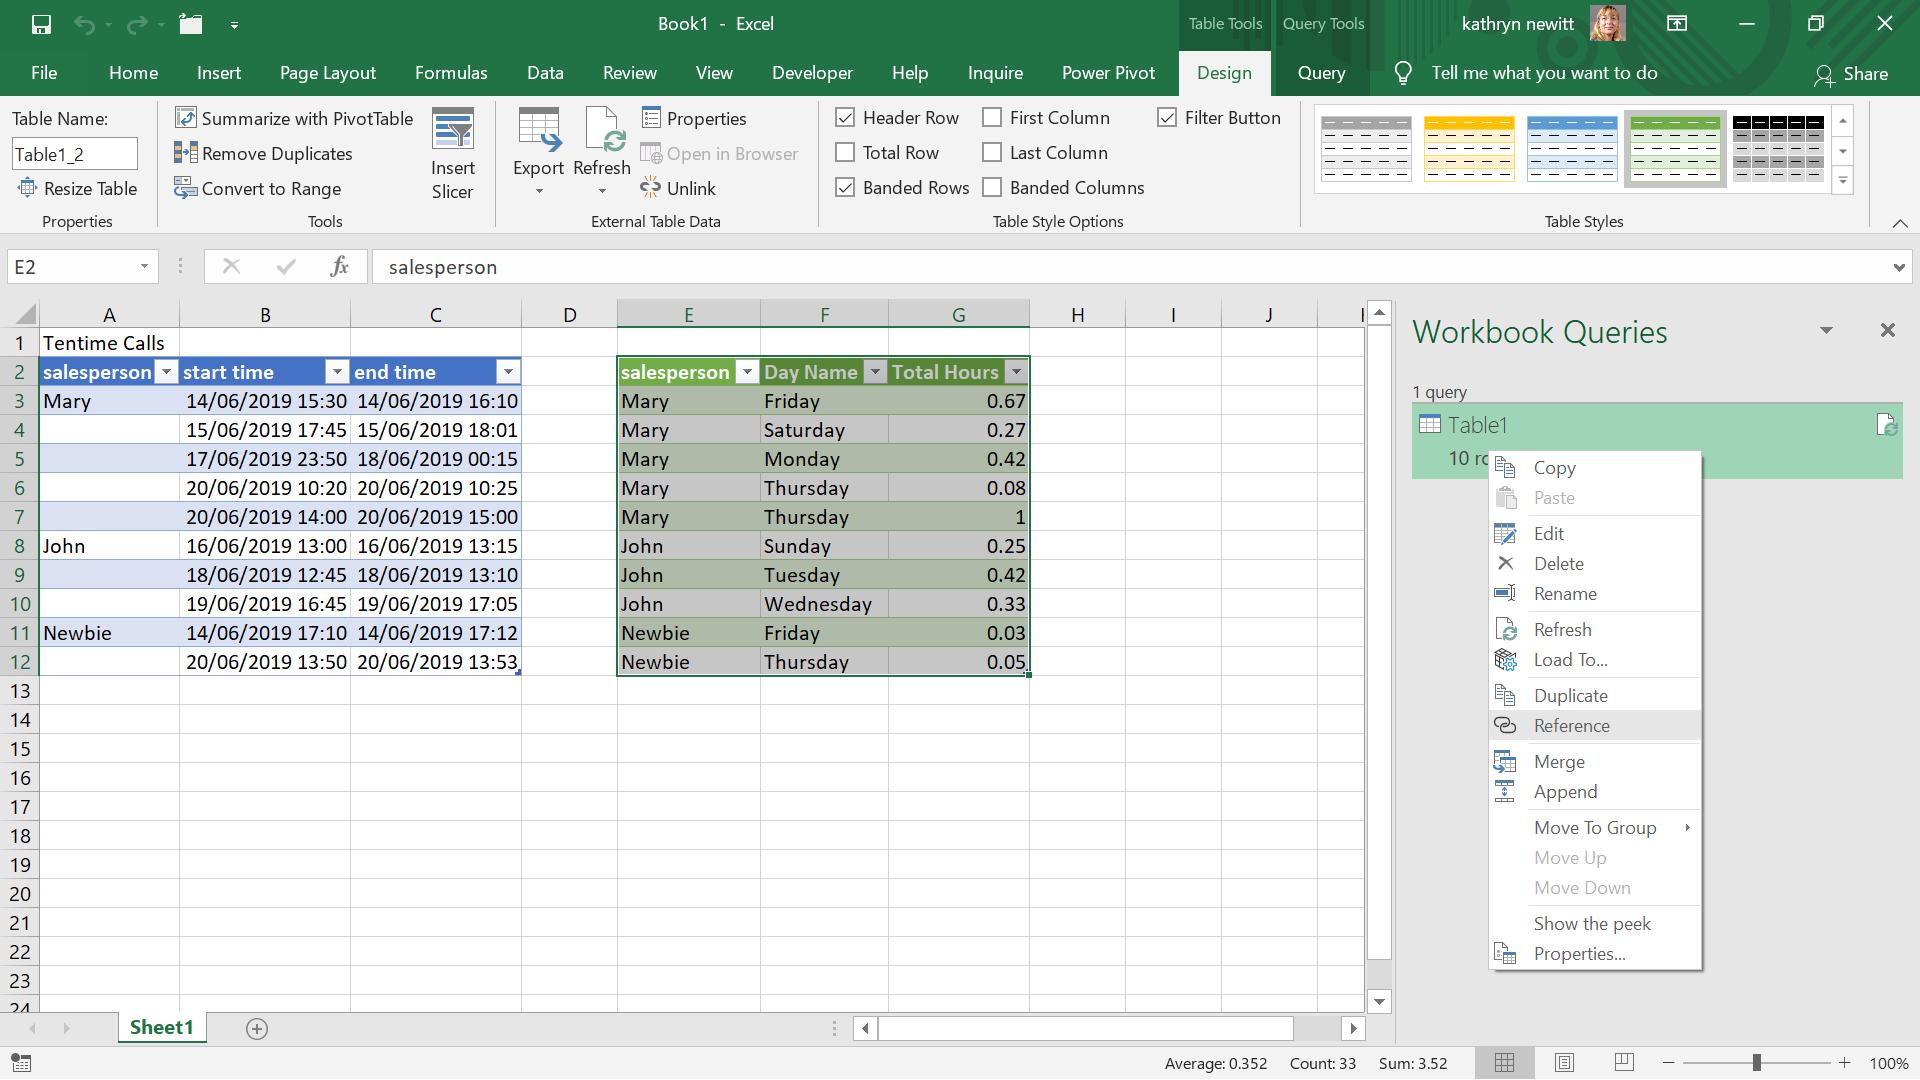
I am going to use a reference query, because my new query extends the work I have done to get the first table, and I want any further changes to my first query to change this query too. For more on reference queries, please see Power Query: Reliable References.
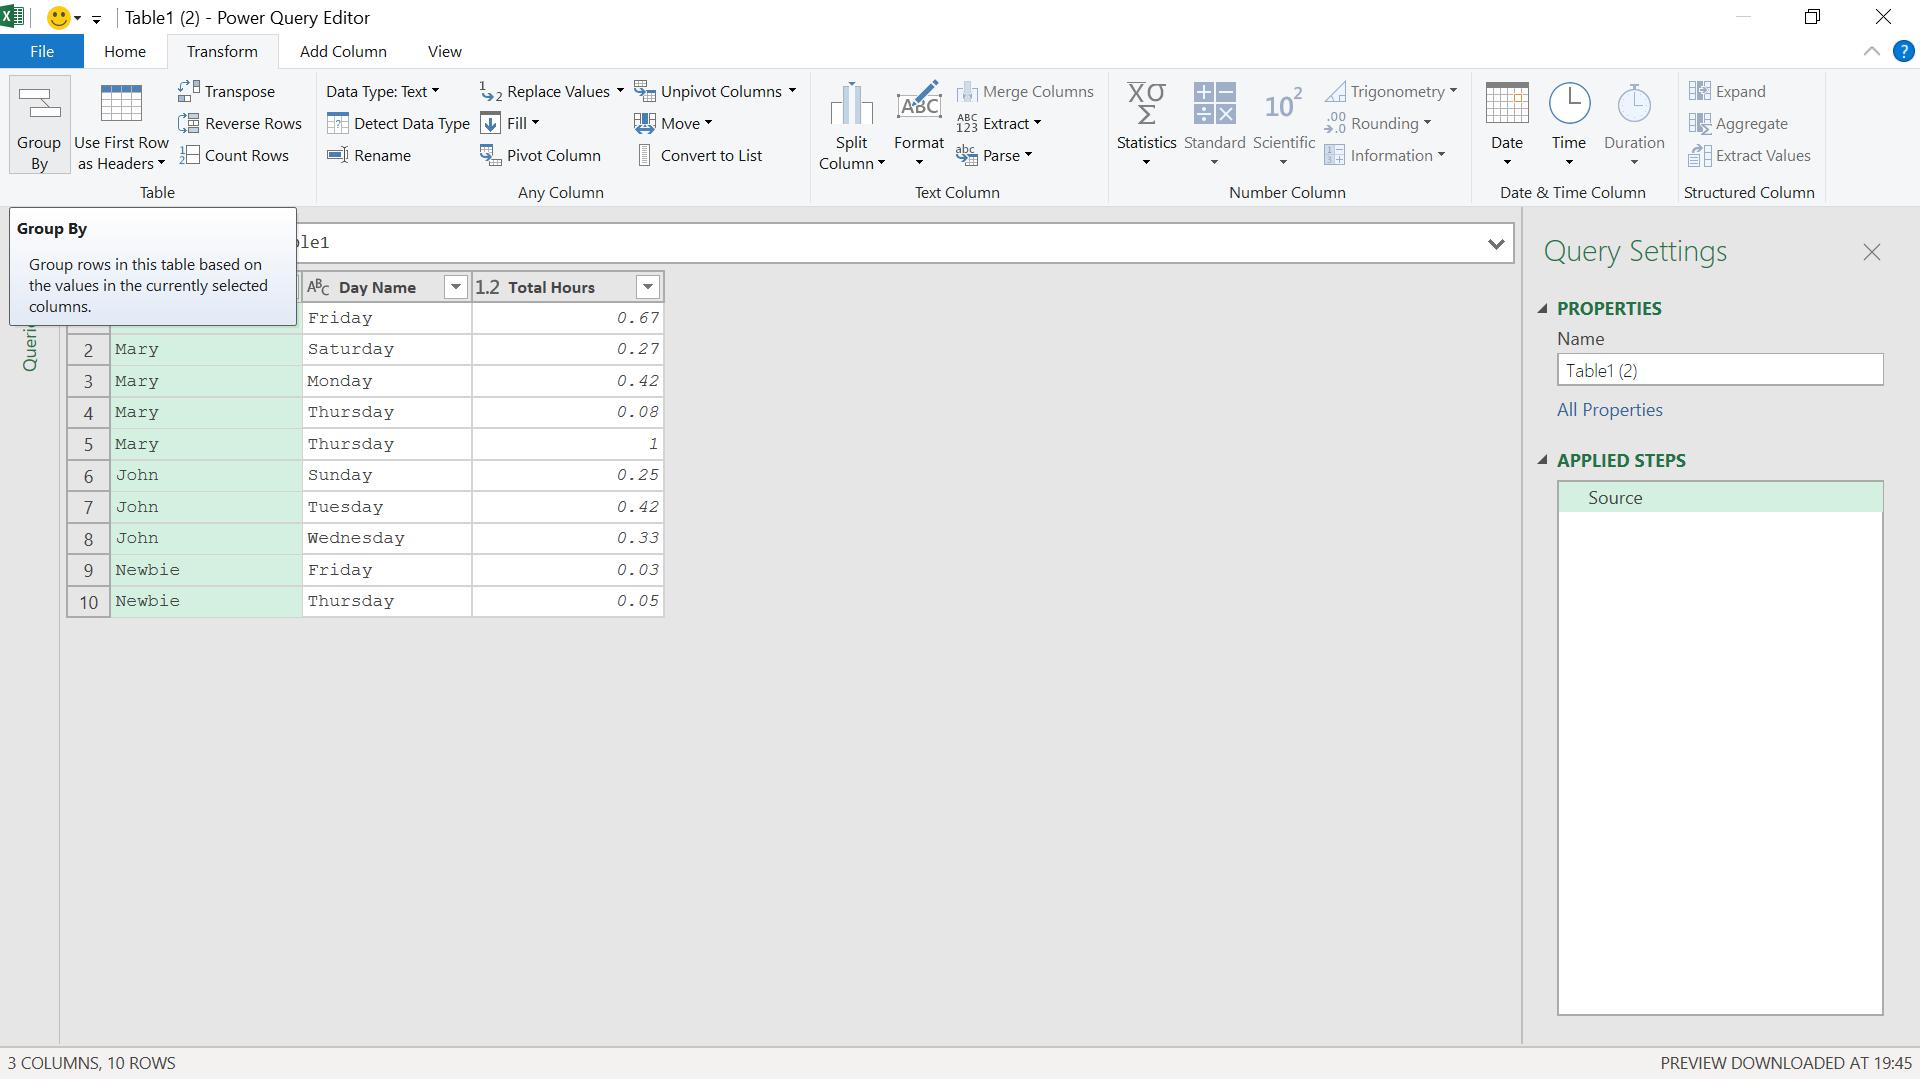
I can now use ‘Group By’ on the Transform tab.
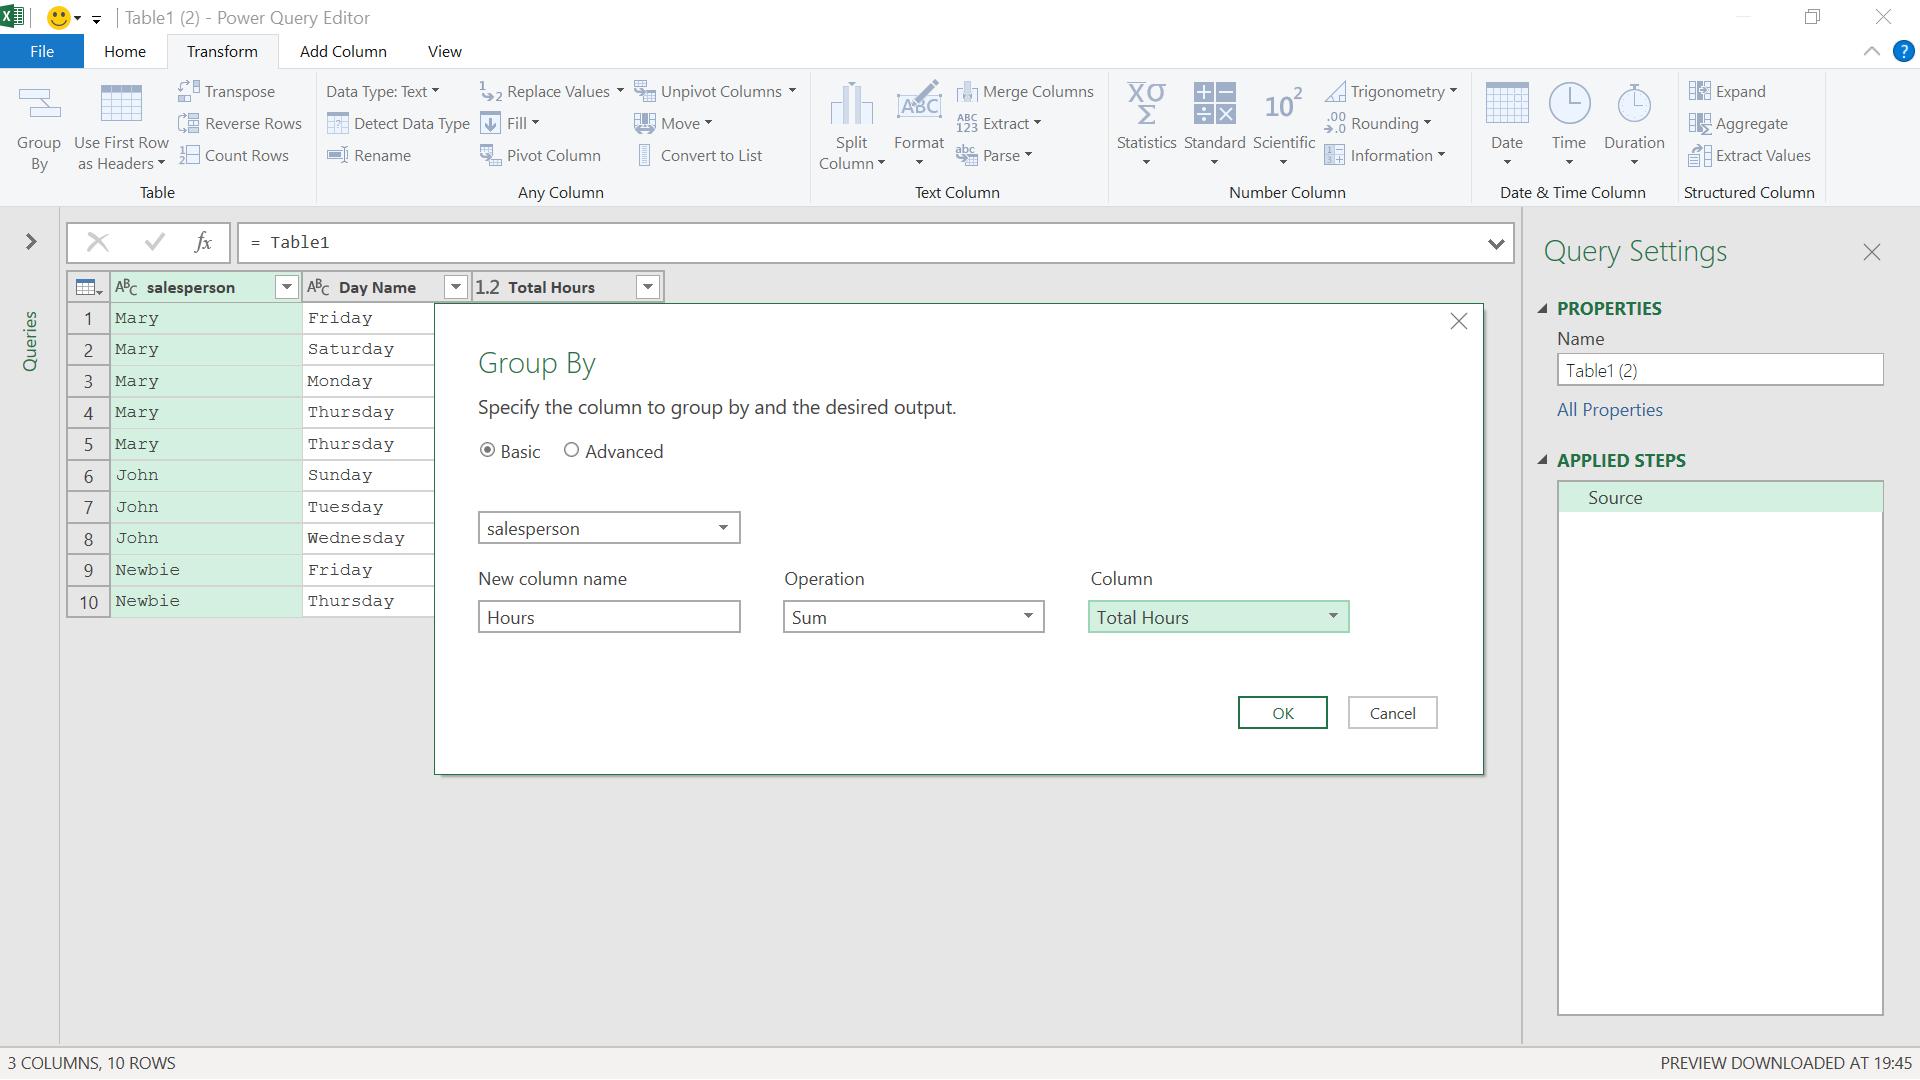
I choose to sum the Total Hours column by salesperson.
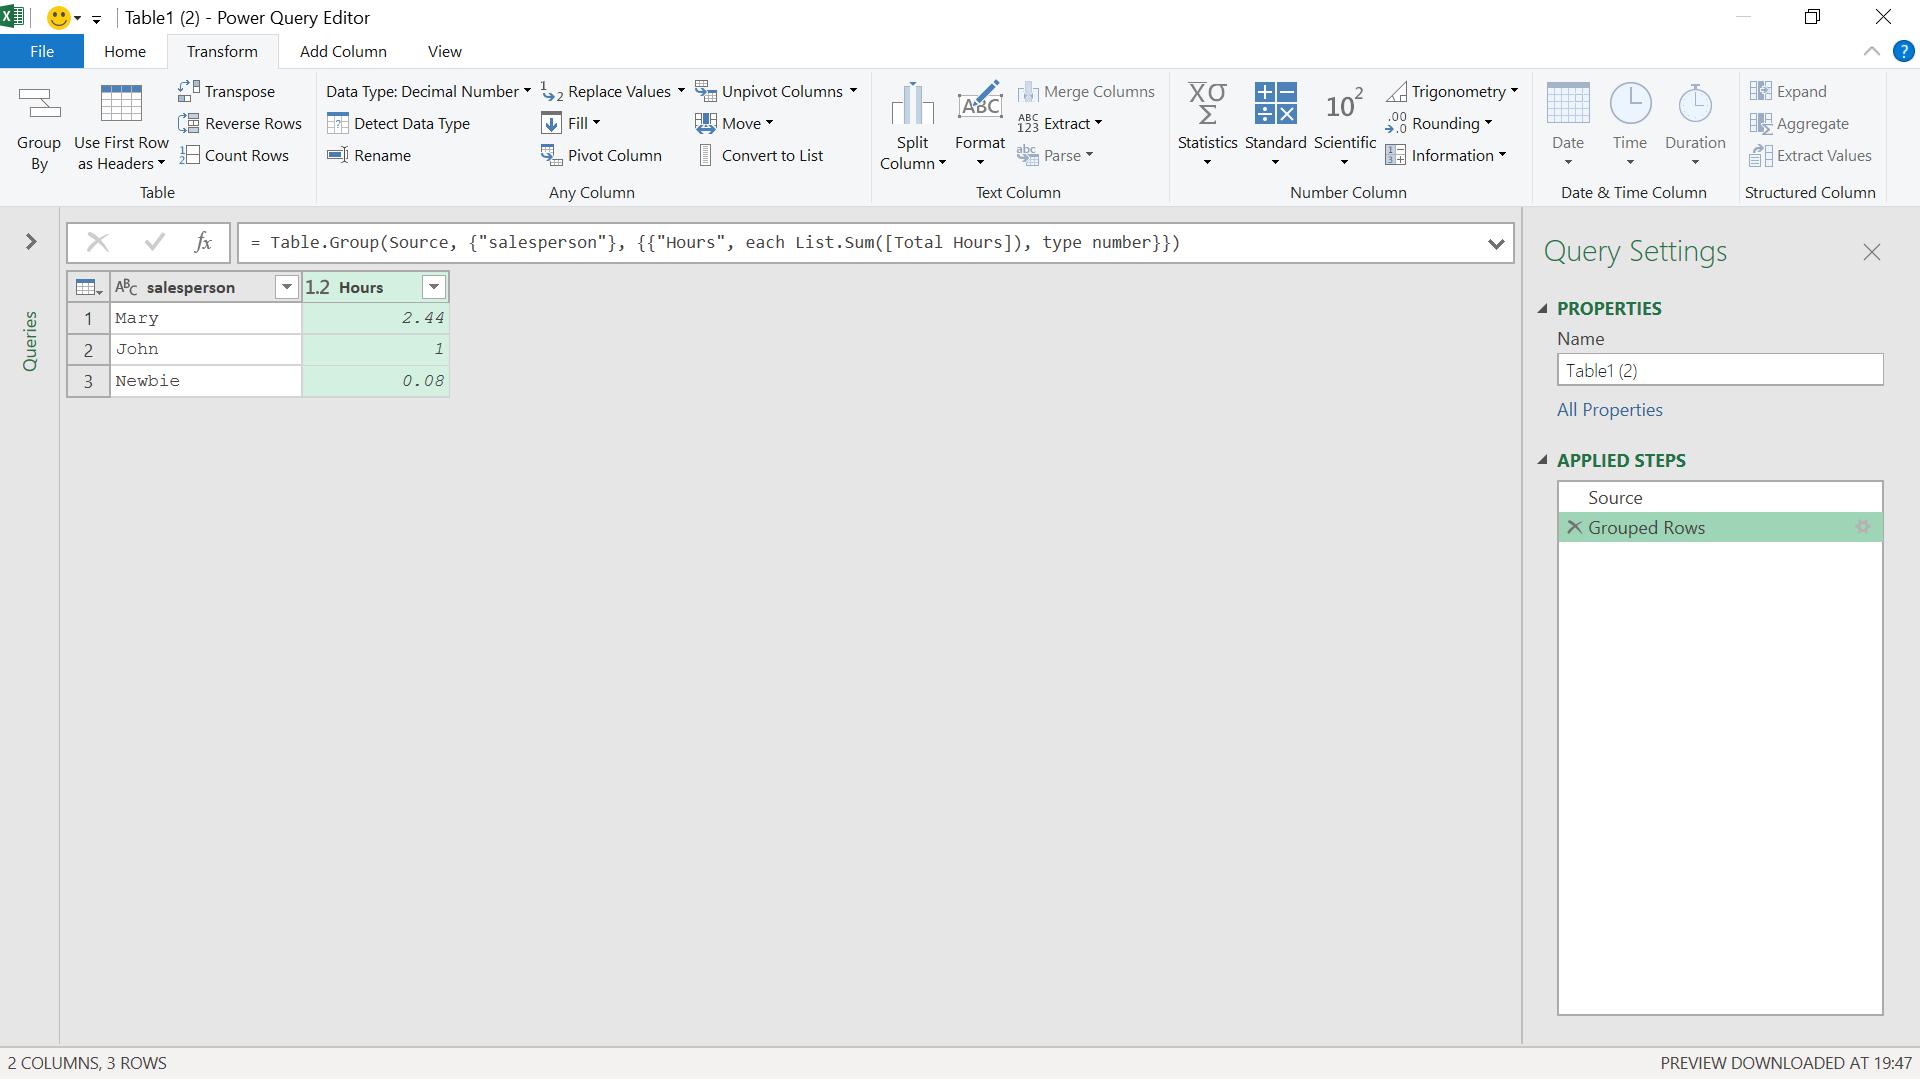
I have my results, which I could show as hours and minutes; I can do this by changing the data type to duration on the Transform tab.
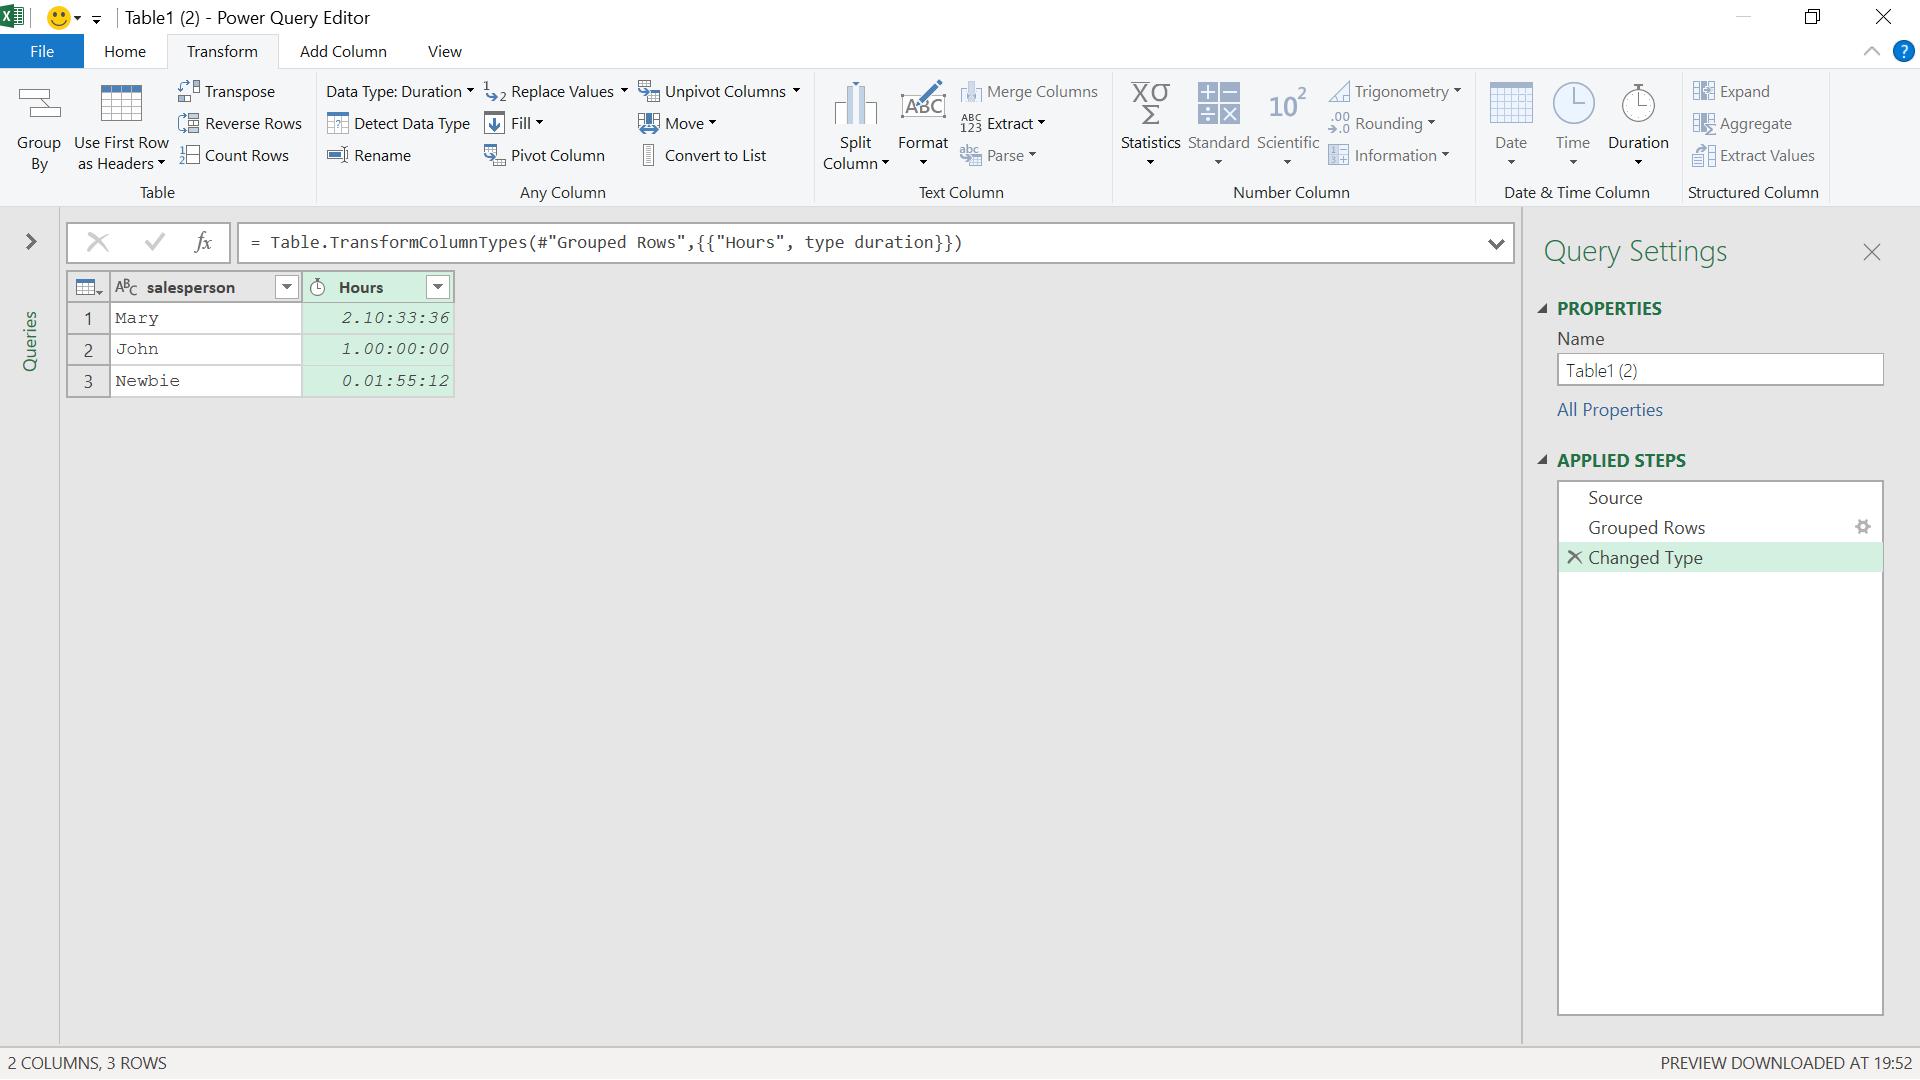
I can ‘Close & Load’ this to my worksheet.
Come back next time for more ways to use Power Query!