
Power Query: Revision Time – Part 4
1 May 2024
Welcome to our Power Query blog. Today, I continue to create a refreshable revision timetable by calculating how many times each topic should be included.
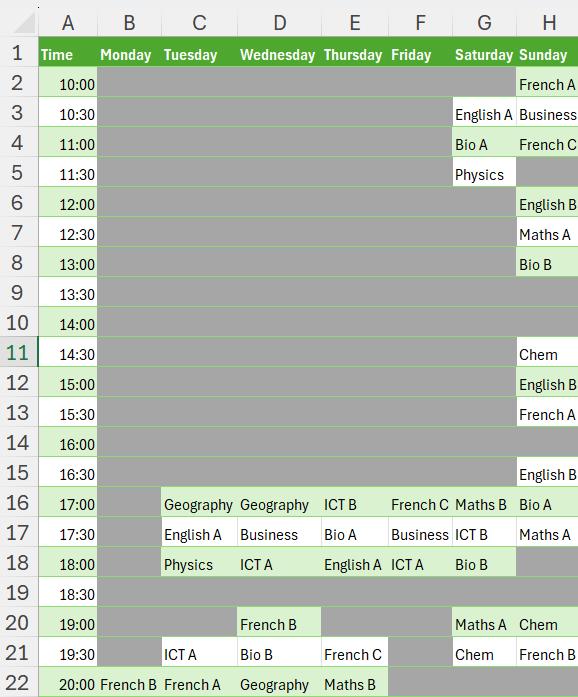
As my salespeople take a well-earned break, many students here in the UK are preparing for exams in the summer. To help my own offspring get organised, I volunteered to create a refreshable printable revision timetable. This is the result:
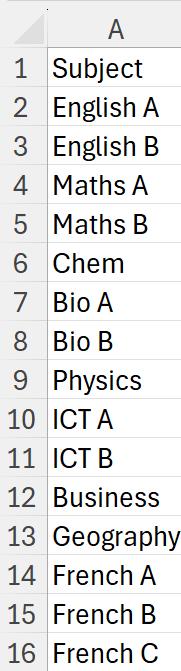
I needed a list of topics, and to begin with, I created extra entries for topics that required more timeslots:
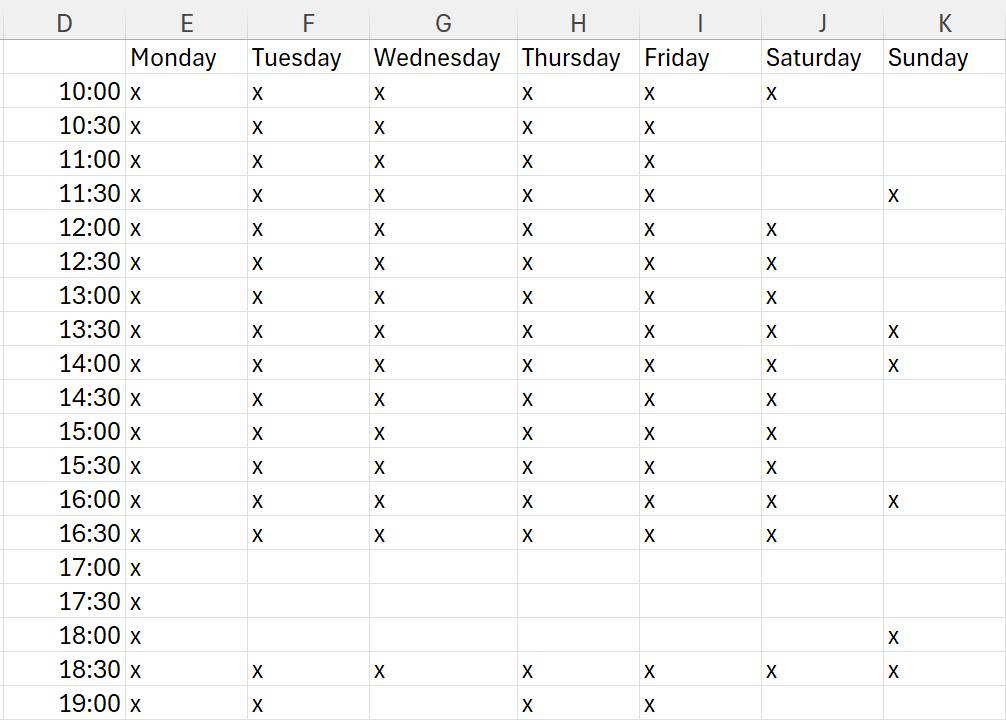
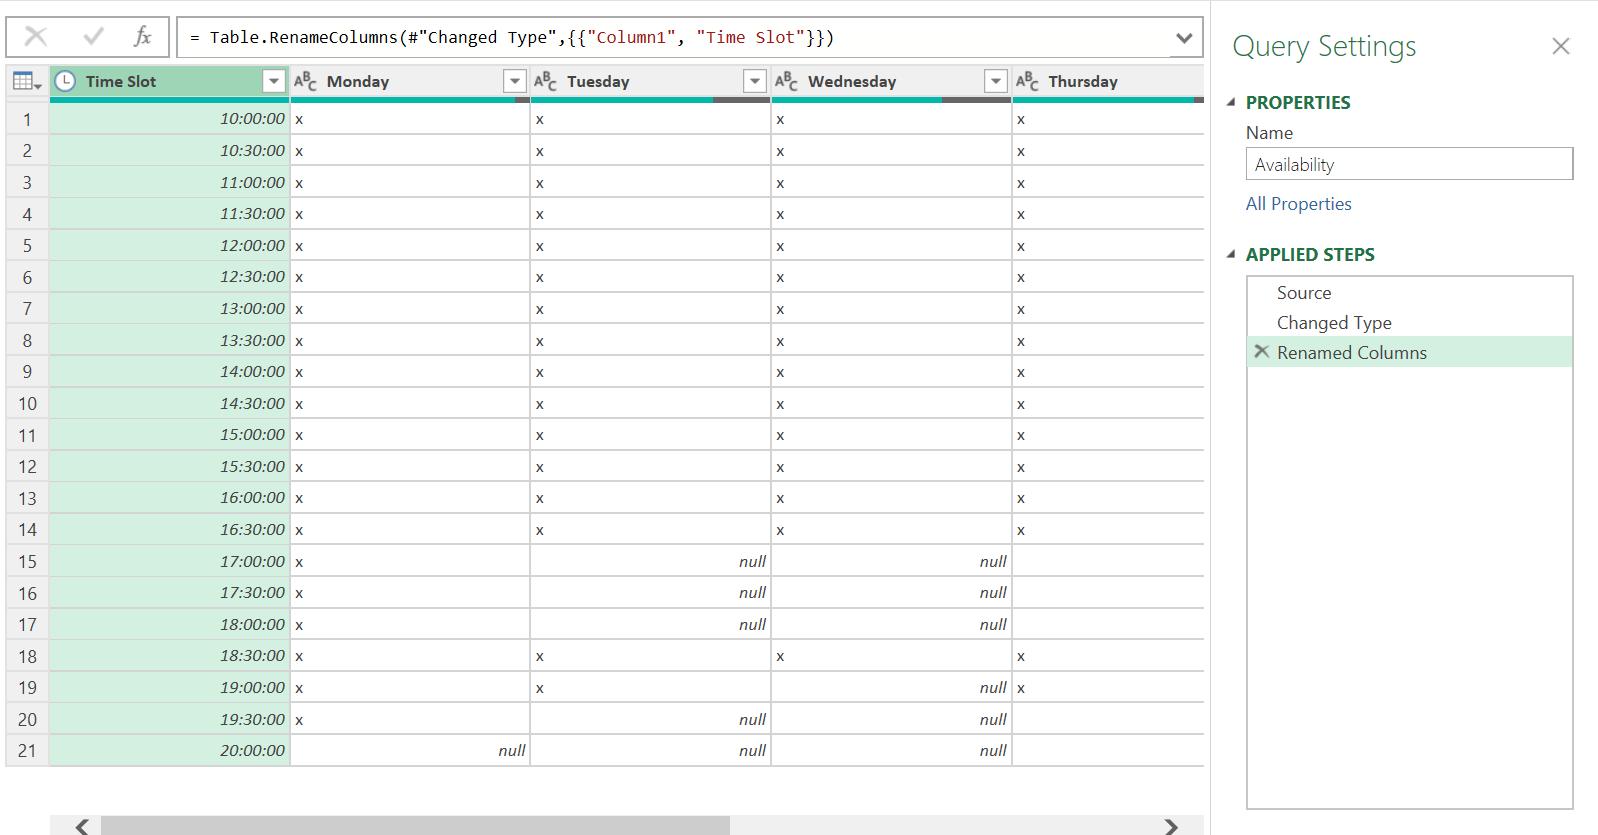
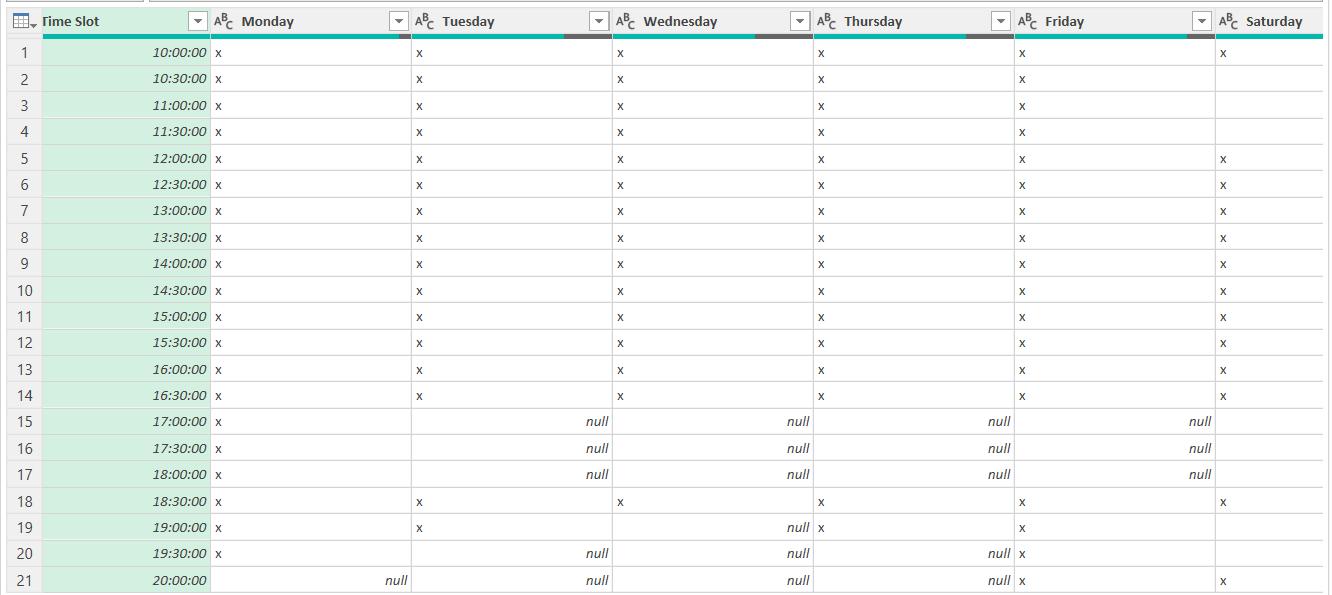
We agreed on half-hourly slots, and I created a grid so that my daughter could indicate the slots that she wouldn’t be able to revise.
When I first designed the solution, I included some Excel functions, but since this is a Power Query blog, I will ensure that I only use Power Query functions (apart from some formatting at the end!).
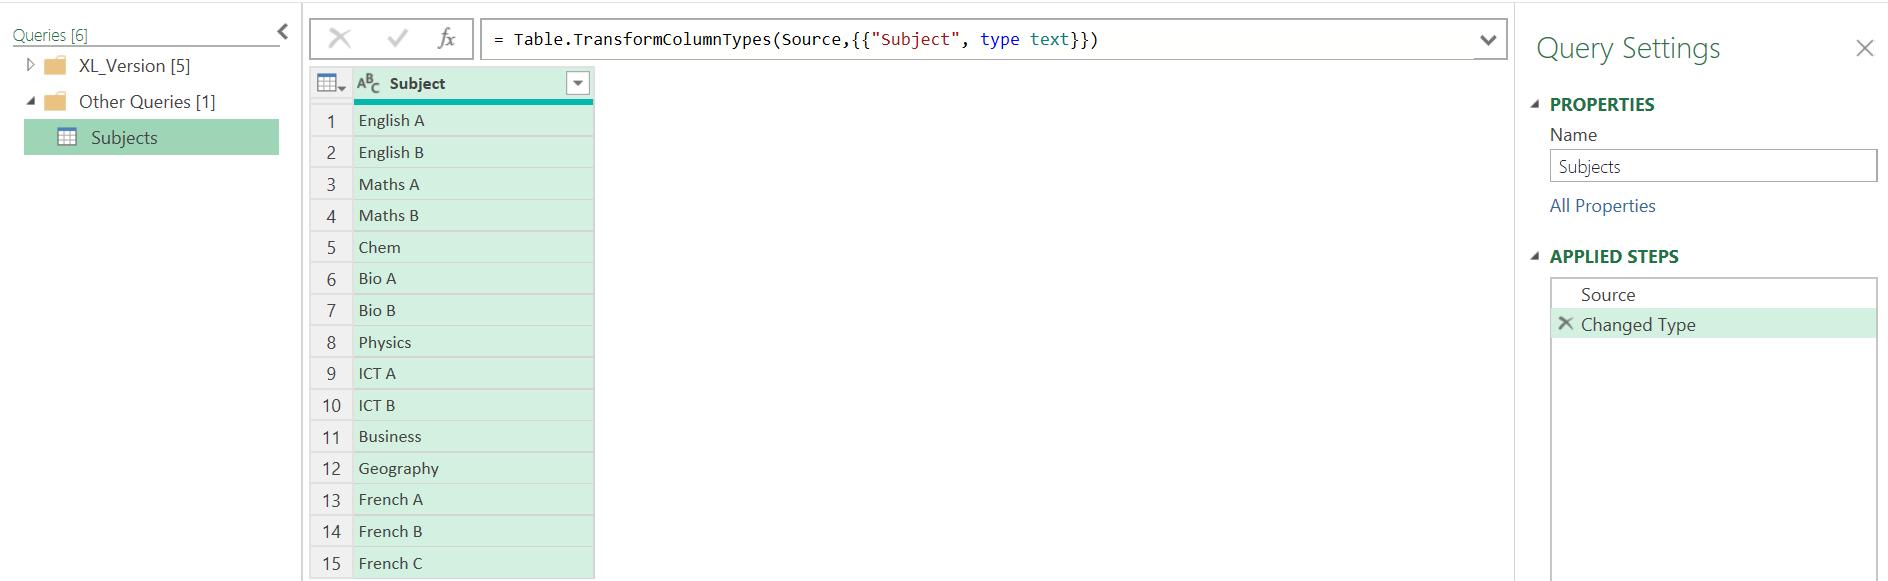
In Part 1, I converted my data into two [2] Tables: Subjects and Availability. I extracted Subjects to Power Query.
I created the Availability query by taking a copy of Subjects, and amending it:
In Part 2, I calculated the number of subjects by referencing the Subjects query and grouping the results. This gave me the Subjects_Total query, consisting of a number:

Last time, I calculated the number of slots on Availability by unpivoting some of the data first, as I needed to consider the values in multiple columns:
Solving this, I was then able to group and drill down as I had done for Subjects_Total. I now have both totals:

I can calculate how many times each subject will appear. I create a new blank query by right-clicking in the Queries pane:

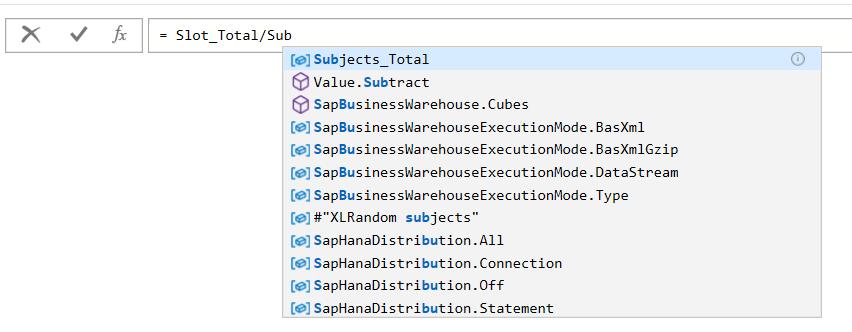
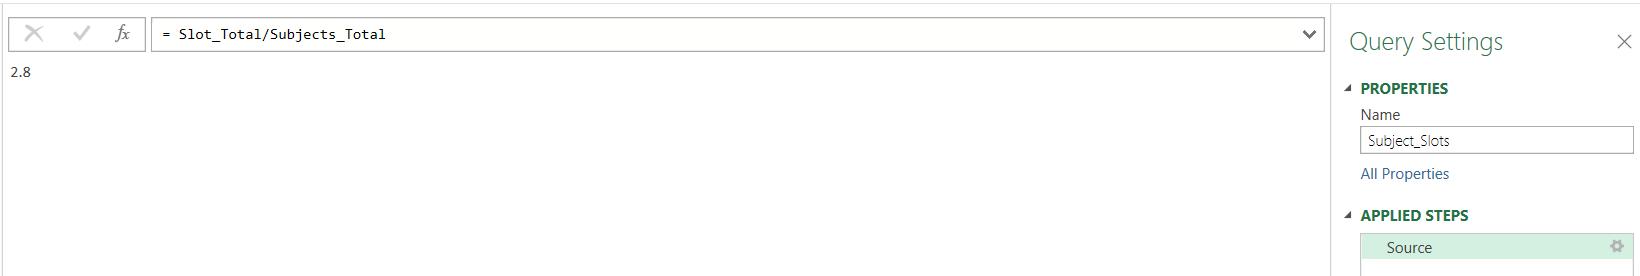
I call the new query ‘Subject_Slots’ and I type in a very simple division, using the Intellisense to help me:
This gives me the answer, here 2.8:
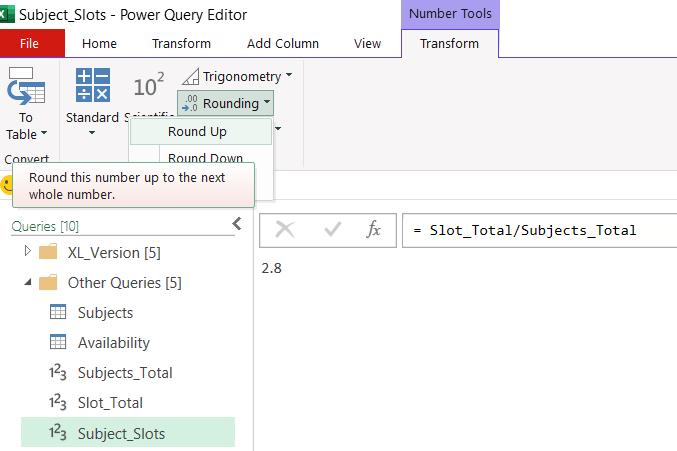
However, I am not interested in parts of slots. I need to round up to the nearest whole number, so that I have no empty slots. Since my current query is a number, I have a ‘Number Tools’ menu containing transformations suitable for numbers. On the Transform tab, I have the option to ‘Round Up’:
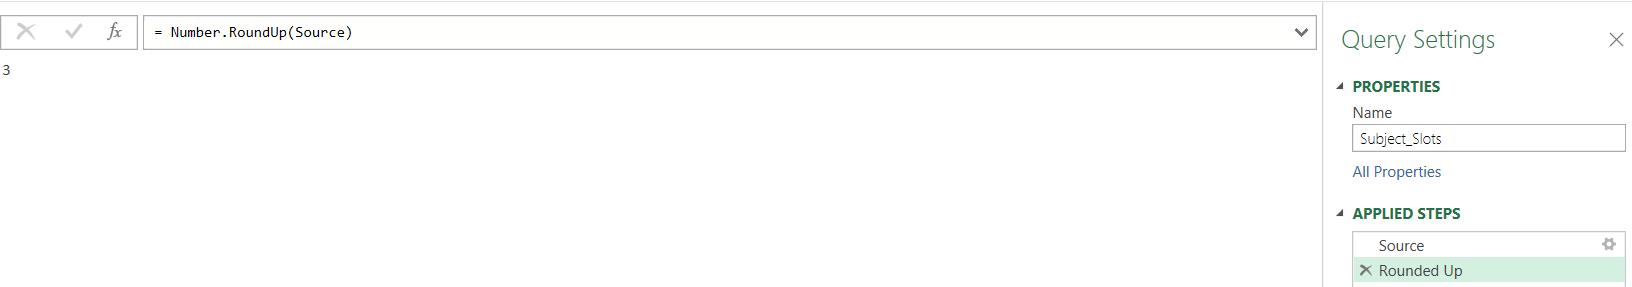
This tells me the number of slots that each subject should have, in this case, three [3]:
Now I know how many times each subject will appear on the timetable; I am ready to allocate the slots. Next week, I will create a query containing a row for each subject slot.
Come back next time for more ways to use Power Query!